Player Statistics Dashboard Design
Cansaas Agency
Overview
Football data is becoming more complex every season. Fans, analysts, scouts, and fantasy football players need more than just scores—they need meaningful insights. This Player Statistics Dashboard was designed to transform large volumes of football data into a visually engaging and easy-to-understand experience. By combining player profiles, performance metrics, transfer value tracking, match analytics, and league insights in a single interface, users can quickly evaluate a player's impact and progression without navigating through multiple screens.
The Challenge
Sports analytics platforms often struggle with balancing information density and usability. Football statistics involve numerous data points, including player attributes, transfer valuations, match events, performance trends, and tactical insights. Presenting all of this information without overwhelming users was the primary challenge. The goal was to create a dashboard that feels powerful for advanced users while remaining accessible to casual football fans.
The Solution
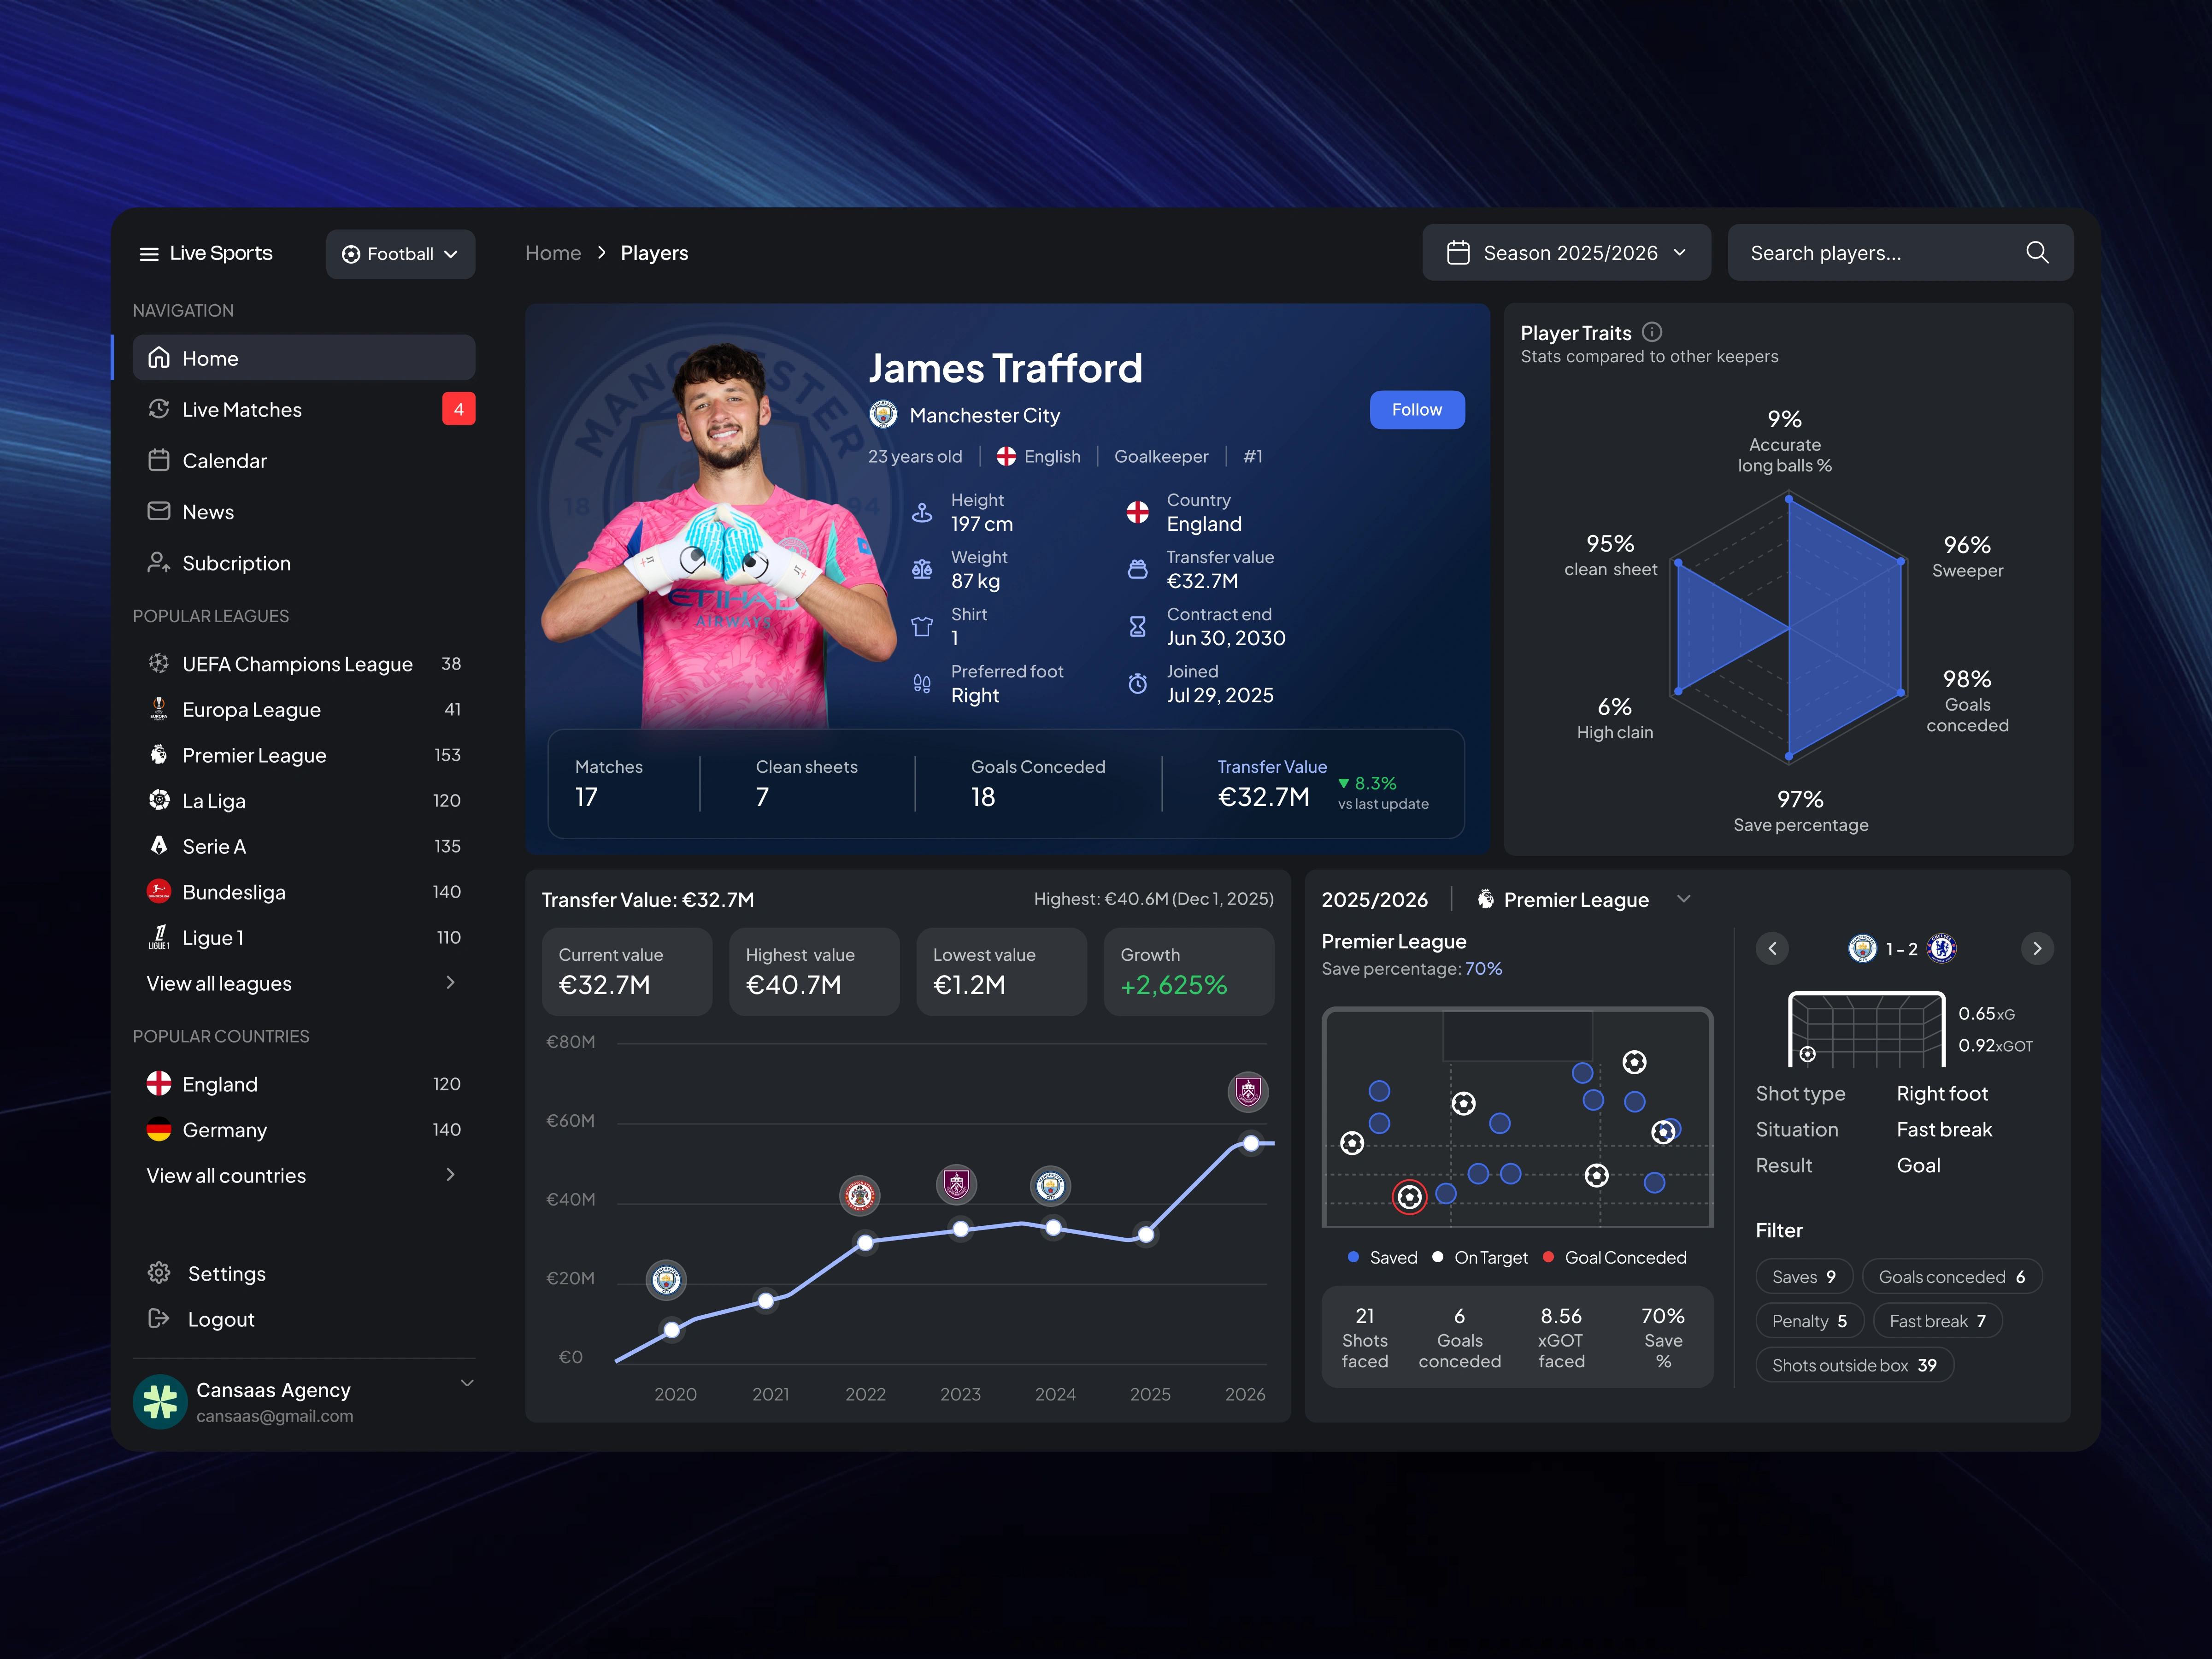
To address this challenge, the dashboard was structured around a clear information hierarchy. The player profile serves as the focal point, providing immediate access to essential information such as position, nationality, transfer value, contract details, and key performance statistics. Supporting analytics are organized into dedicated sections, allowing users to explore player traits, transfer market performance, and match-related insights without losing context.
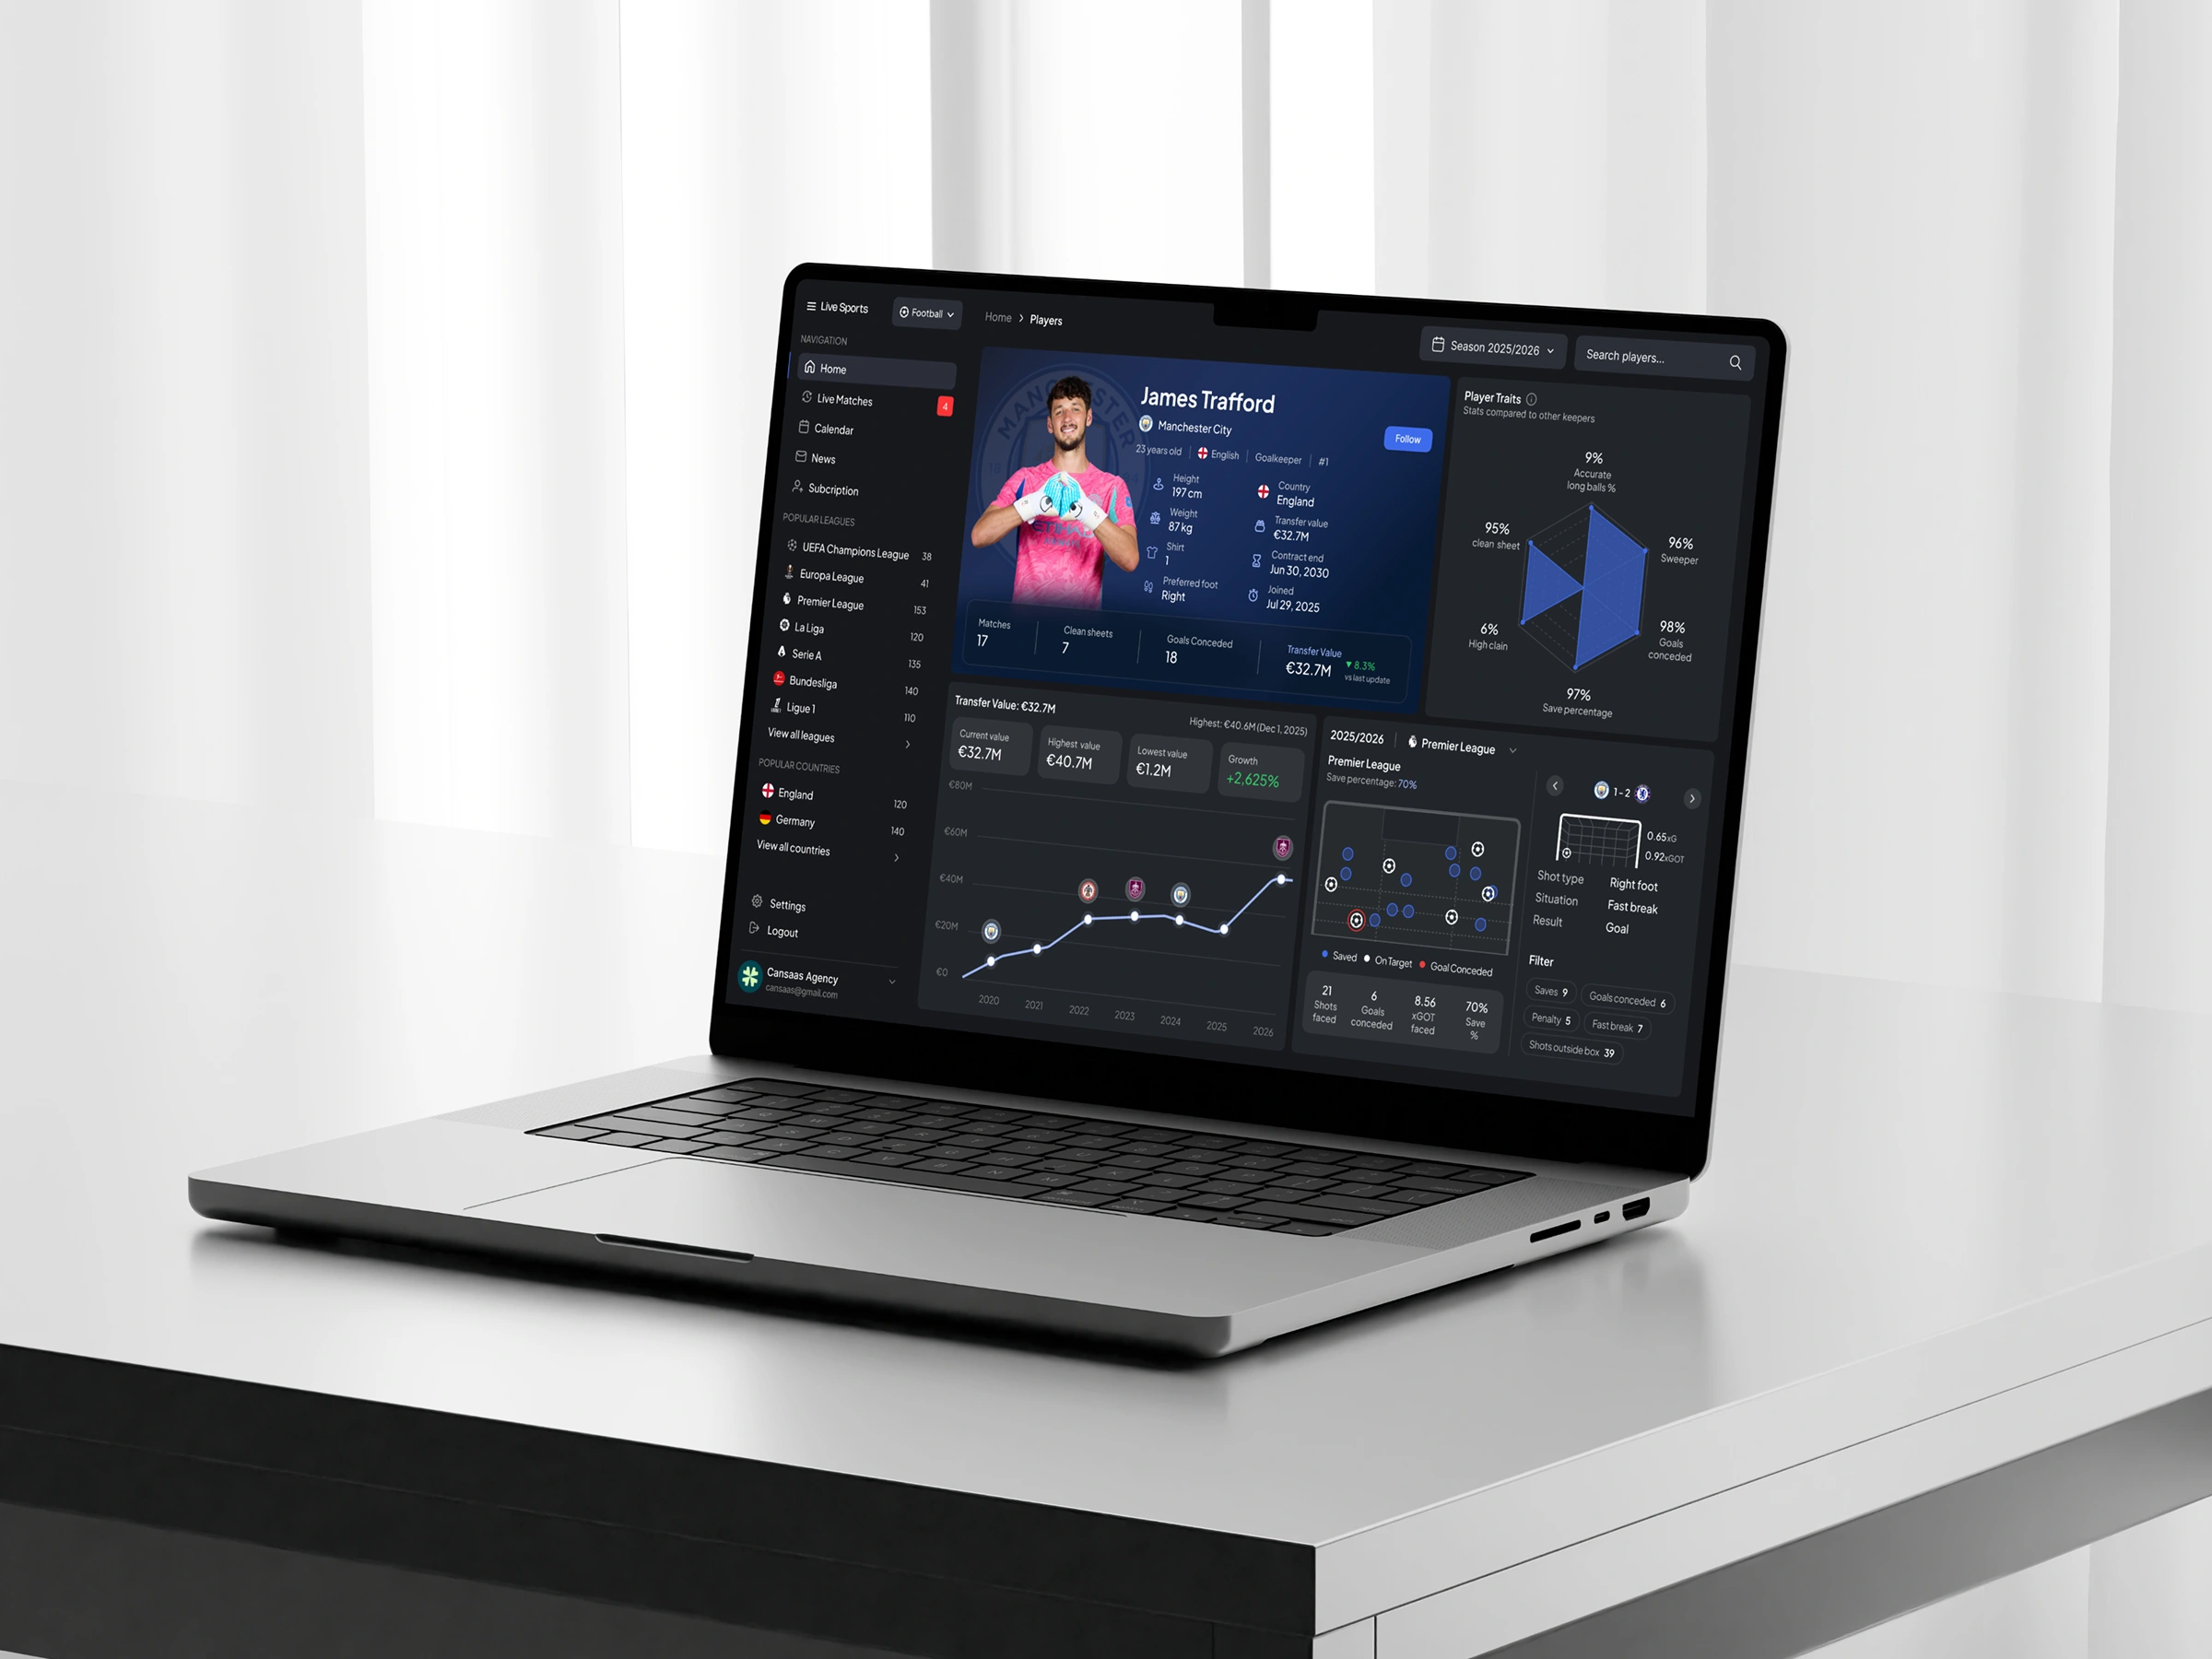
The dark visual theme enhances readability while creating a premium sports-oriented atmosphere. Strategic use of blue accent colors highlights important metrics, interactive states, and performance indicators, helping users quickly identify valuable information.
Key Features
Player Performance Overview
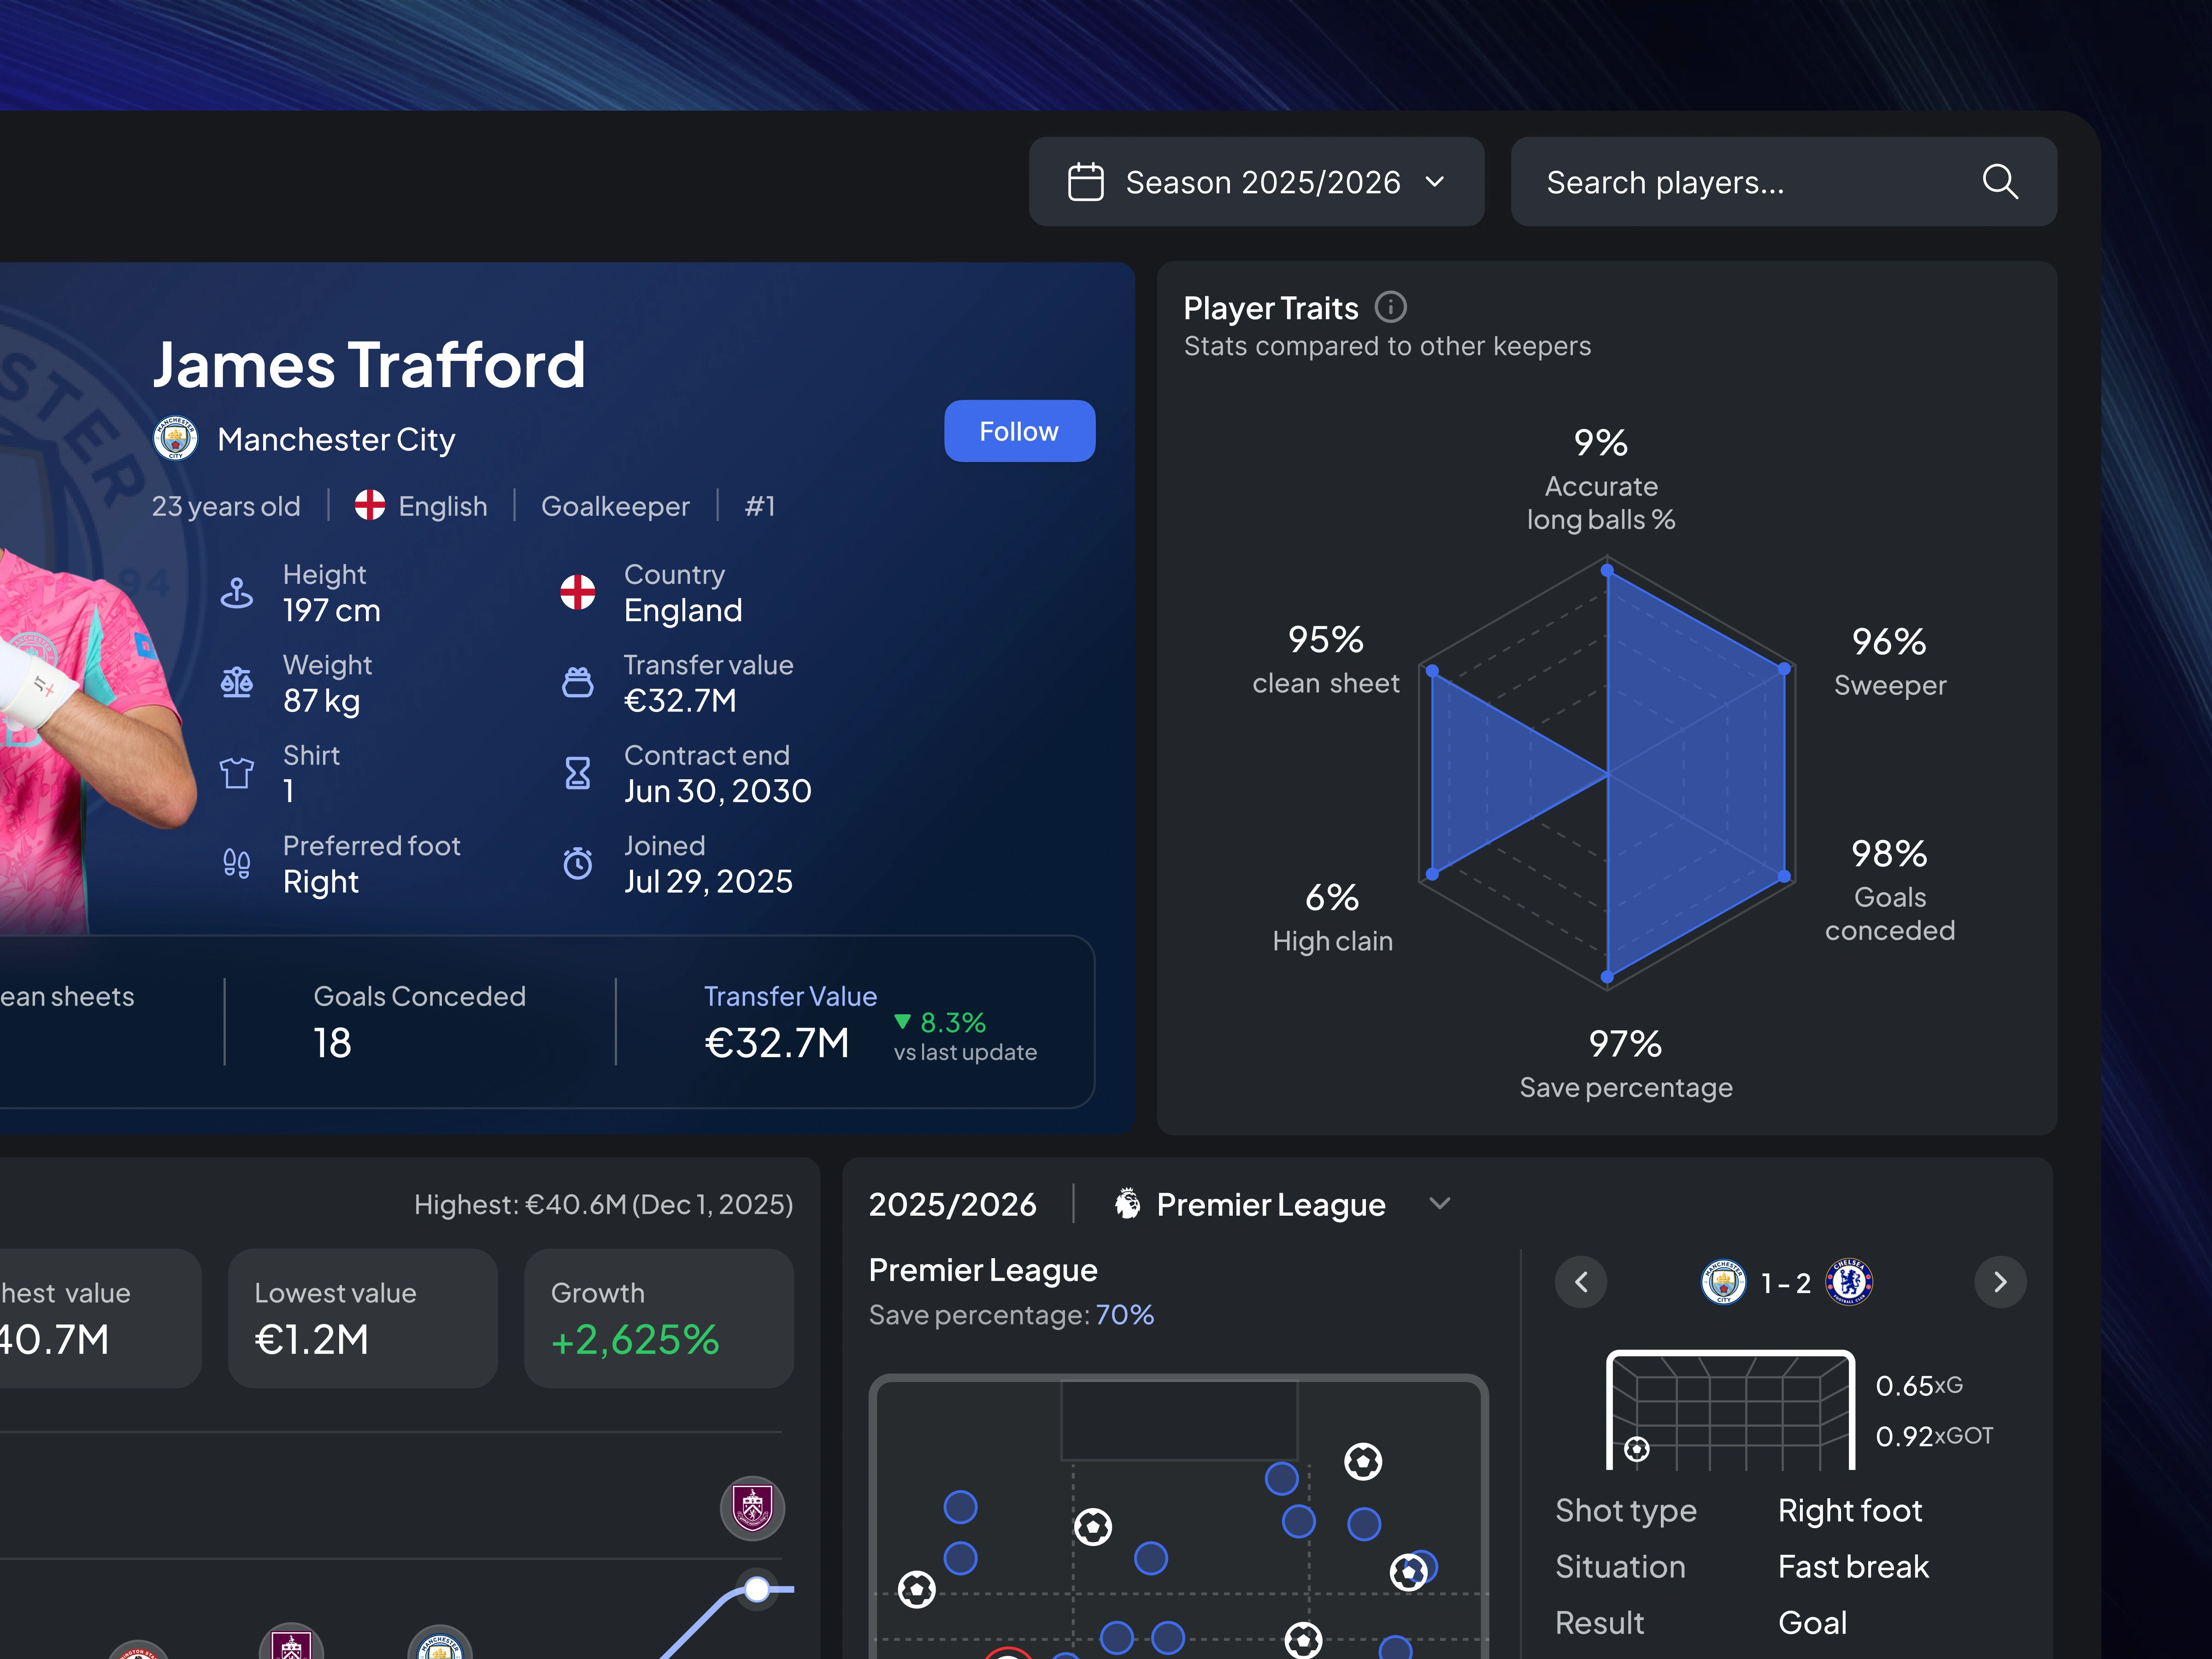
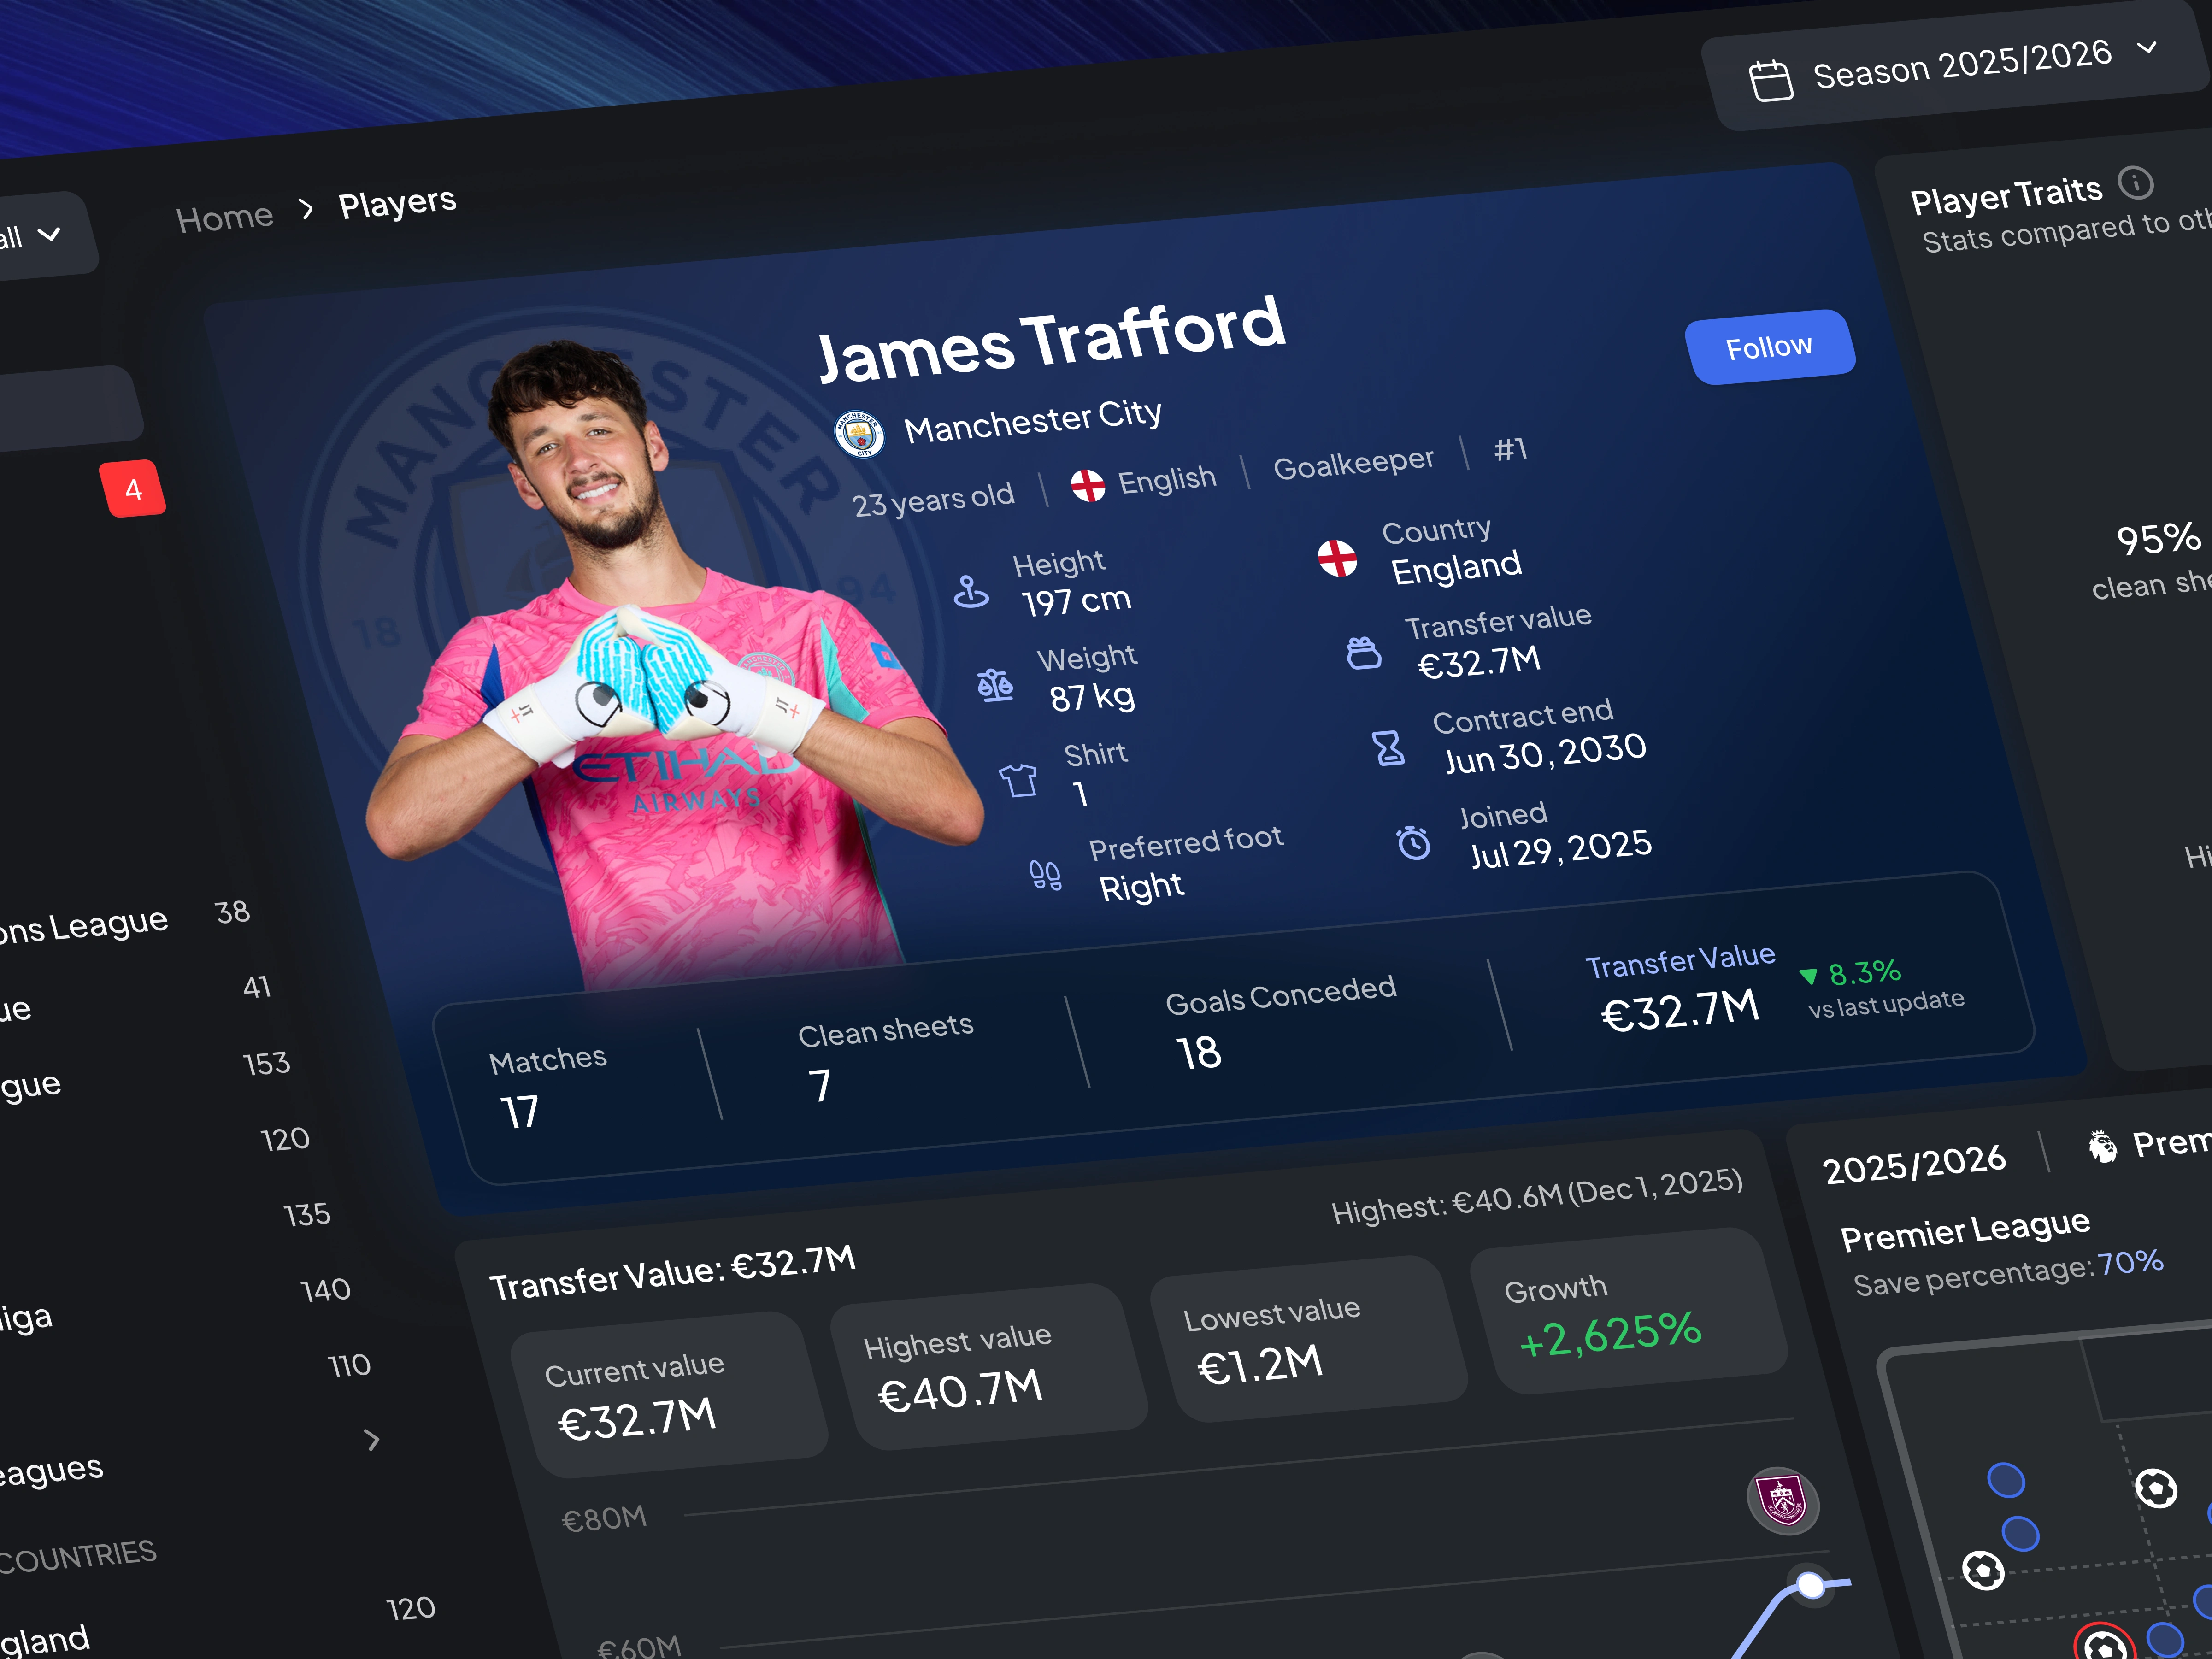
The hero section presents a complete player snapshot, including personal details, career information, transfer value, and season performance. This allows users to understand a player's current status at a glance.
Player Traits Analysis
A radar chart visualizes goalkeeper-specific attributes such as save percentage, clean sheets, sweeping ability, and distribution accuracy. This helps users compare strengths and weaknesses more effectively than traditional tables.
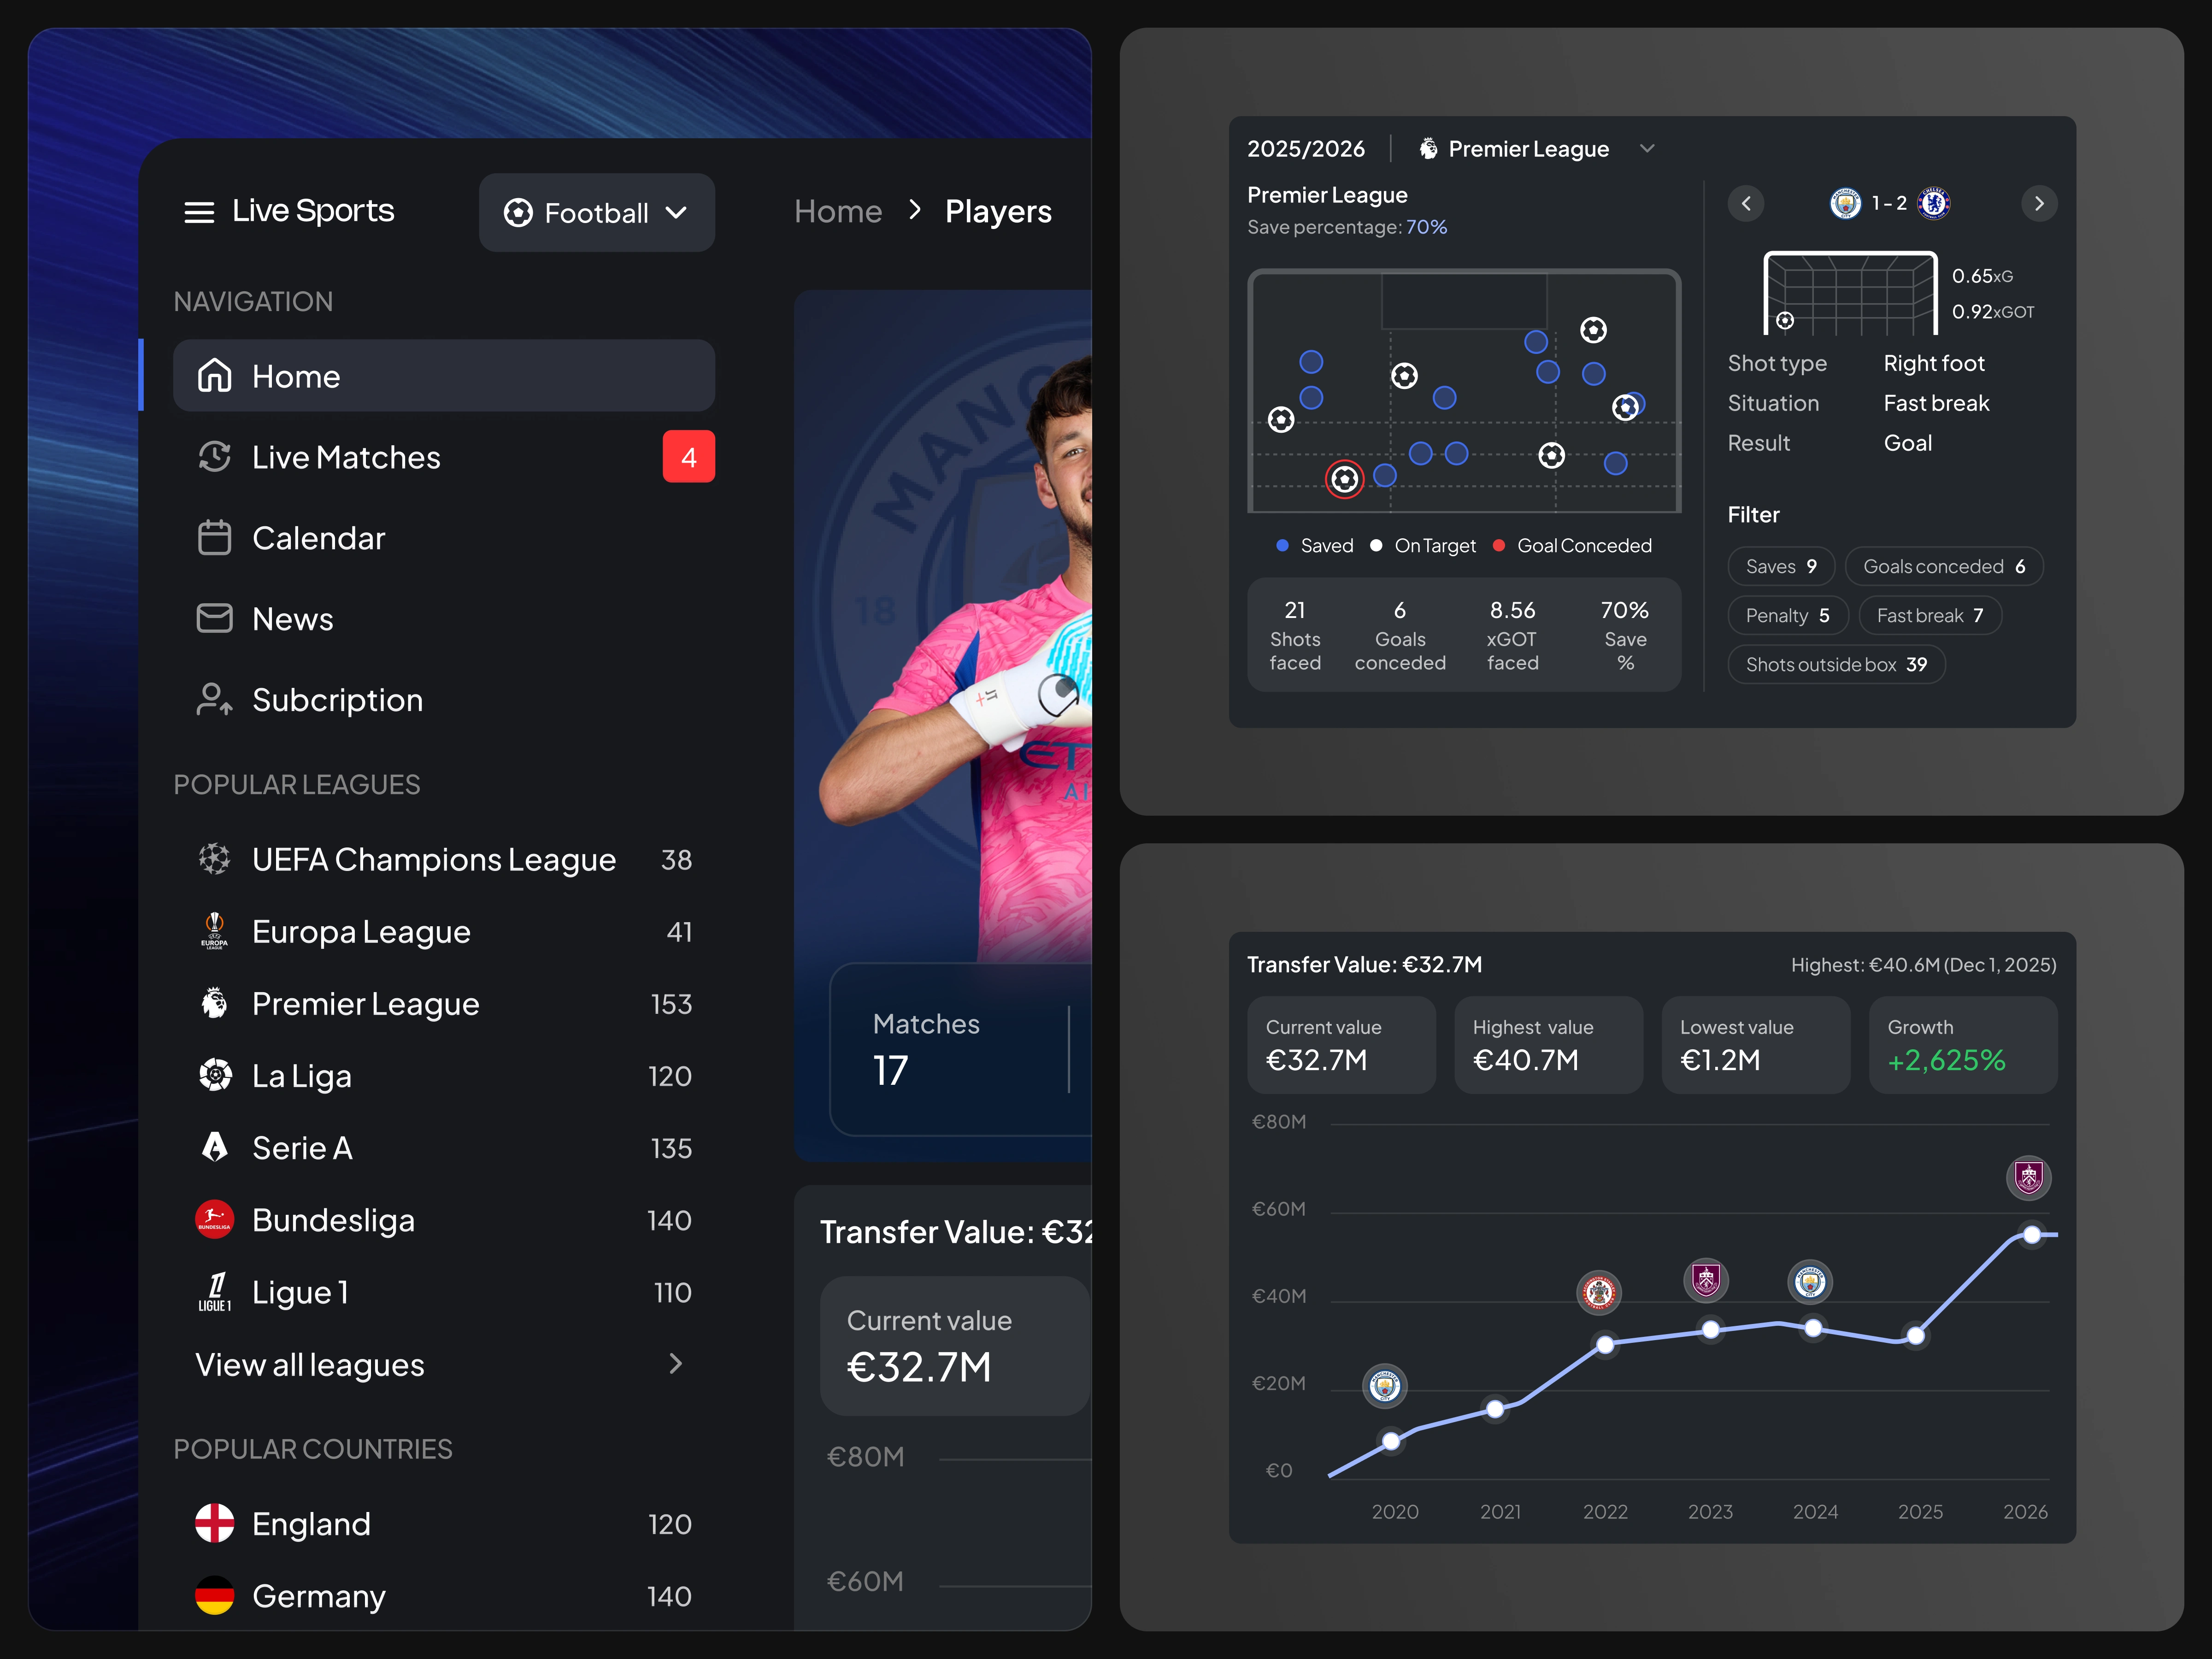
Transfer Value Tracking
Historical transfer value data is displayed through a trend chart that showcases growth patterns over multiple seasons. Key milestones and club transitions provide additional context for understanding market valuation changes.
Match Event Analytics
Shot maps and goal analysis visualizations help users examine performance beyond basic statistics. By visualizing saved shots, goals conceded, and shot locations, the dashboard provides deeper tactical insights into player performance.
League & Competition Navigation
Users can easily explore data across different leagues, competitions, and countries through a structured navigation system designed for quick access and efficient browsing.
Outcome
The final result is a comprehensive football analytics dashboard that combines live sports data, player statistics, transfer market insights, and performance analysis into a single cohesive experience. The interface enables users to move from high-level player evaluation to detailed match analysis seamlessly, making football data more accessible, actionable, and engaging.
Whether used by football enthusiasts, fantasy sports players, scouts, analysts, or sports media platforms, this dashboard demonstrates how thoughtful UI/UX design can transform complex sports data into meaningful insights.
Like this project
Posted Jun 19, 2026
Designed a football analytics dashboard for easy, engaging player insights.
Likes
1
Views
13