Scout: AI-assisted forecast research —

Tamzid Ullah


Scout: AI-assisted forecast research — Quantura
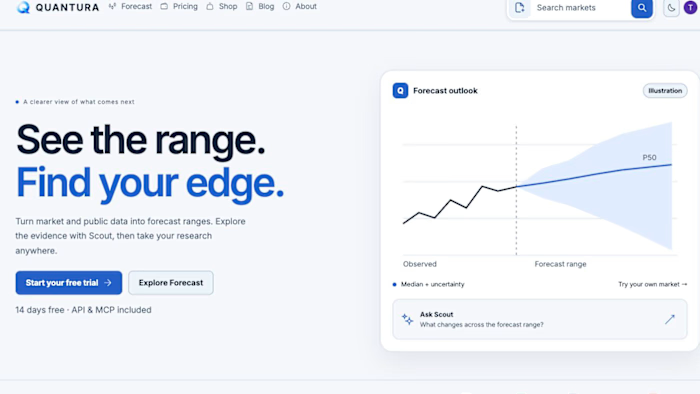
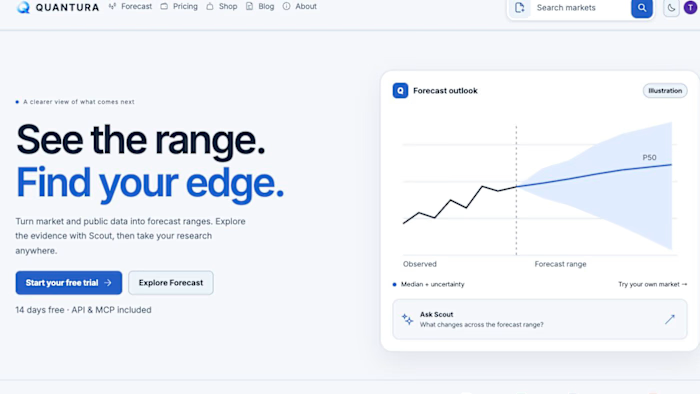
I built Scout inside Quantura to help users interrogate the history and forecast they are actually viewing. Three contextual question cards organize the experience around Forecast, History and Evidence.
Users can inspect median changes and uncertainty ranges, ask about observed highs and lows, and review data sources and units. Structured answers use the selected observations and forecast values as context.
The interface also supports chart annotations, user notes, saved conversations, and named CSV previews before forecasting. The goal is to make a forecast easier to inspect, explain and revisit.
My work combines TypeScript backend logic, a JavaScript research interface and interactive charting.
Explore: https://quantura.studio/forecasting
Like this project
Posted Oct 12, 2026
Scout: AI-assisted forecast research — Quantura I built Scout inside Quantura to help users interrogate the history and forecast they are actually viewing. T...
Likes
0
Views
0