Divvy Trip Data Analysis - Python

Sukhmandeep Singh


Objective: To gain insights into customer behavior and usage patterns of Divvy bikes, a popular bike-sharing service in Chicago.
Data: The analysis utilized historical Divvy bike trip data, including information on start and end stations, timestamps, user types (casual or member), and bike types.
Key Questions:
Customer Preferences: What types of bikes are most popular among Divvy riders? Are there any differences in preferences between casual and member users?
Usage Patterns: When are peak usage times and days of the week? How do these patterns vary seasonally?
Station Popularity: Which stations are the most popular for both starting and ending trips? Are there any geographic trends?
Trip Duration: What is the average trip duration? Are there any significant differences between casual and member users?
Analysis Techniques:
Descriptive Statistics: Calculated summary statistics for variables such as trip duration, start and end times, and bike types.
Data Visualization: Created visualizations like histograms, bar charts, and maps to explore data trends and patterns.
Time Series Analysis: Analyzed seasonal and weekly trends in bike usage to identify peak periods.
Geographic Analysis: Used mapping techniques to visualize station popularity and identify geographic clusters.
Like this project
Posted Sep 5, 2024
Analyzed bike usage patterns to understand customer preferences, peak times, station popularity, and trip durations. Discovered trends in bike types, seasonals.
Likes
0
Views
3


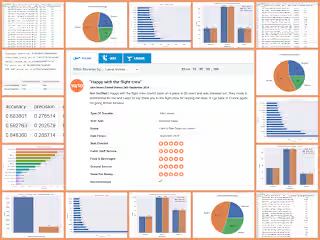
British Airways Customer Reviews Analysis
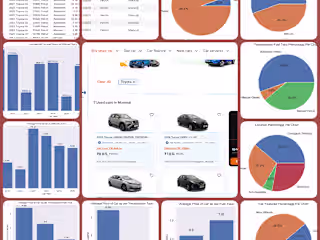
Web Scraping Car Details from Cars24.com
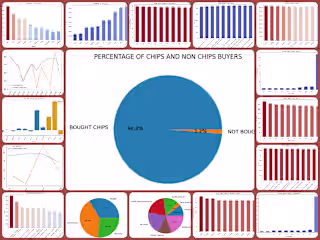
Chips Customer Insights and Purchasing Behavior Analysis