Executive Dashboard for Insurance Companies
Varad Parulekar
The background
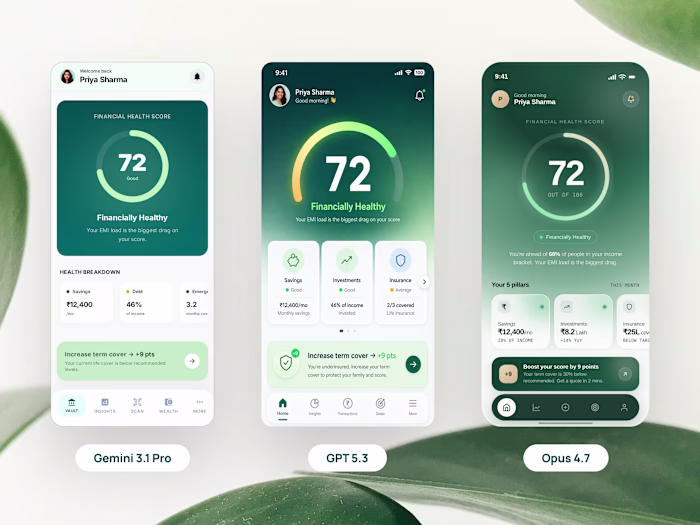
While routinely building apps for agents and customers in the wealth and insurance space with our client WealthRight, we came across a massive, unsolved problem for CXOs at large insurance companies.
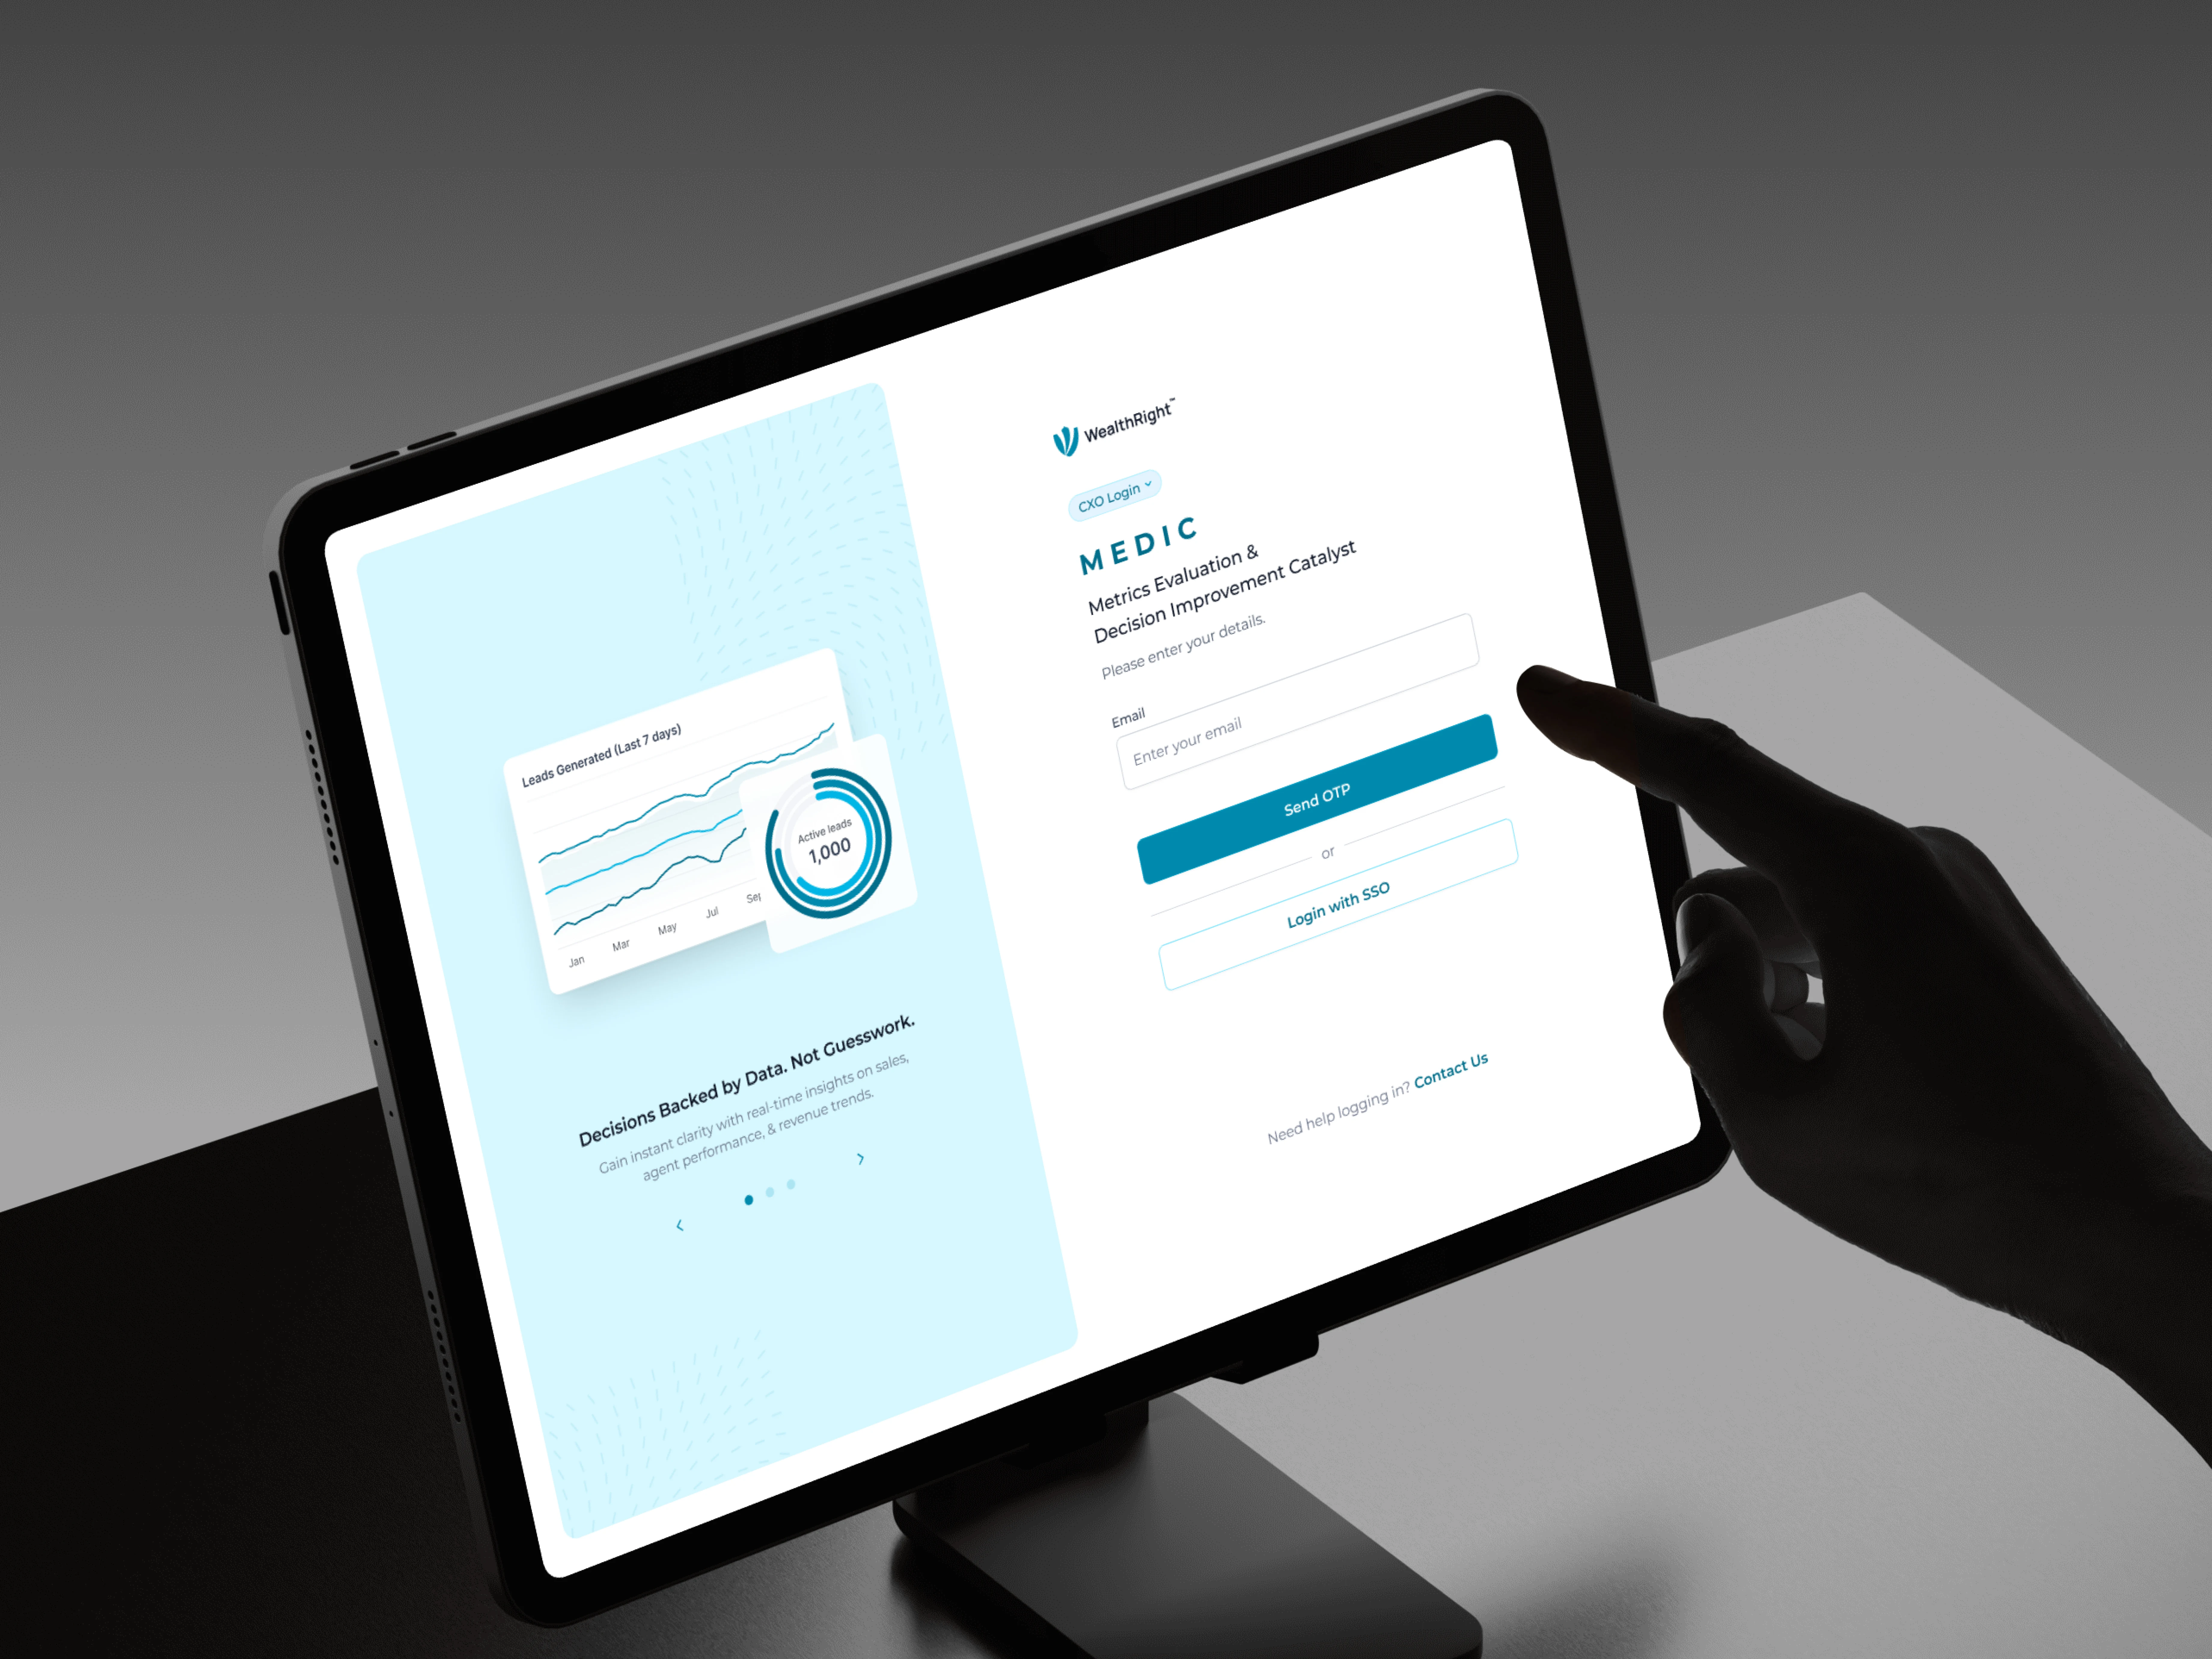
We wanted to build a product specifically to help these executives make better, faster decisions. This vision gave us the idea for MEDIC short for Metrics Evaluation & Decision Improvement Catalyst.
It was envisioned as a powerful, white-label enterprise dashboard specifically designed to be sold to insurance providers.
The executive blindspot
The insurtech space suffers from a universal blind spot: top-level management simply cannot make sense of what is happening across their massive organizations.
Vital company data like sales numbers, active agent ratios, and hiring metrics was scattered across endless spreadsheets and disconnected tables.
CXOs lacked a unified platform to view their data collectively, meaning too many critical business moves were based on guesswork rather than clear, real-time insights.
How we tackled it
We kicked things off in Q3 of 2025 by sitting down with WealthRight's leadership and their partners for intensive brainstorming. We needed to figure out how to take this tangled web of data and present it in a way that actually drove decisions.
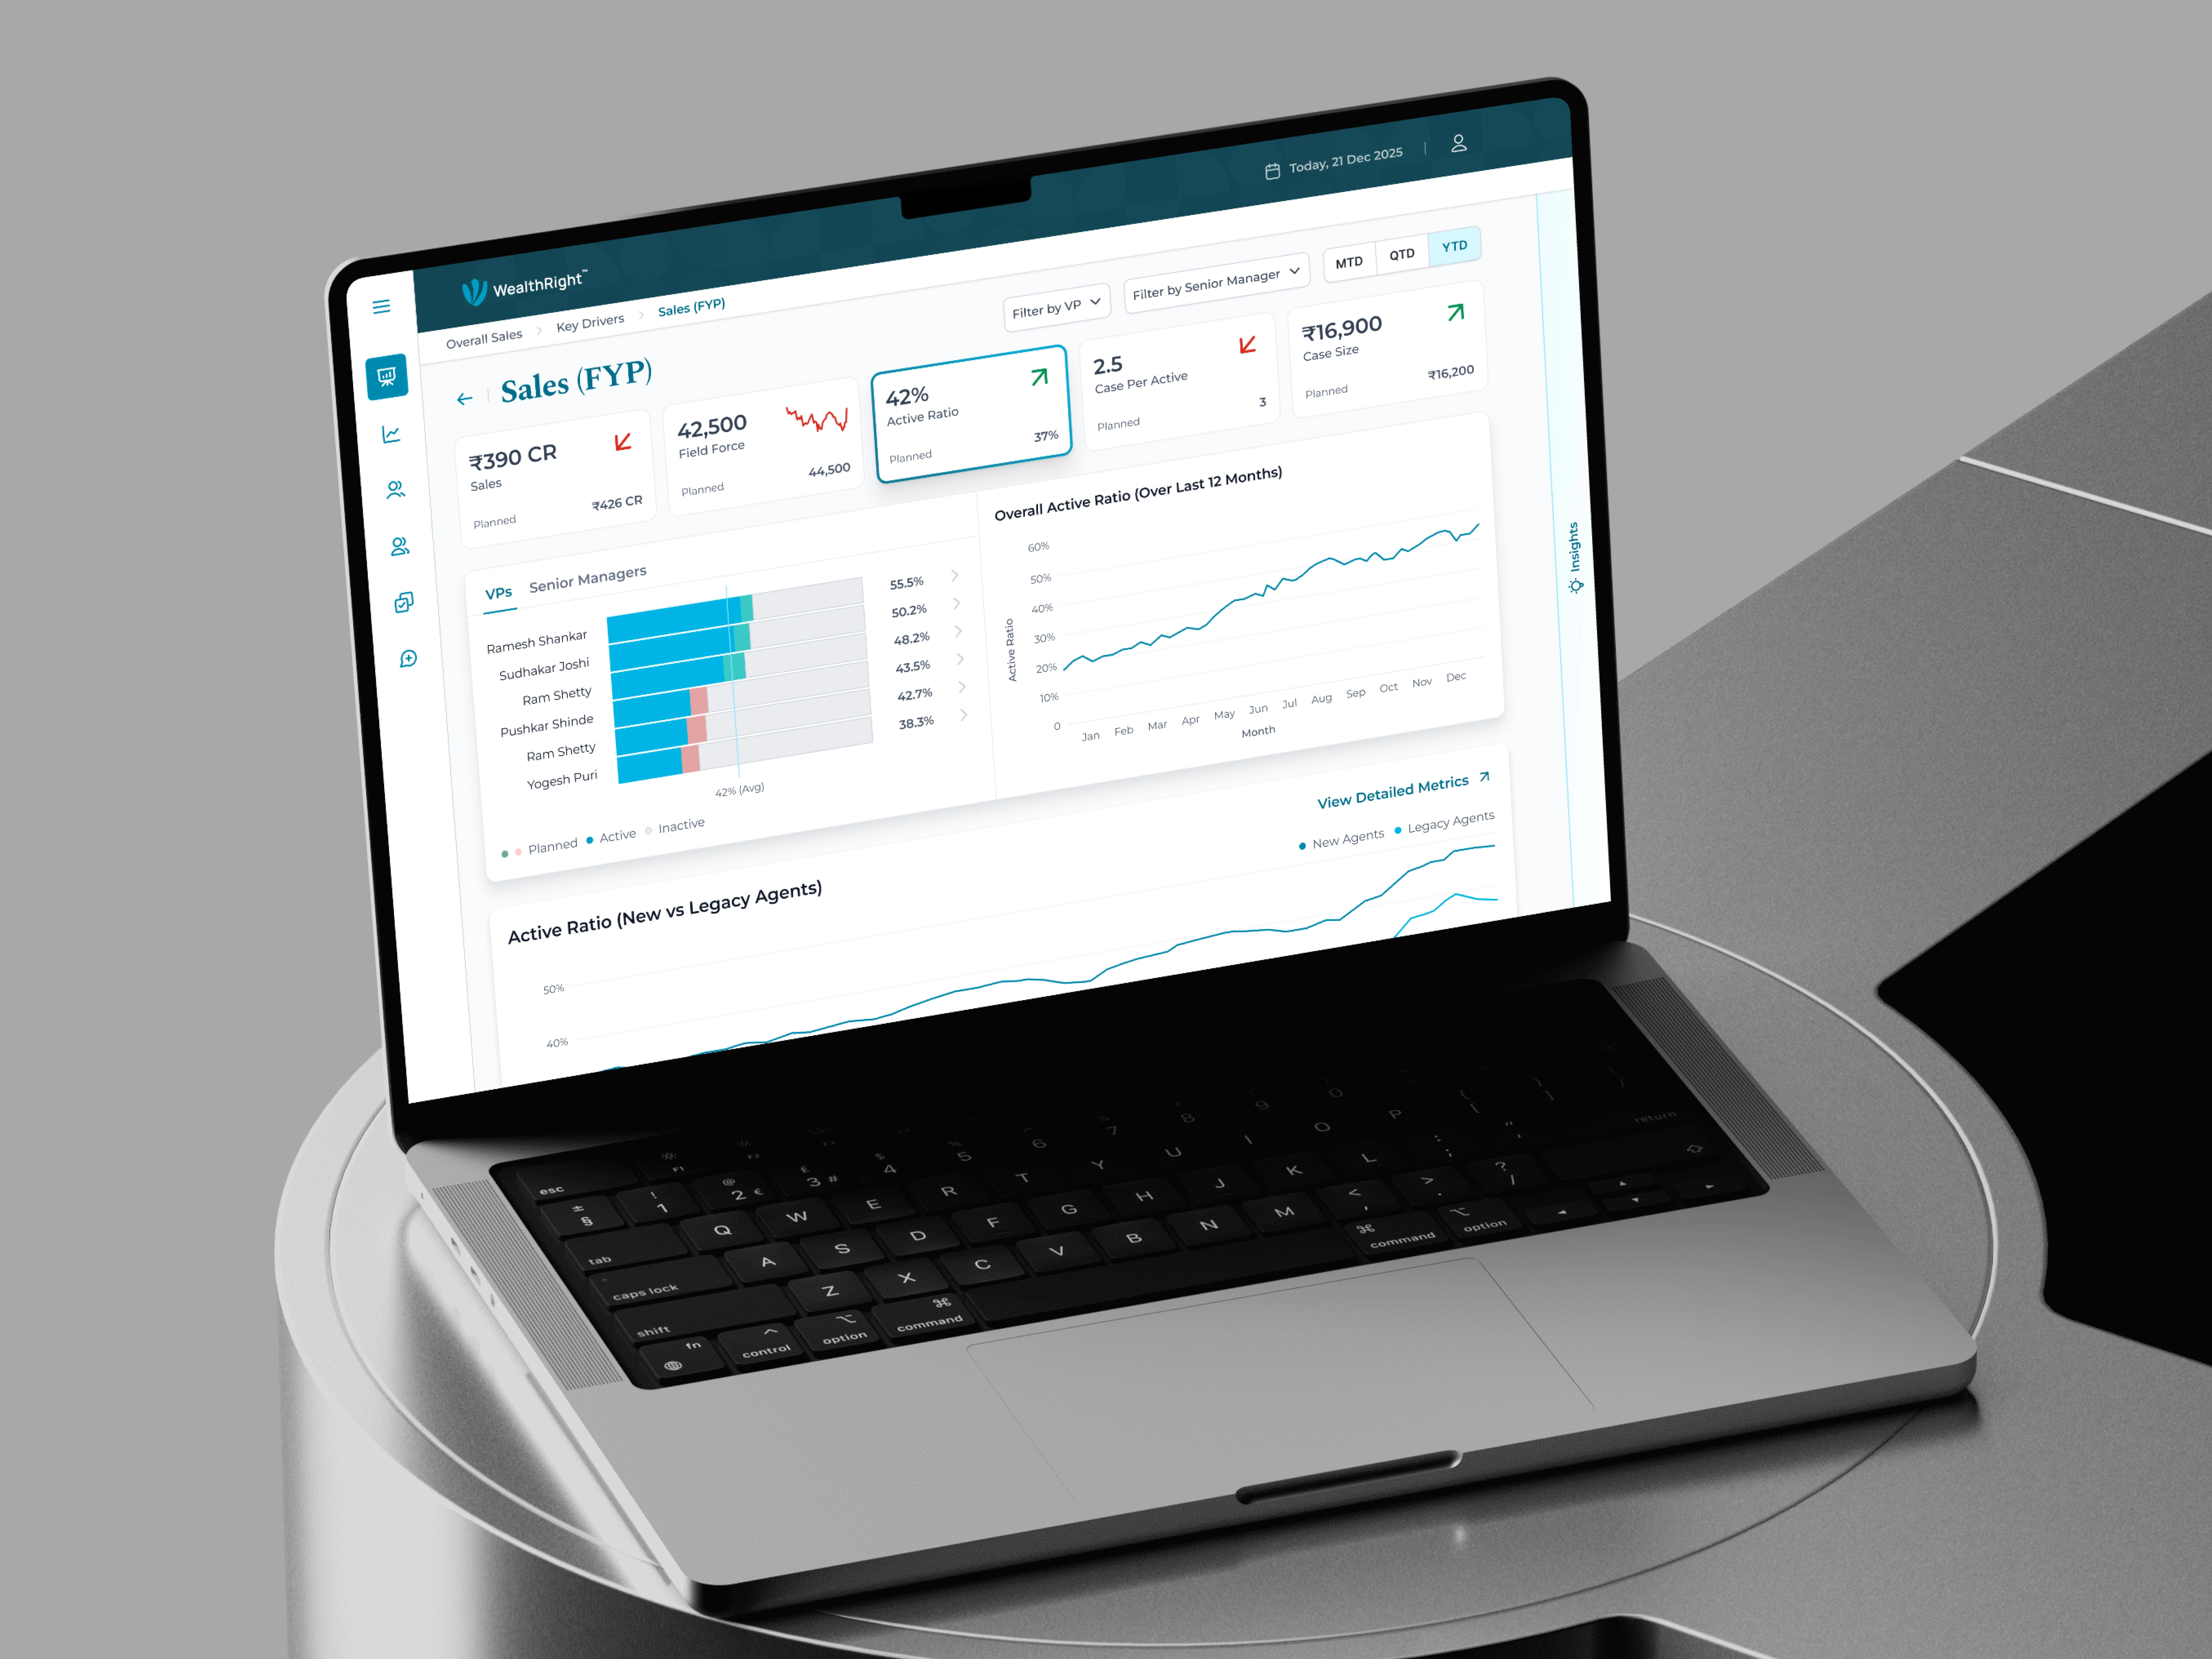
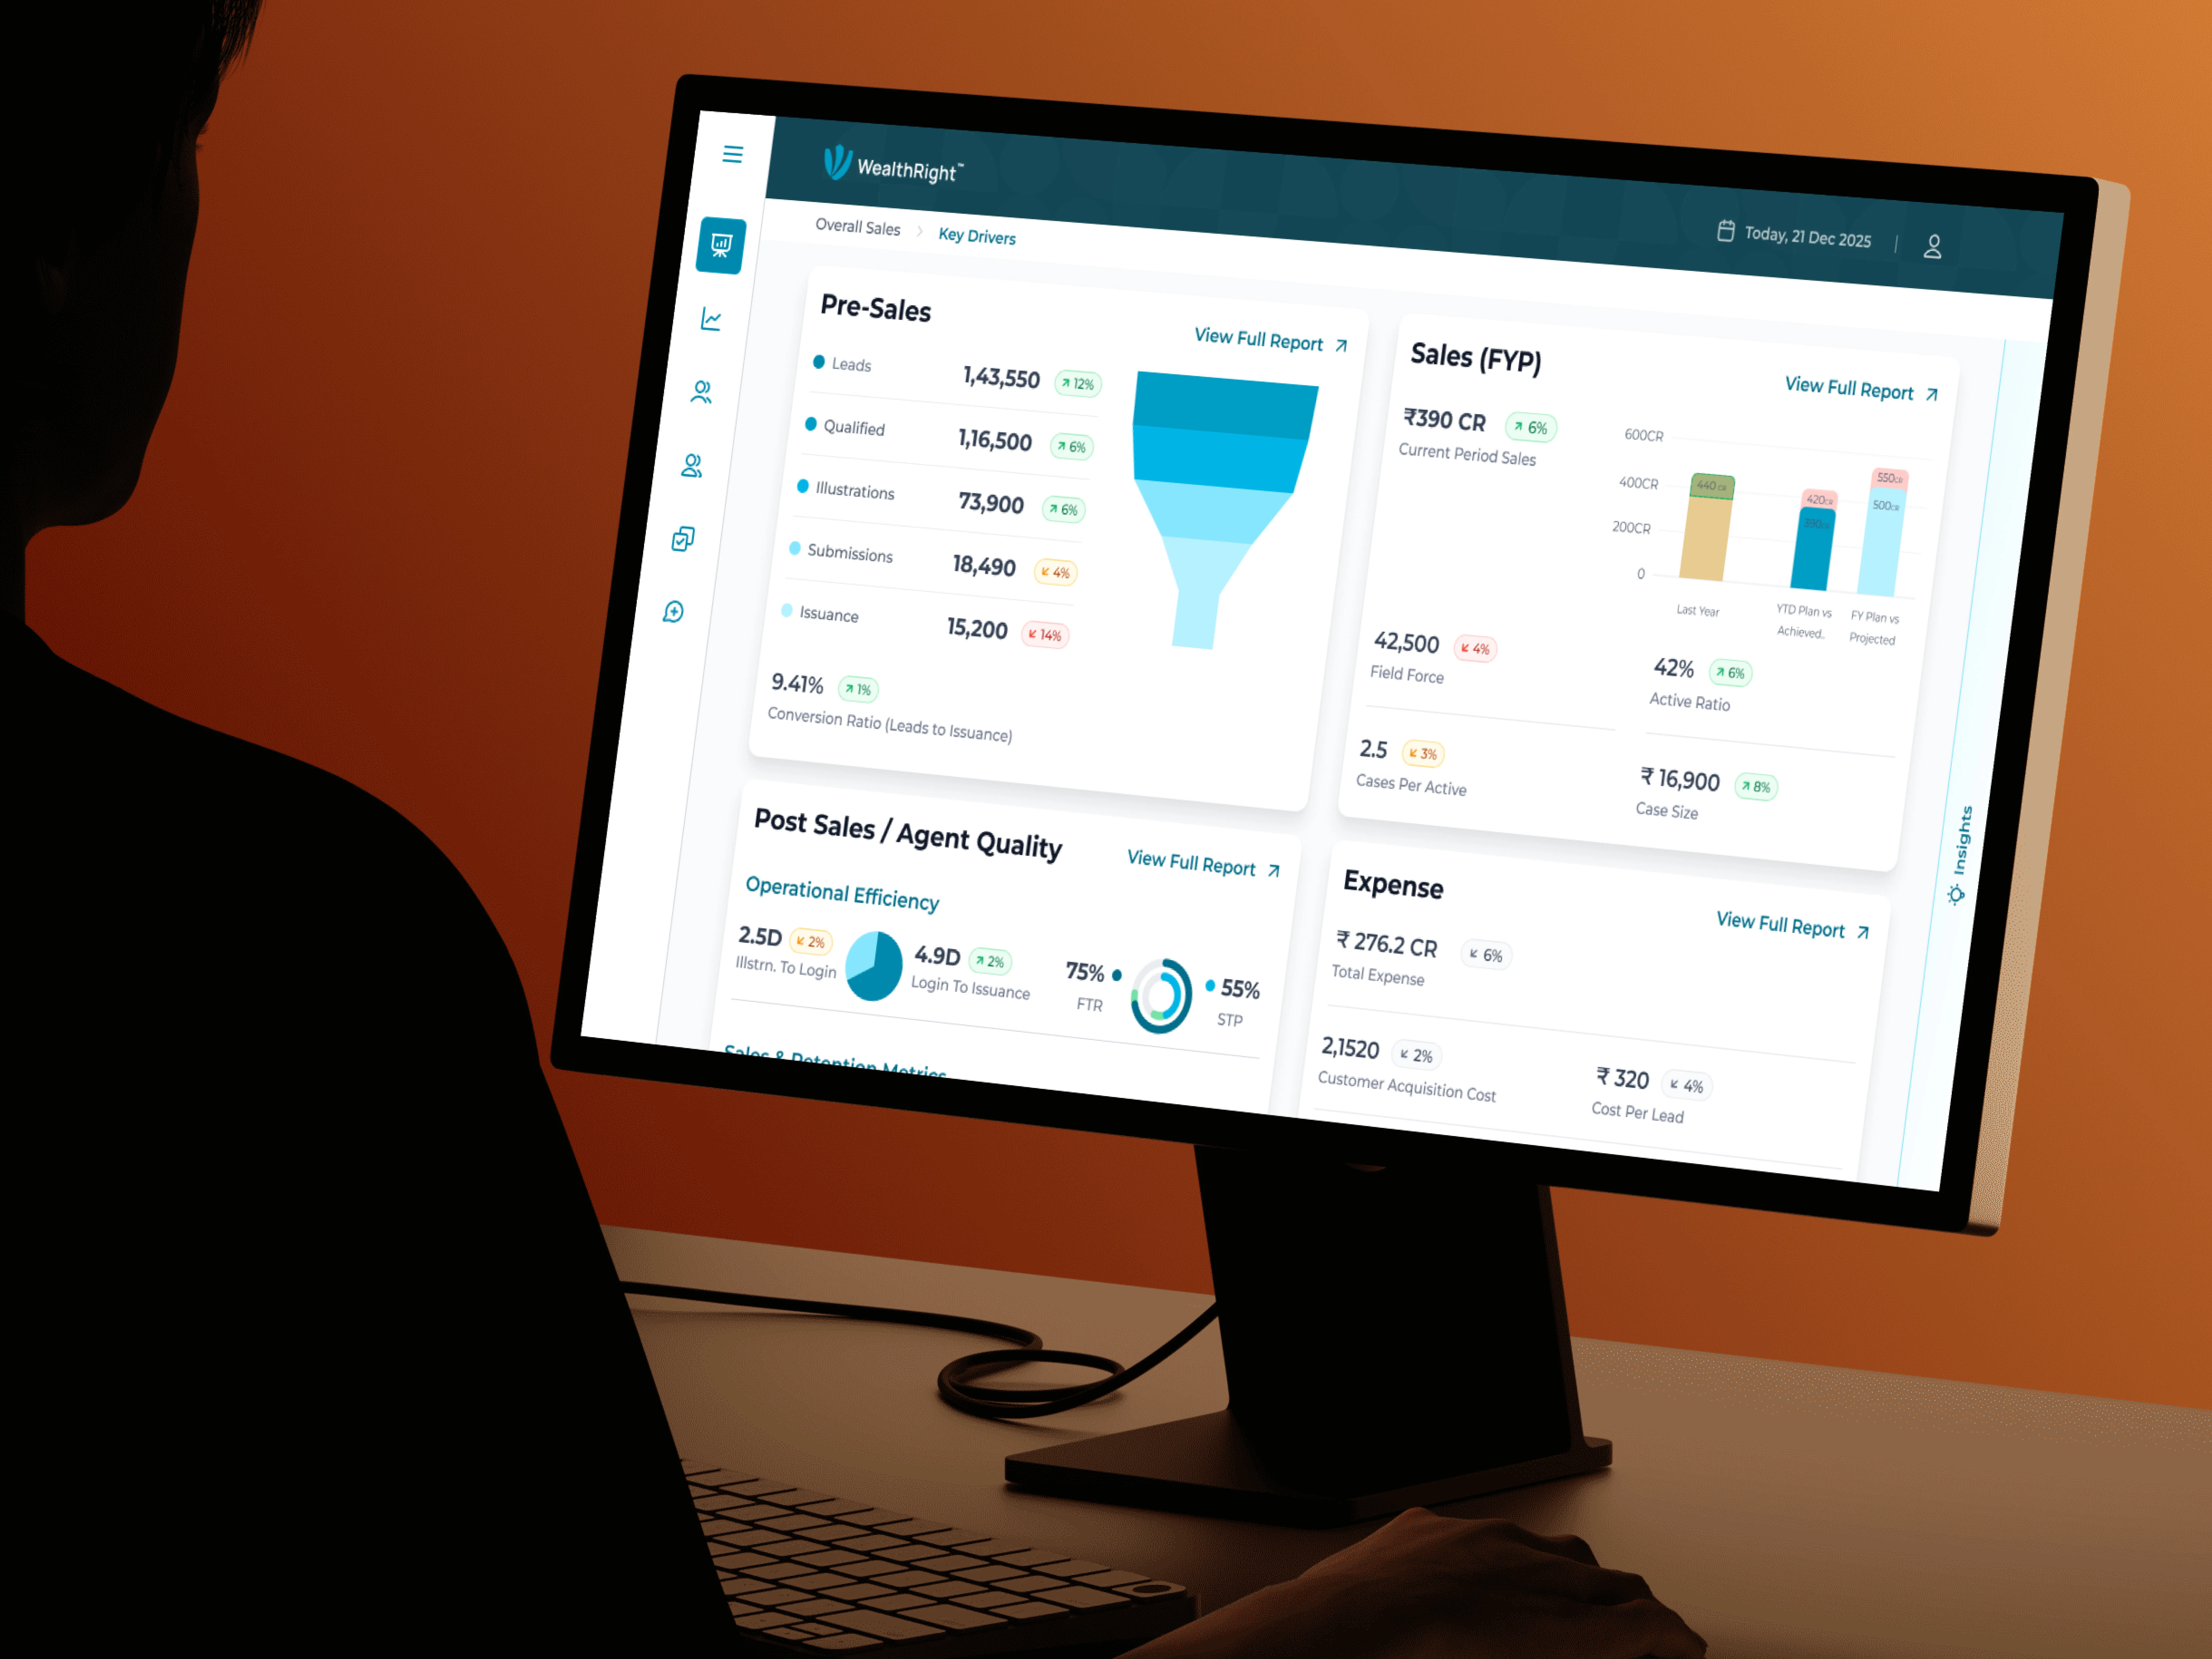
That is when we mapped out the 'Sales & Key Drivers - Pre Sales, Post Sales, Agent Quality & Expenses' methodology, which became the foundational architecture for the entire product.
Design process
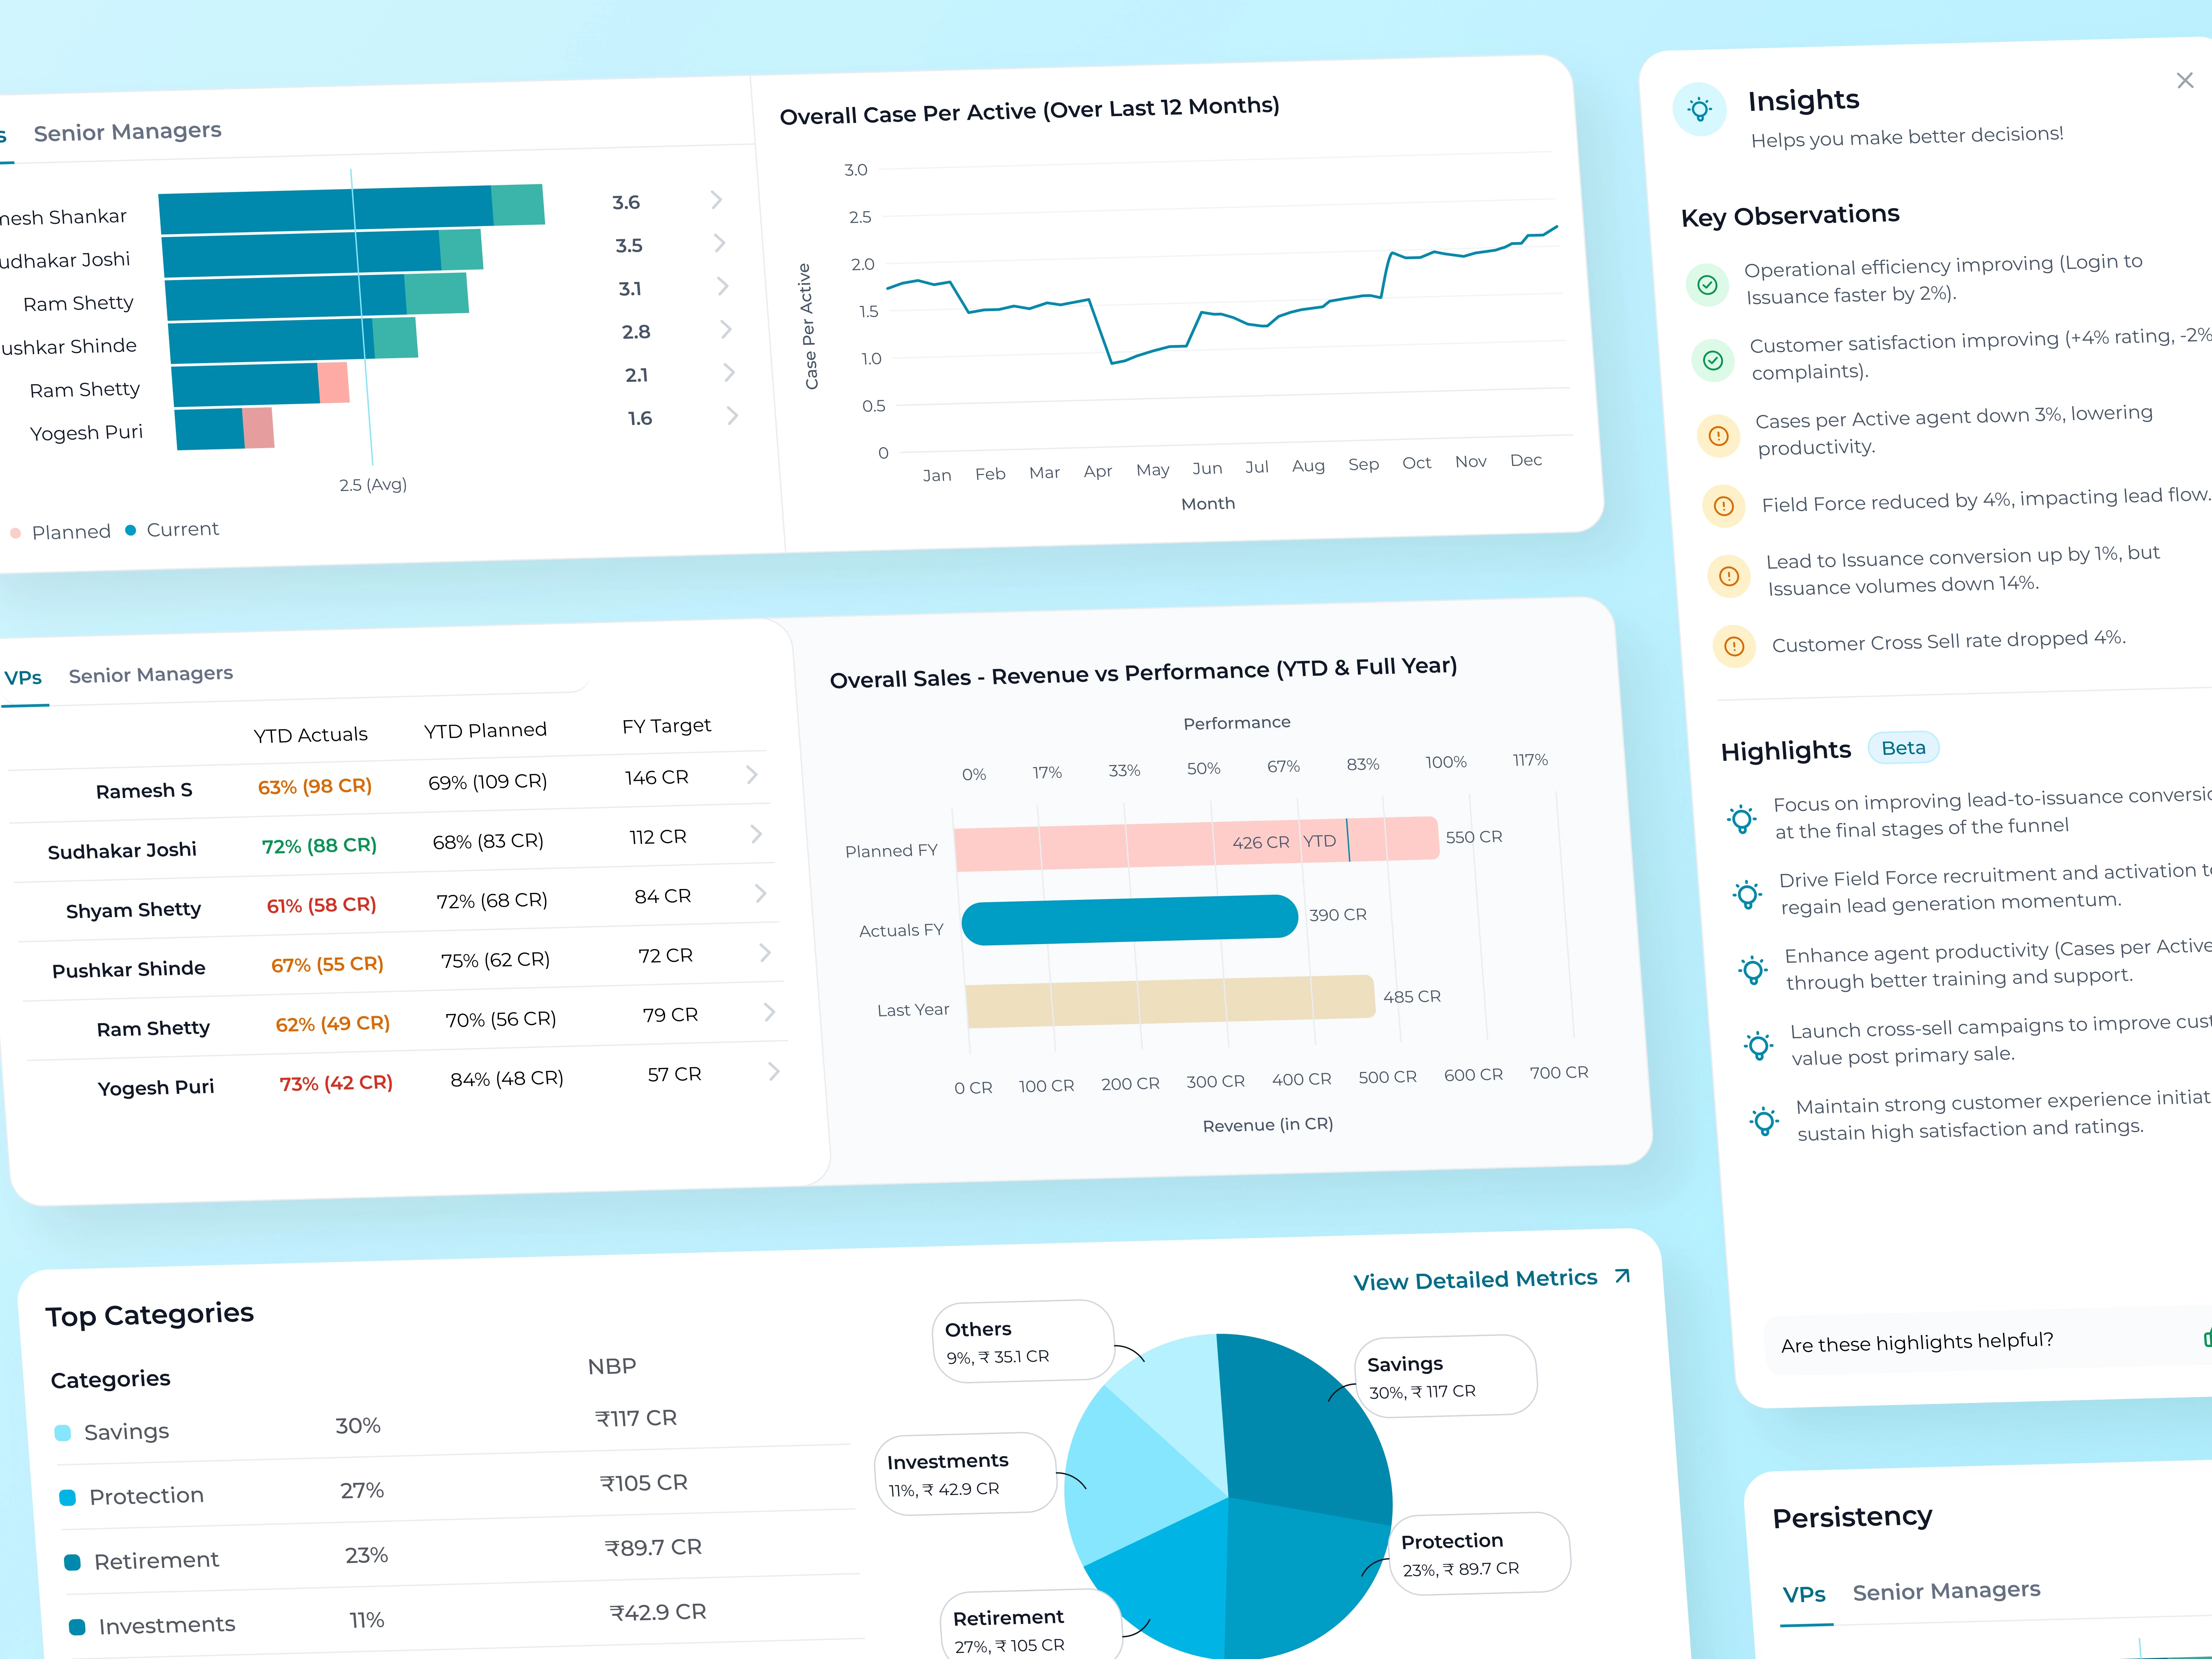
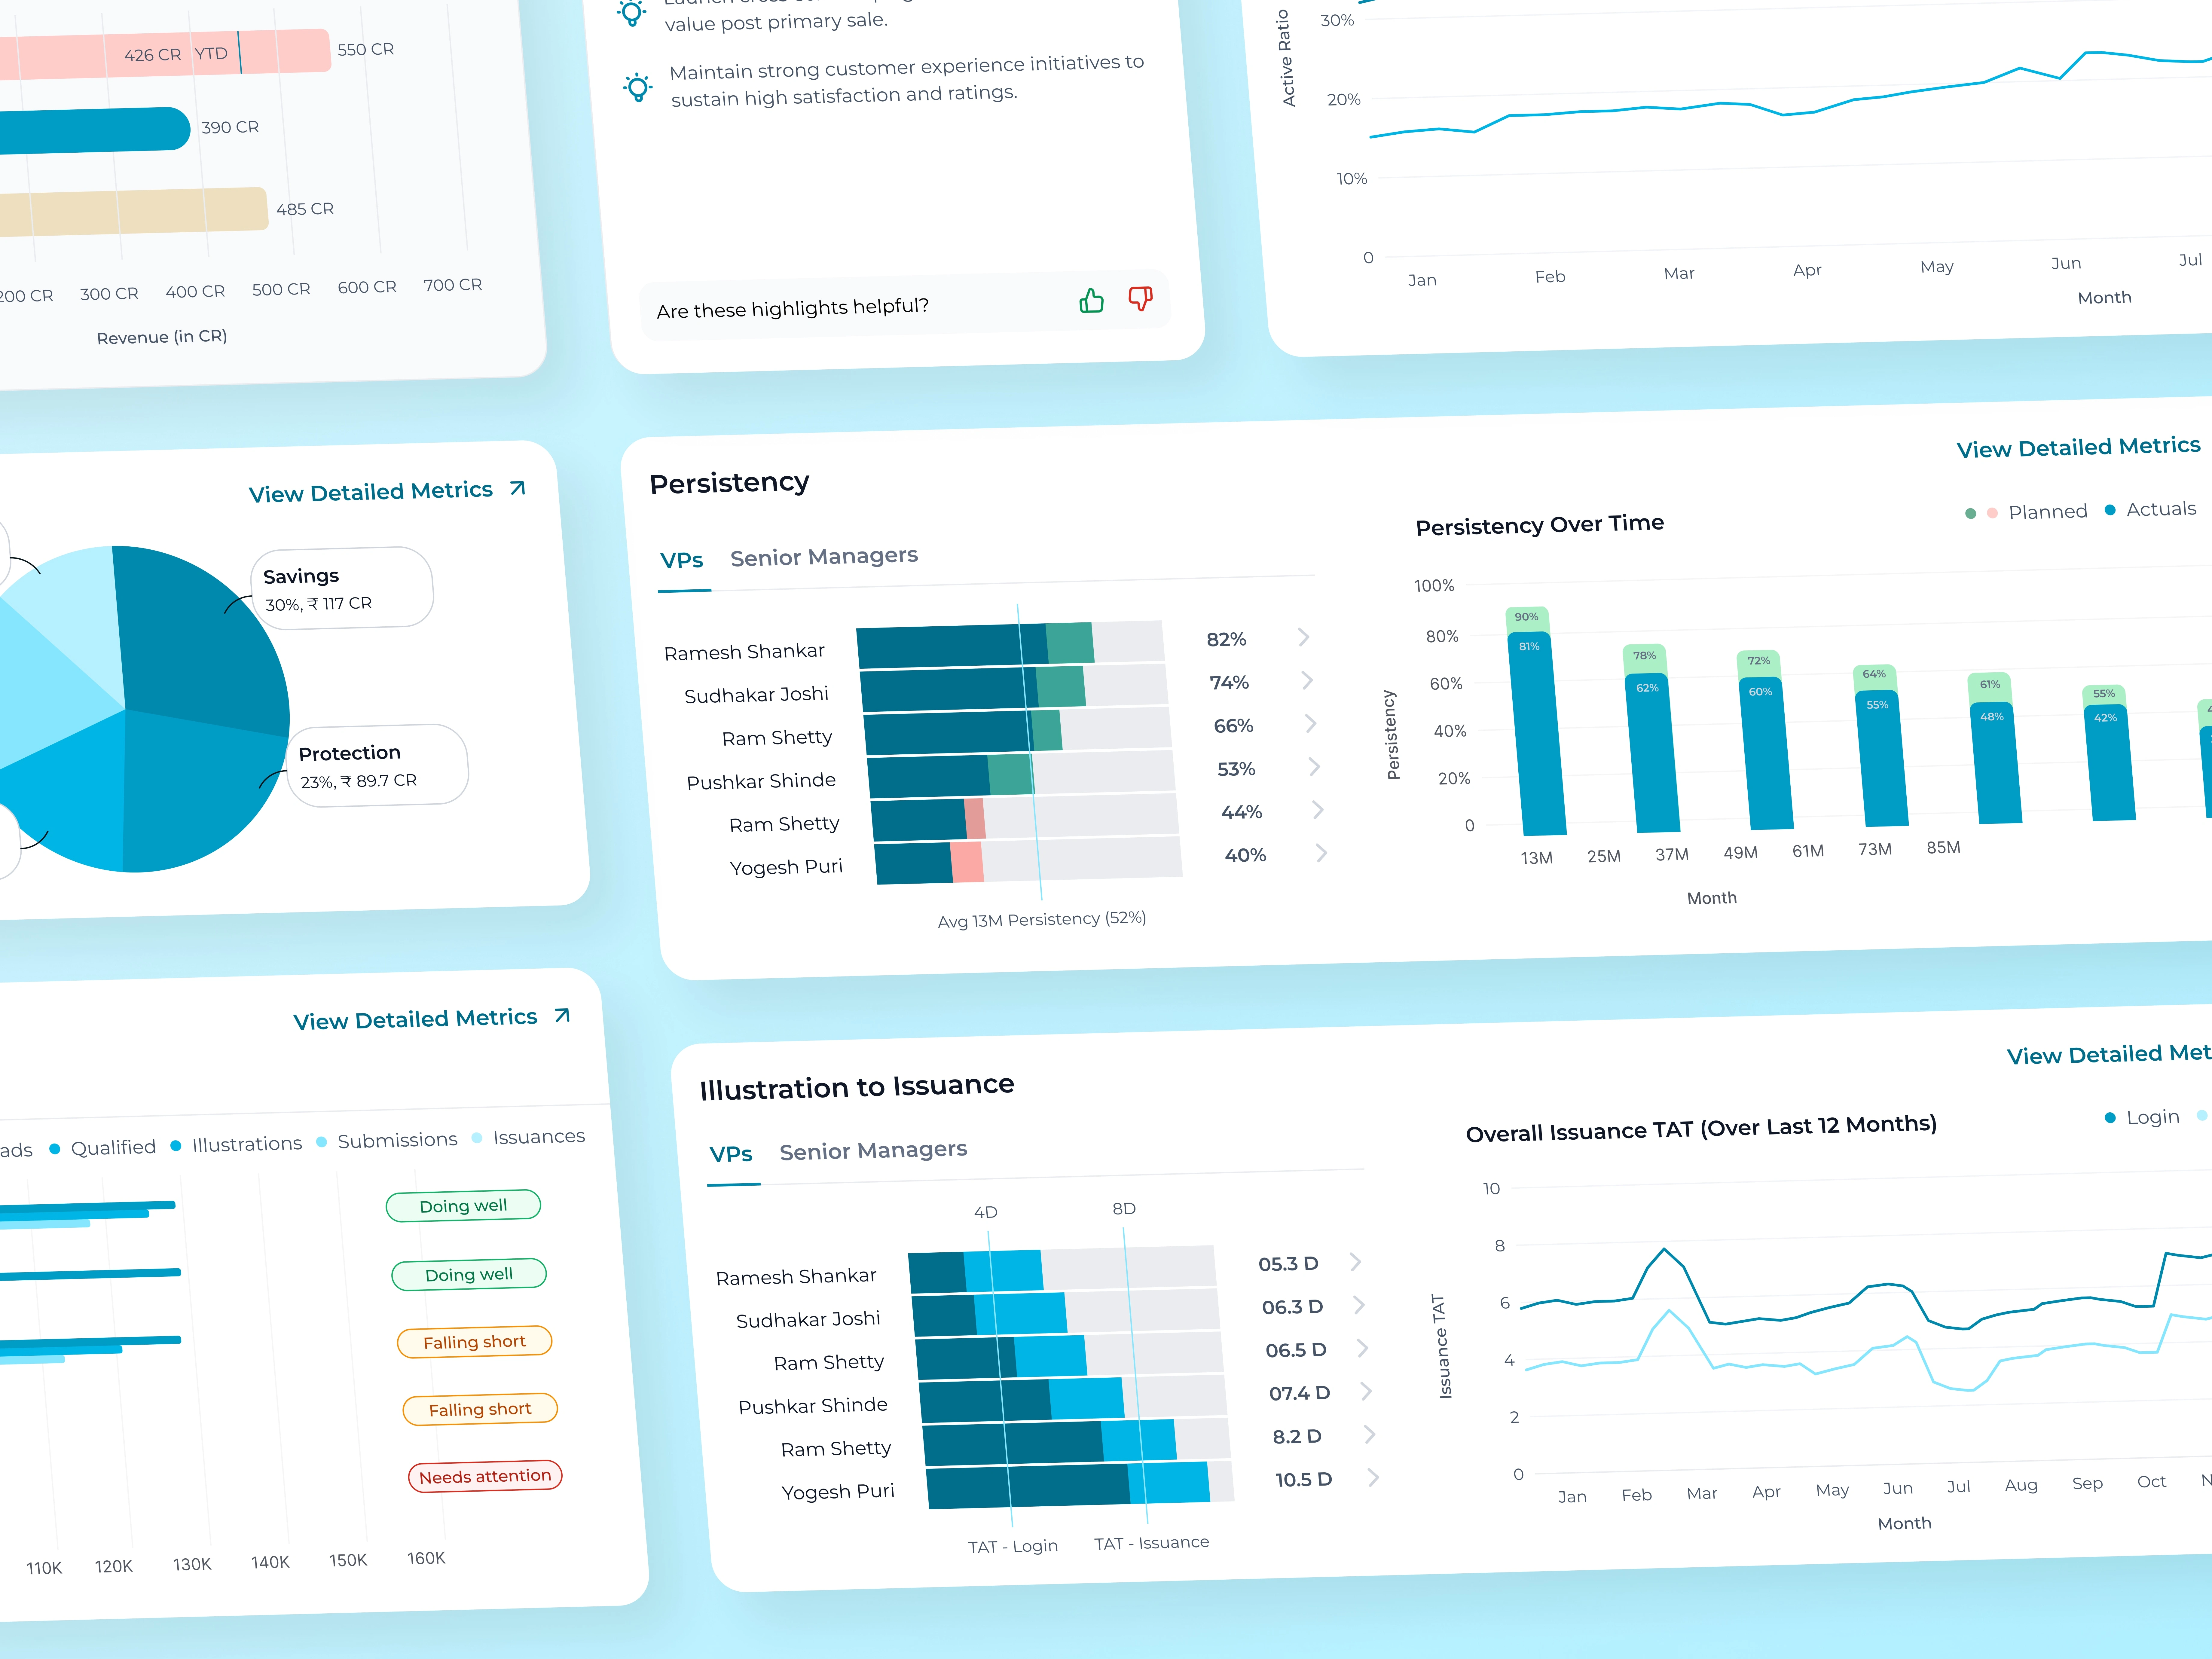
Designing for enterprise means designing for hierarchy, security, and absolute clarity. To get the visuals exactly right, we went deep into the grammar of graphs to understand precisely which data to represent in what way, ensuring cognitive ease for the user.
We also built robust access controls so the modules and data a user sees dynamically adapt based on their specific login role and designation. We structured the UI to flow logically from a bird's-eye view down to the microscopic details.
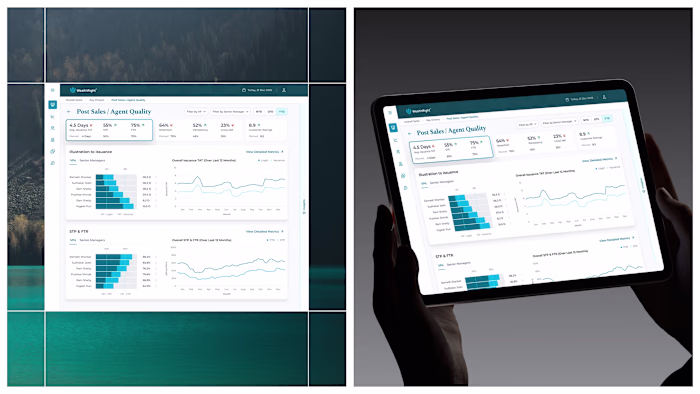
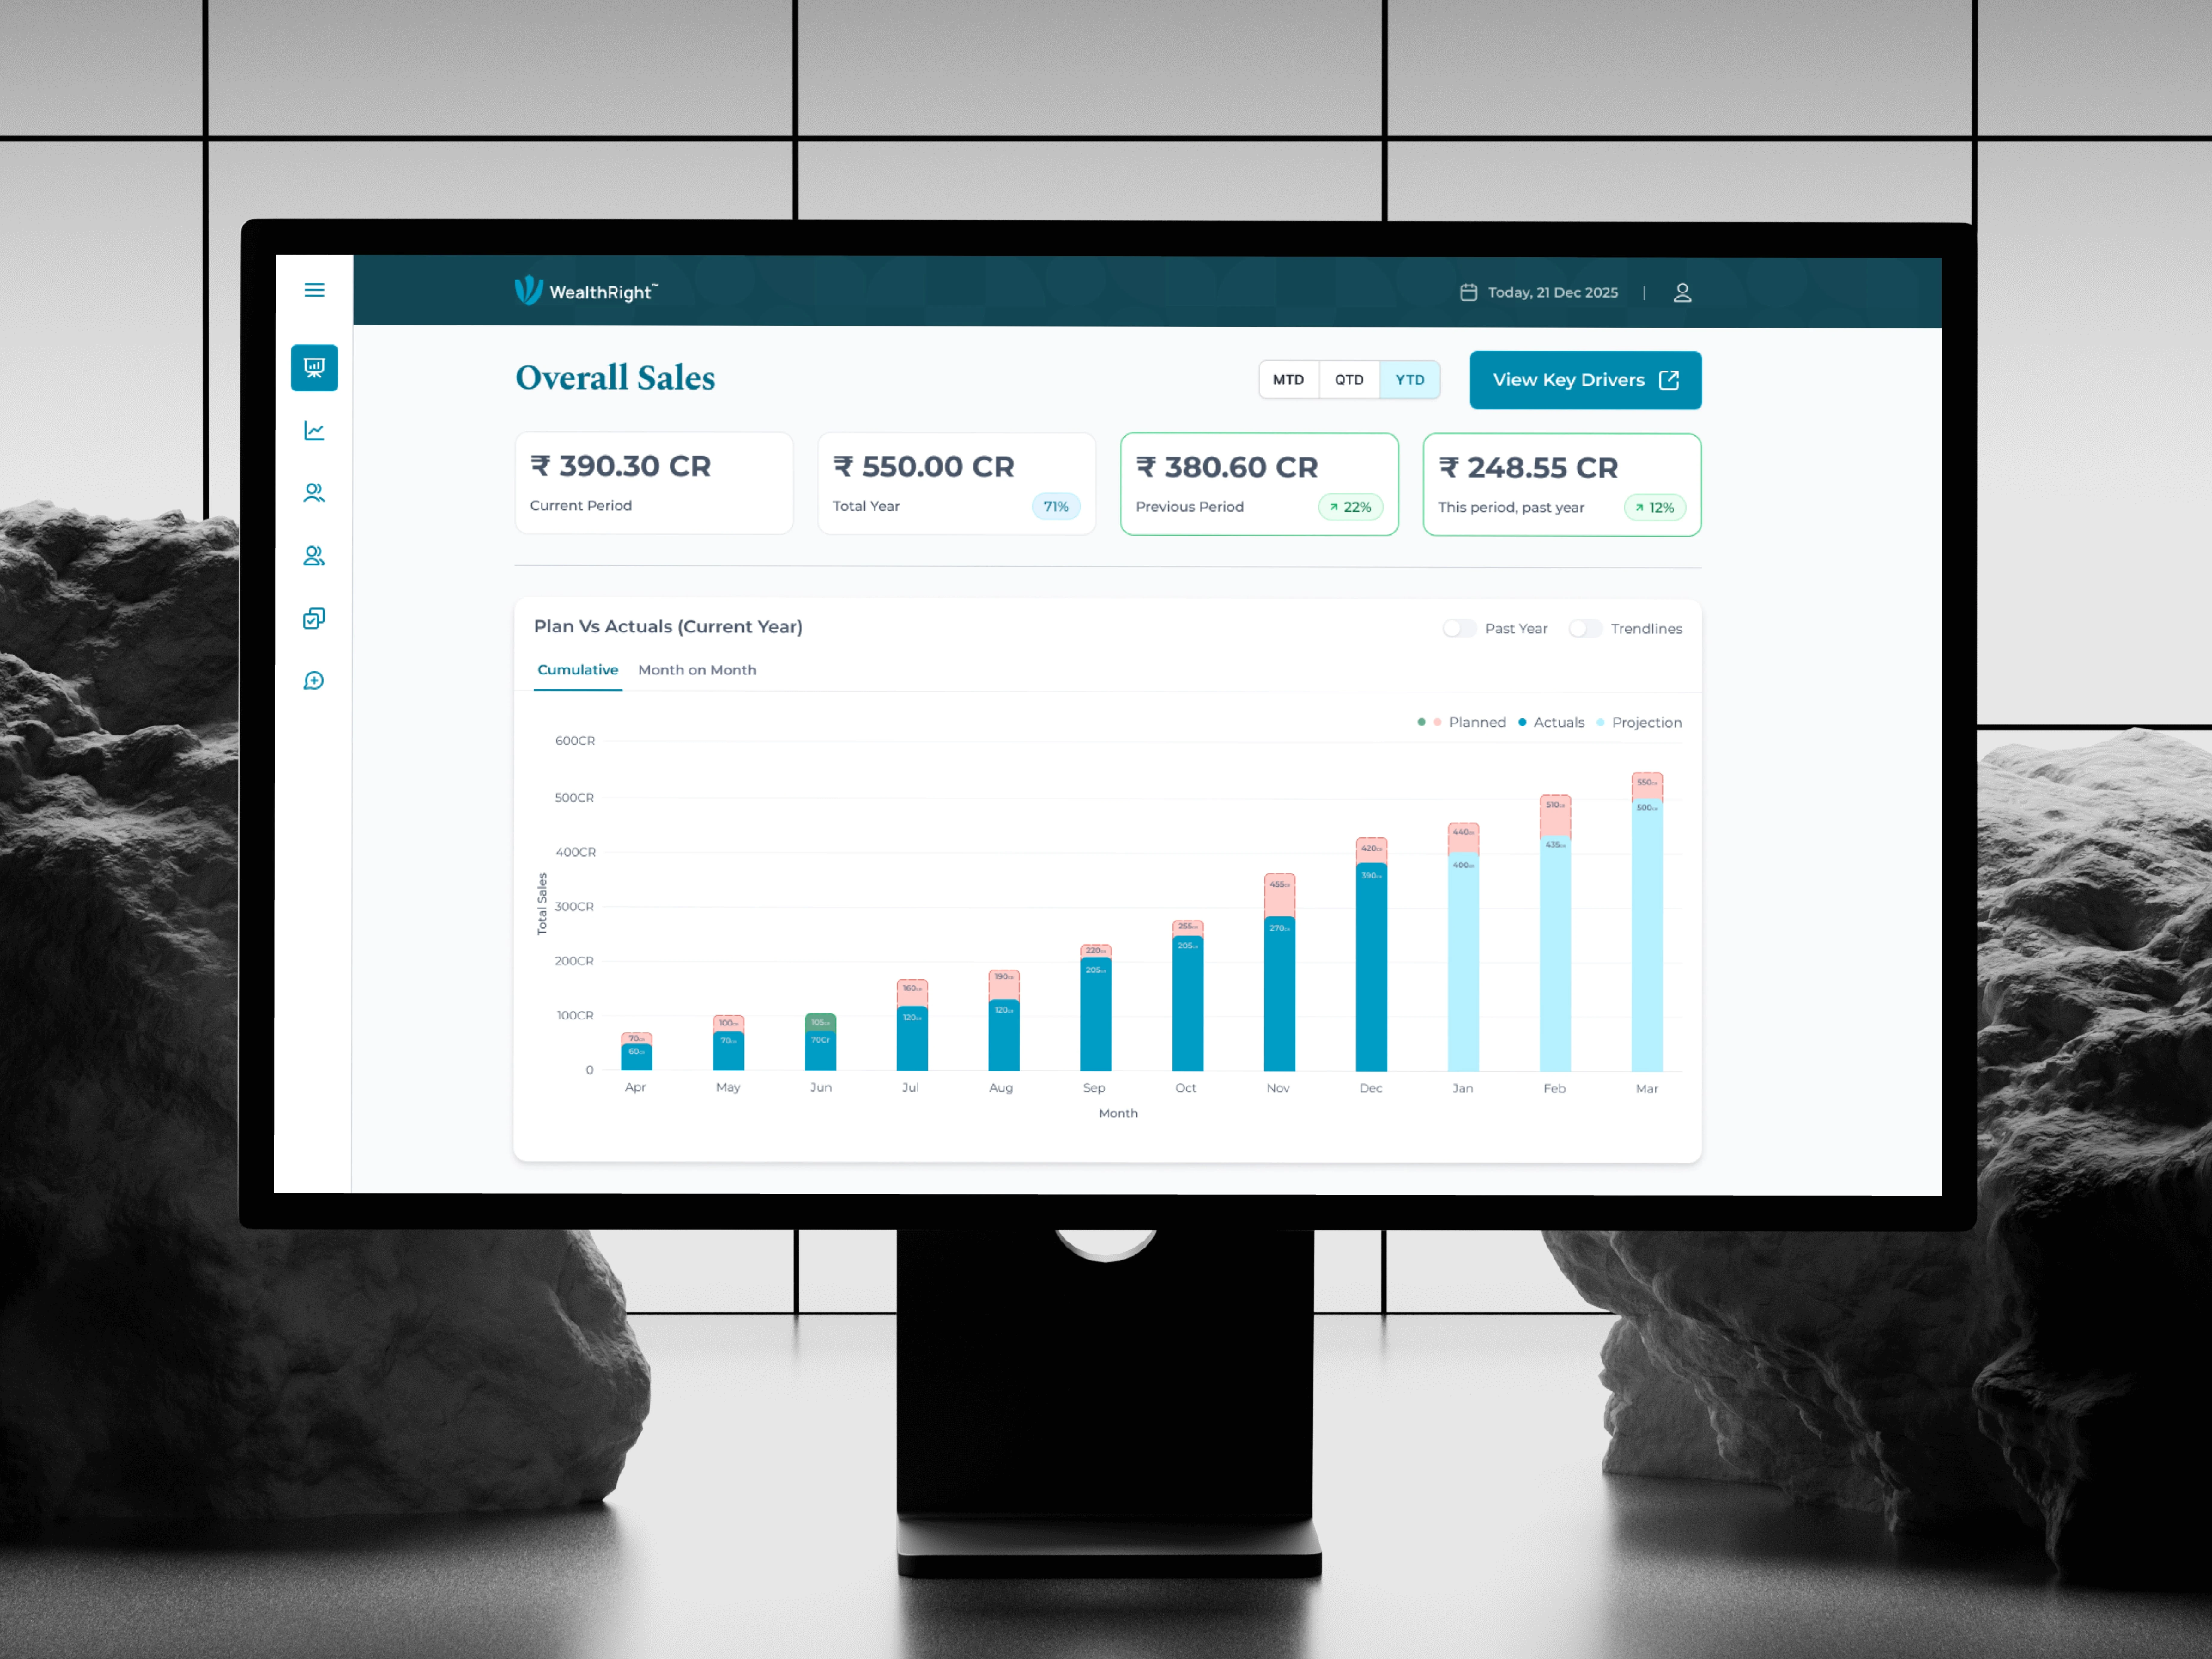
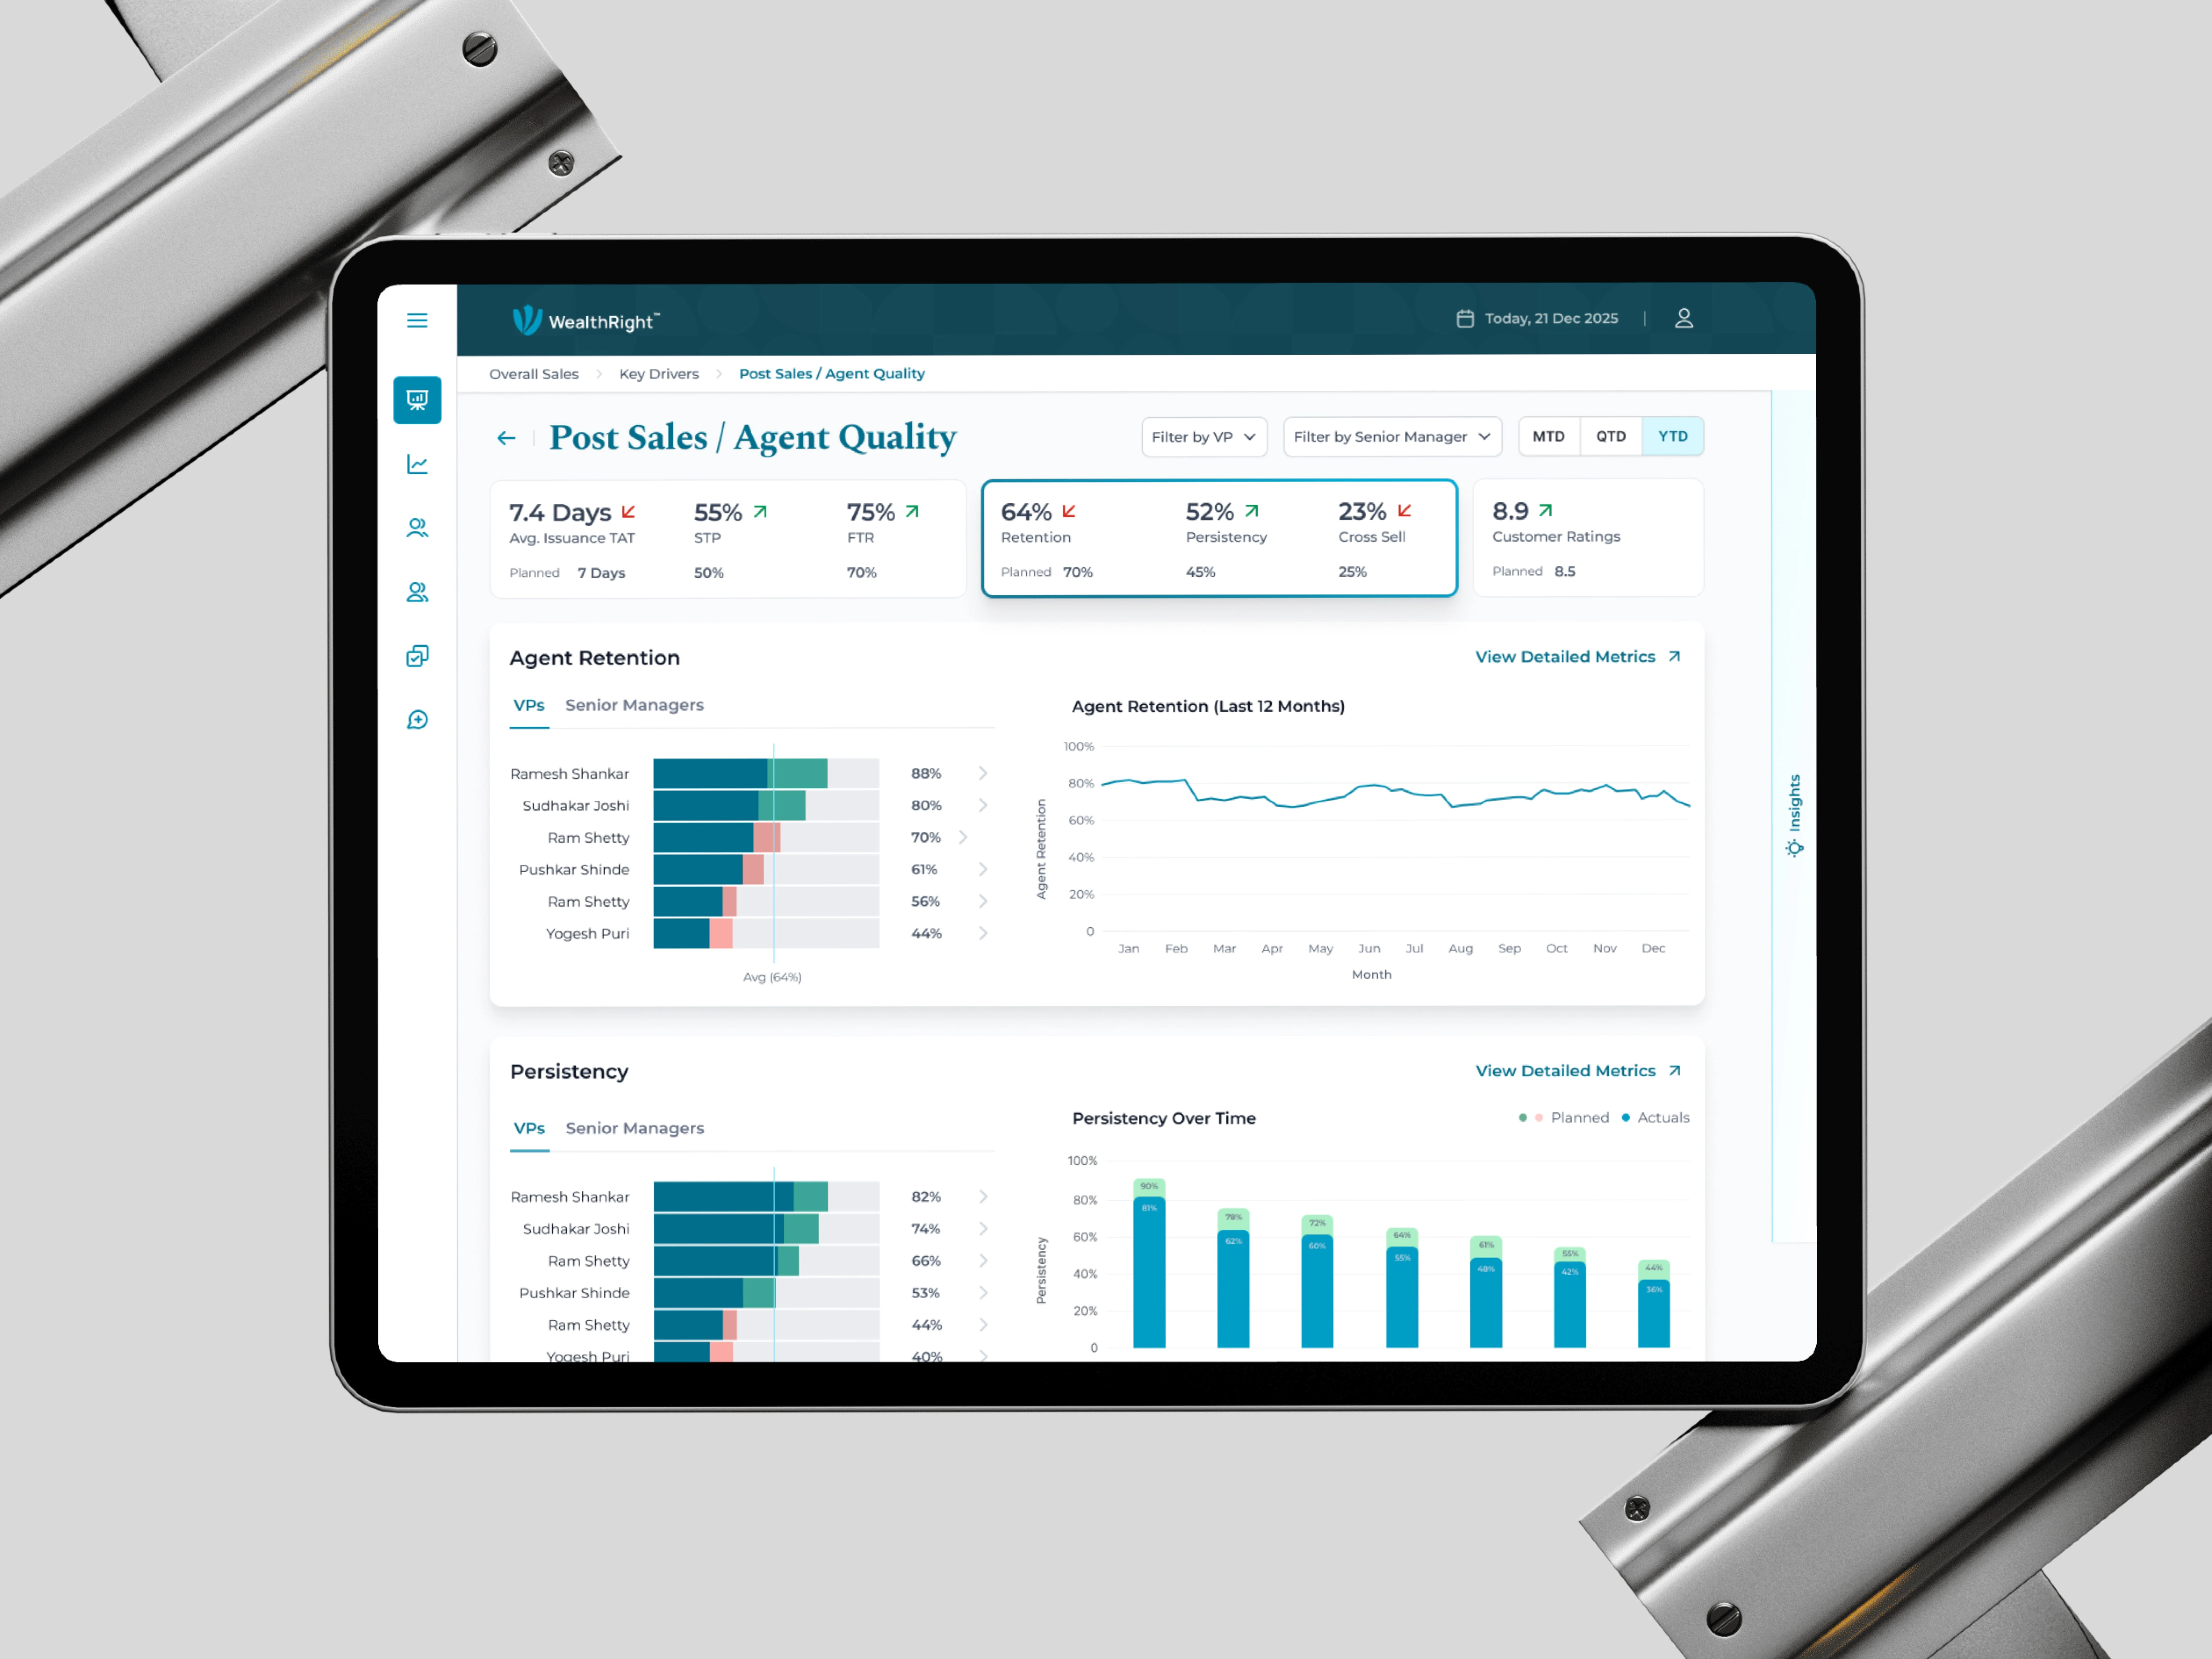
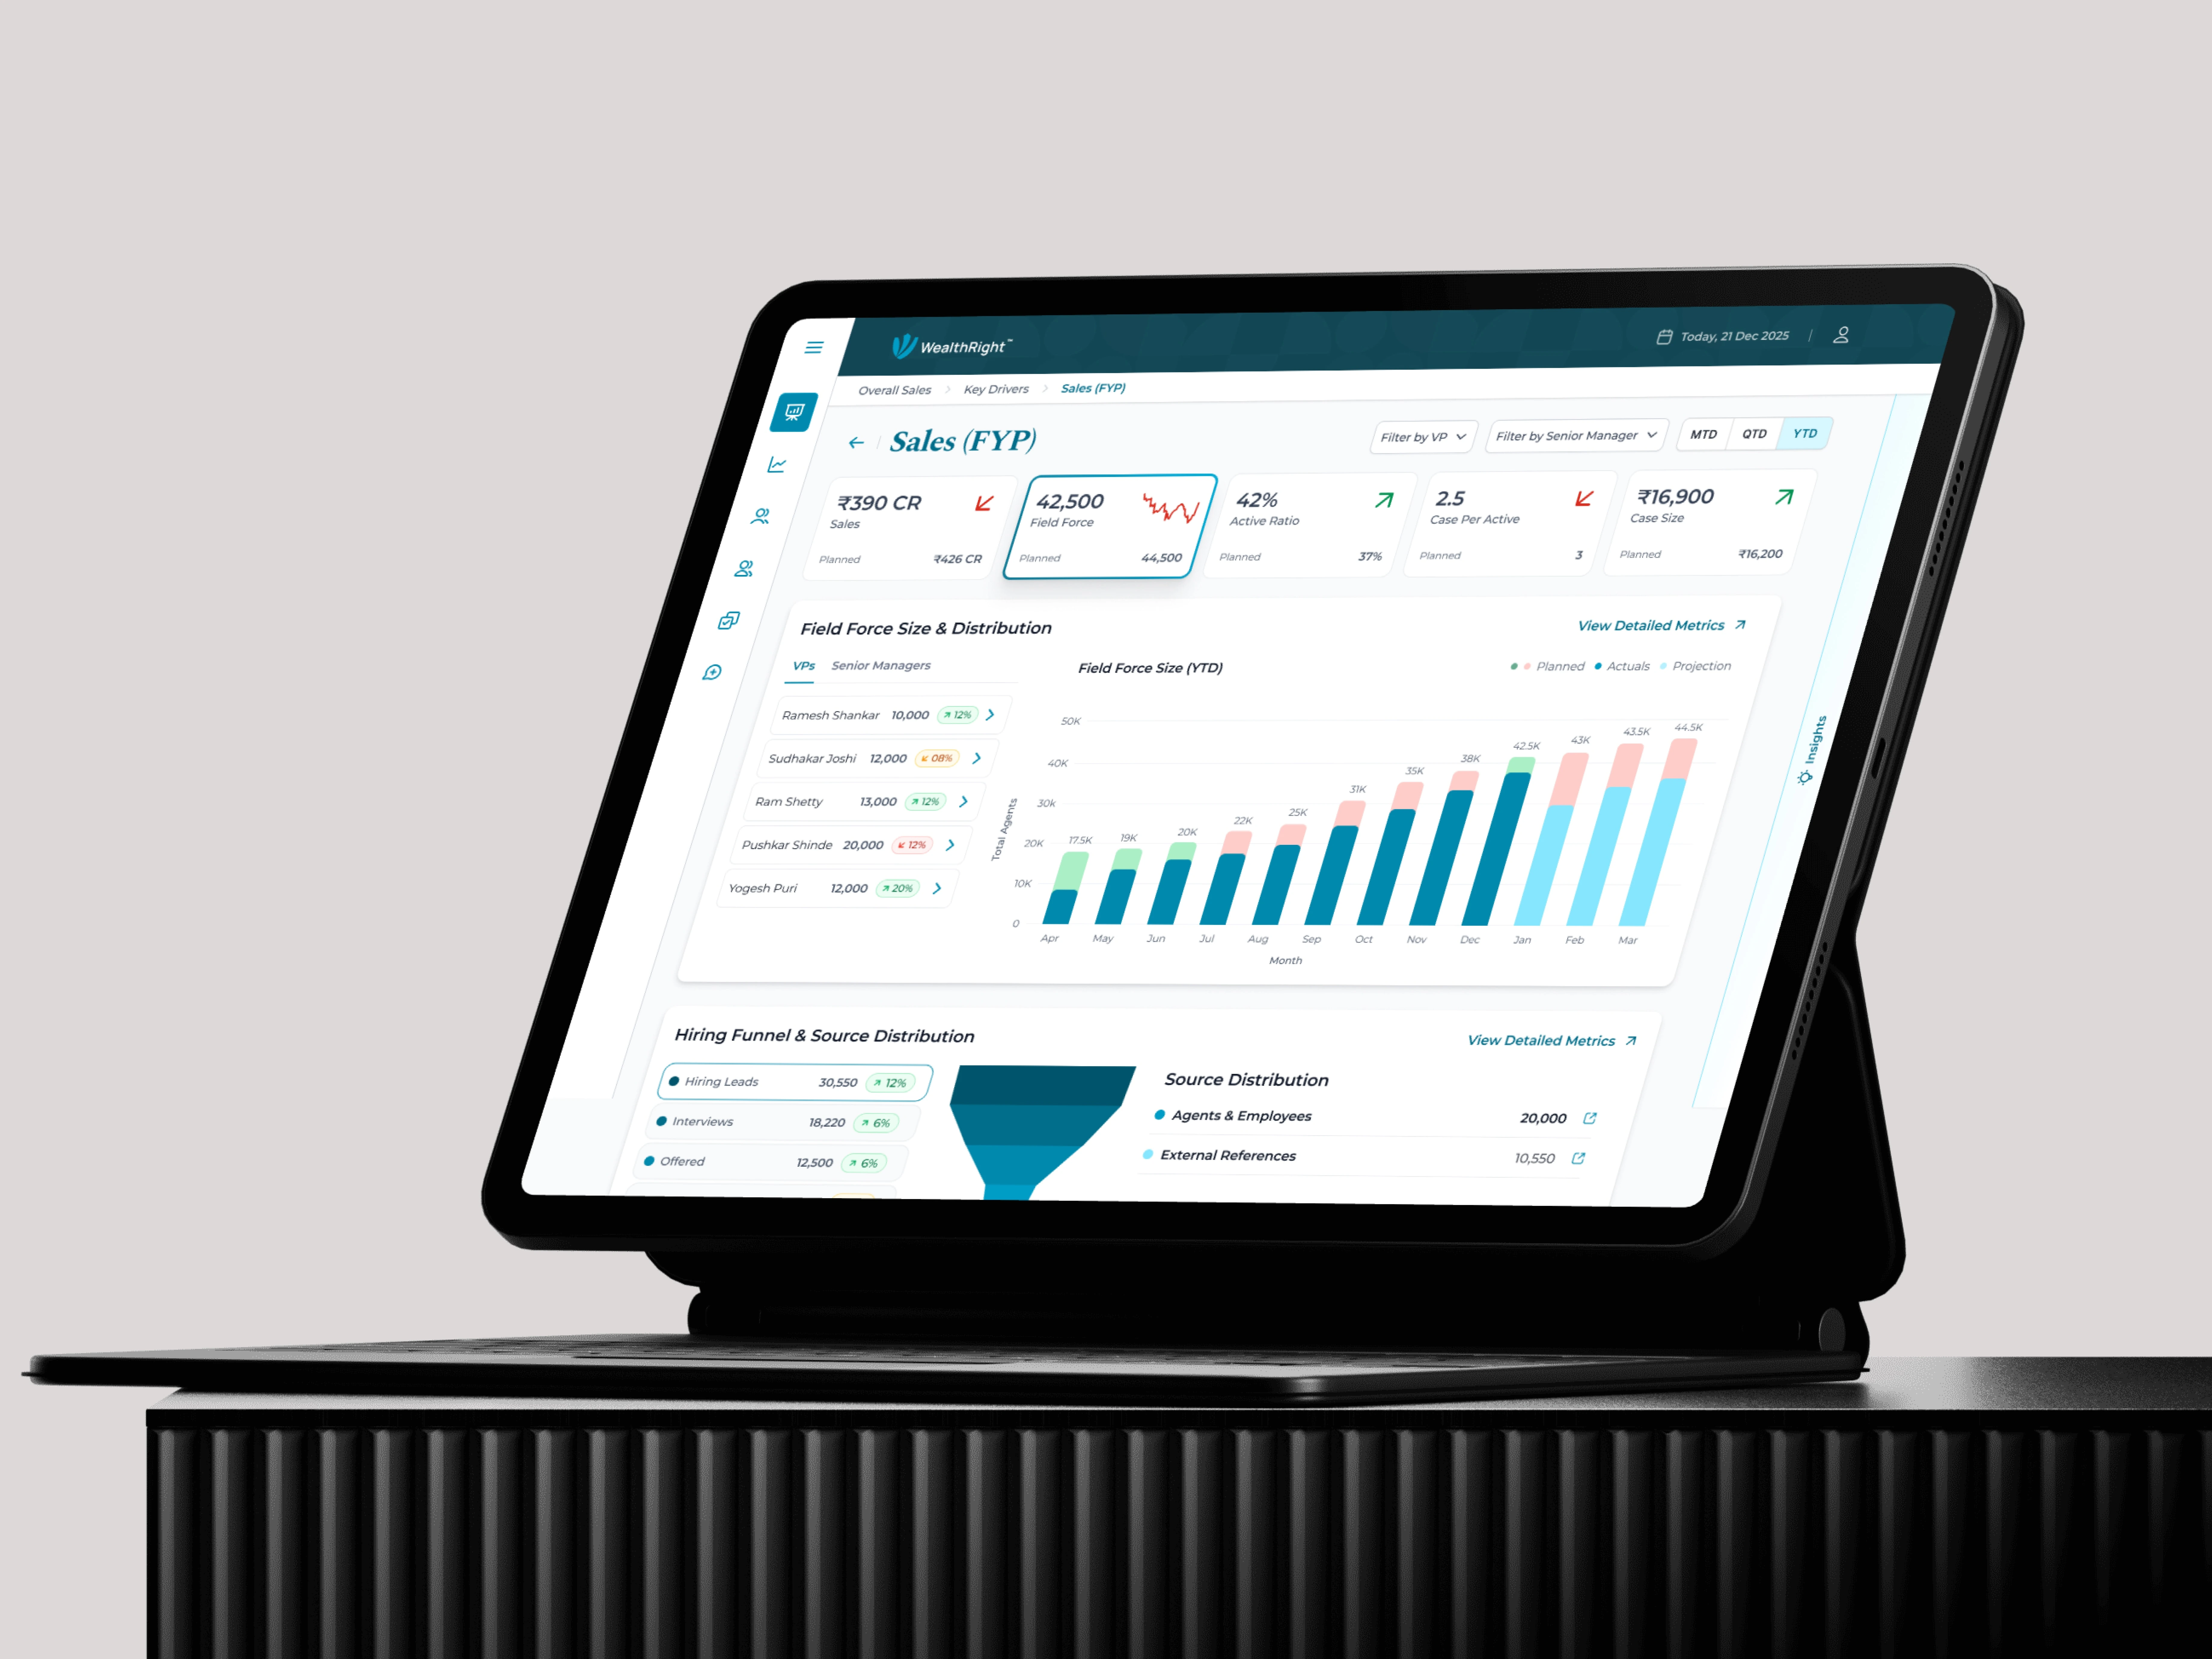
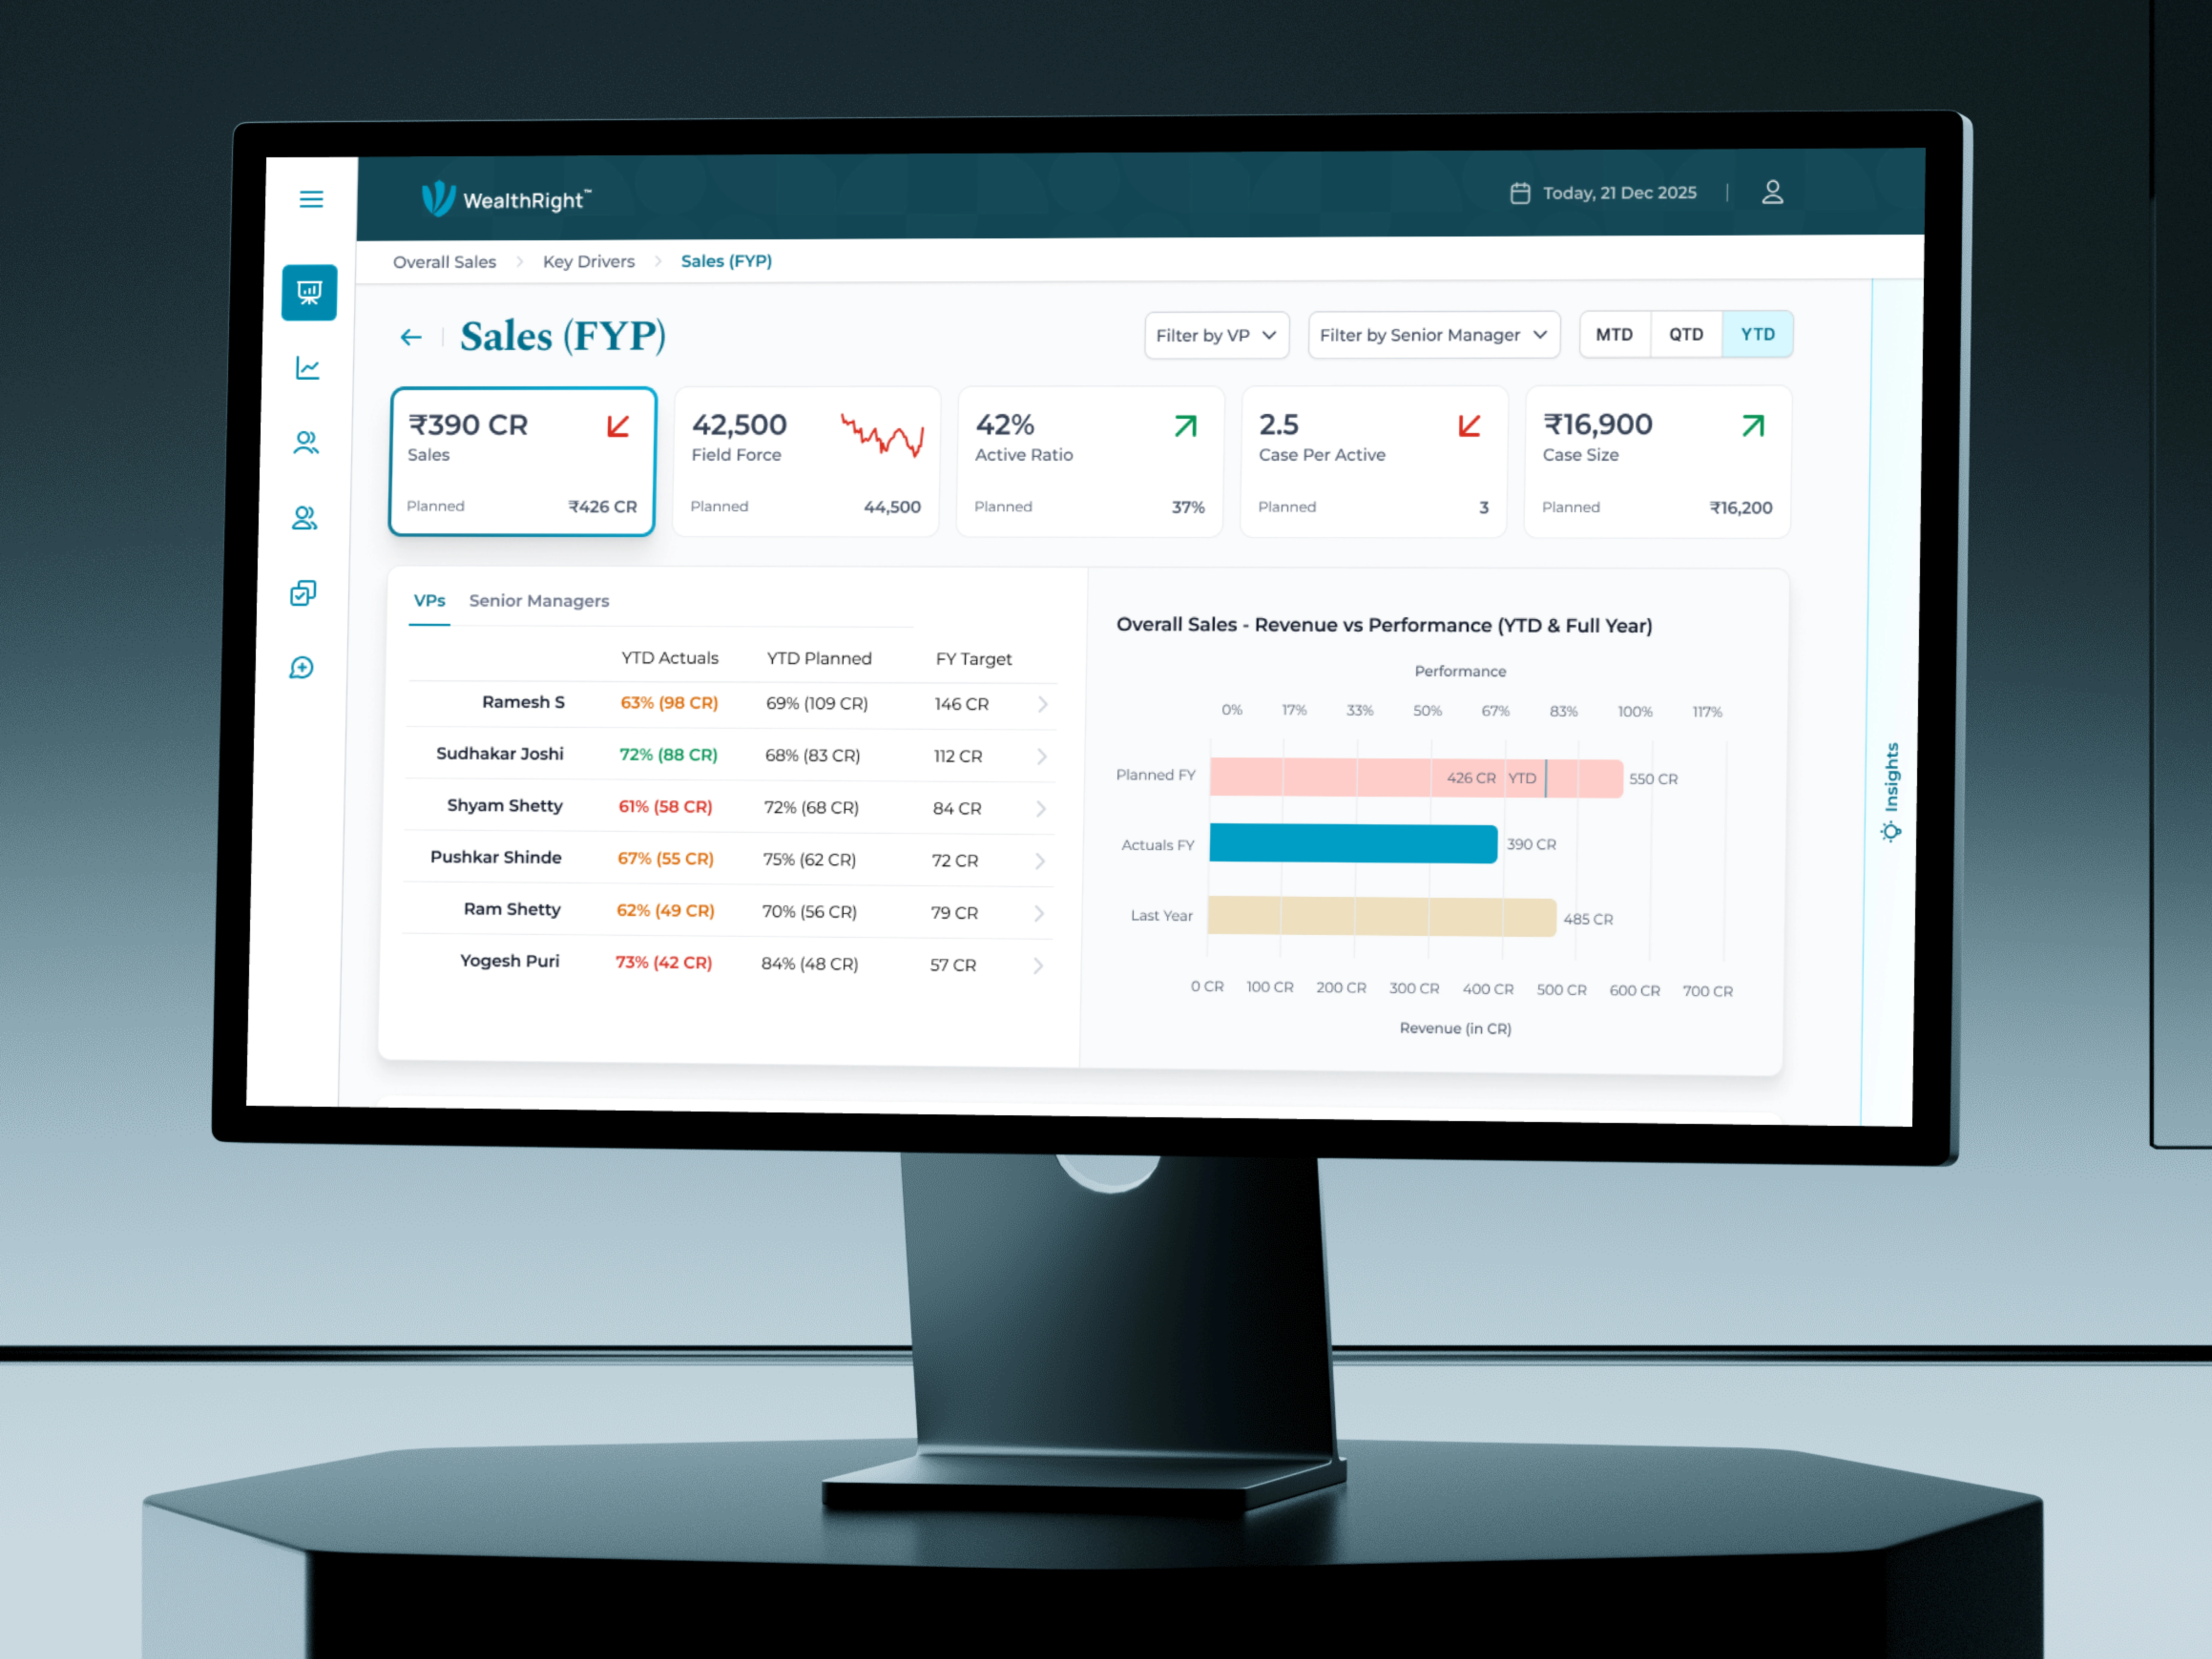
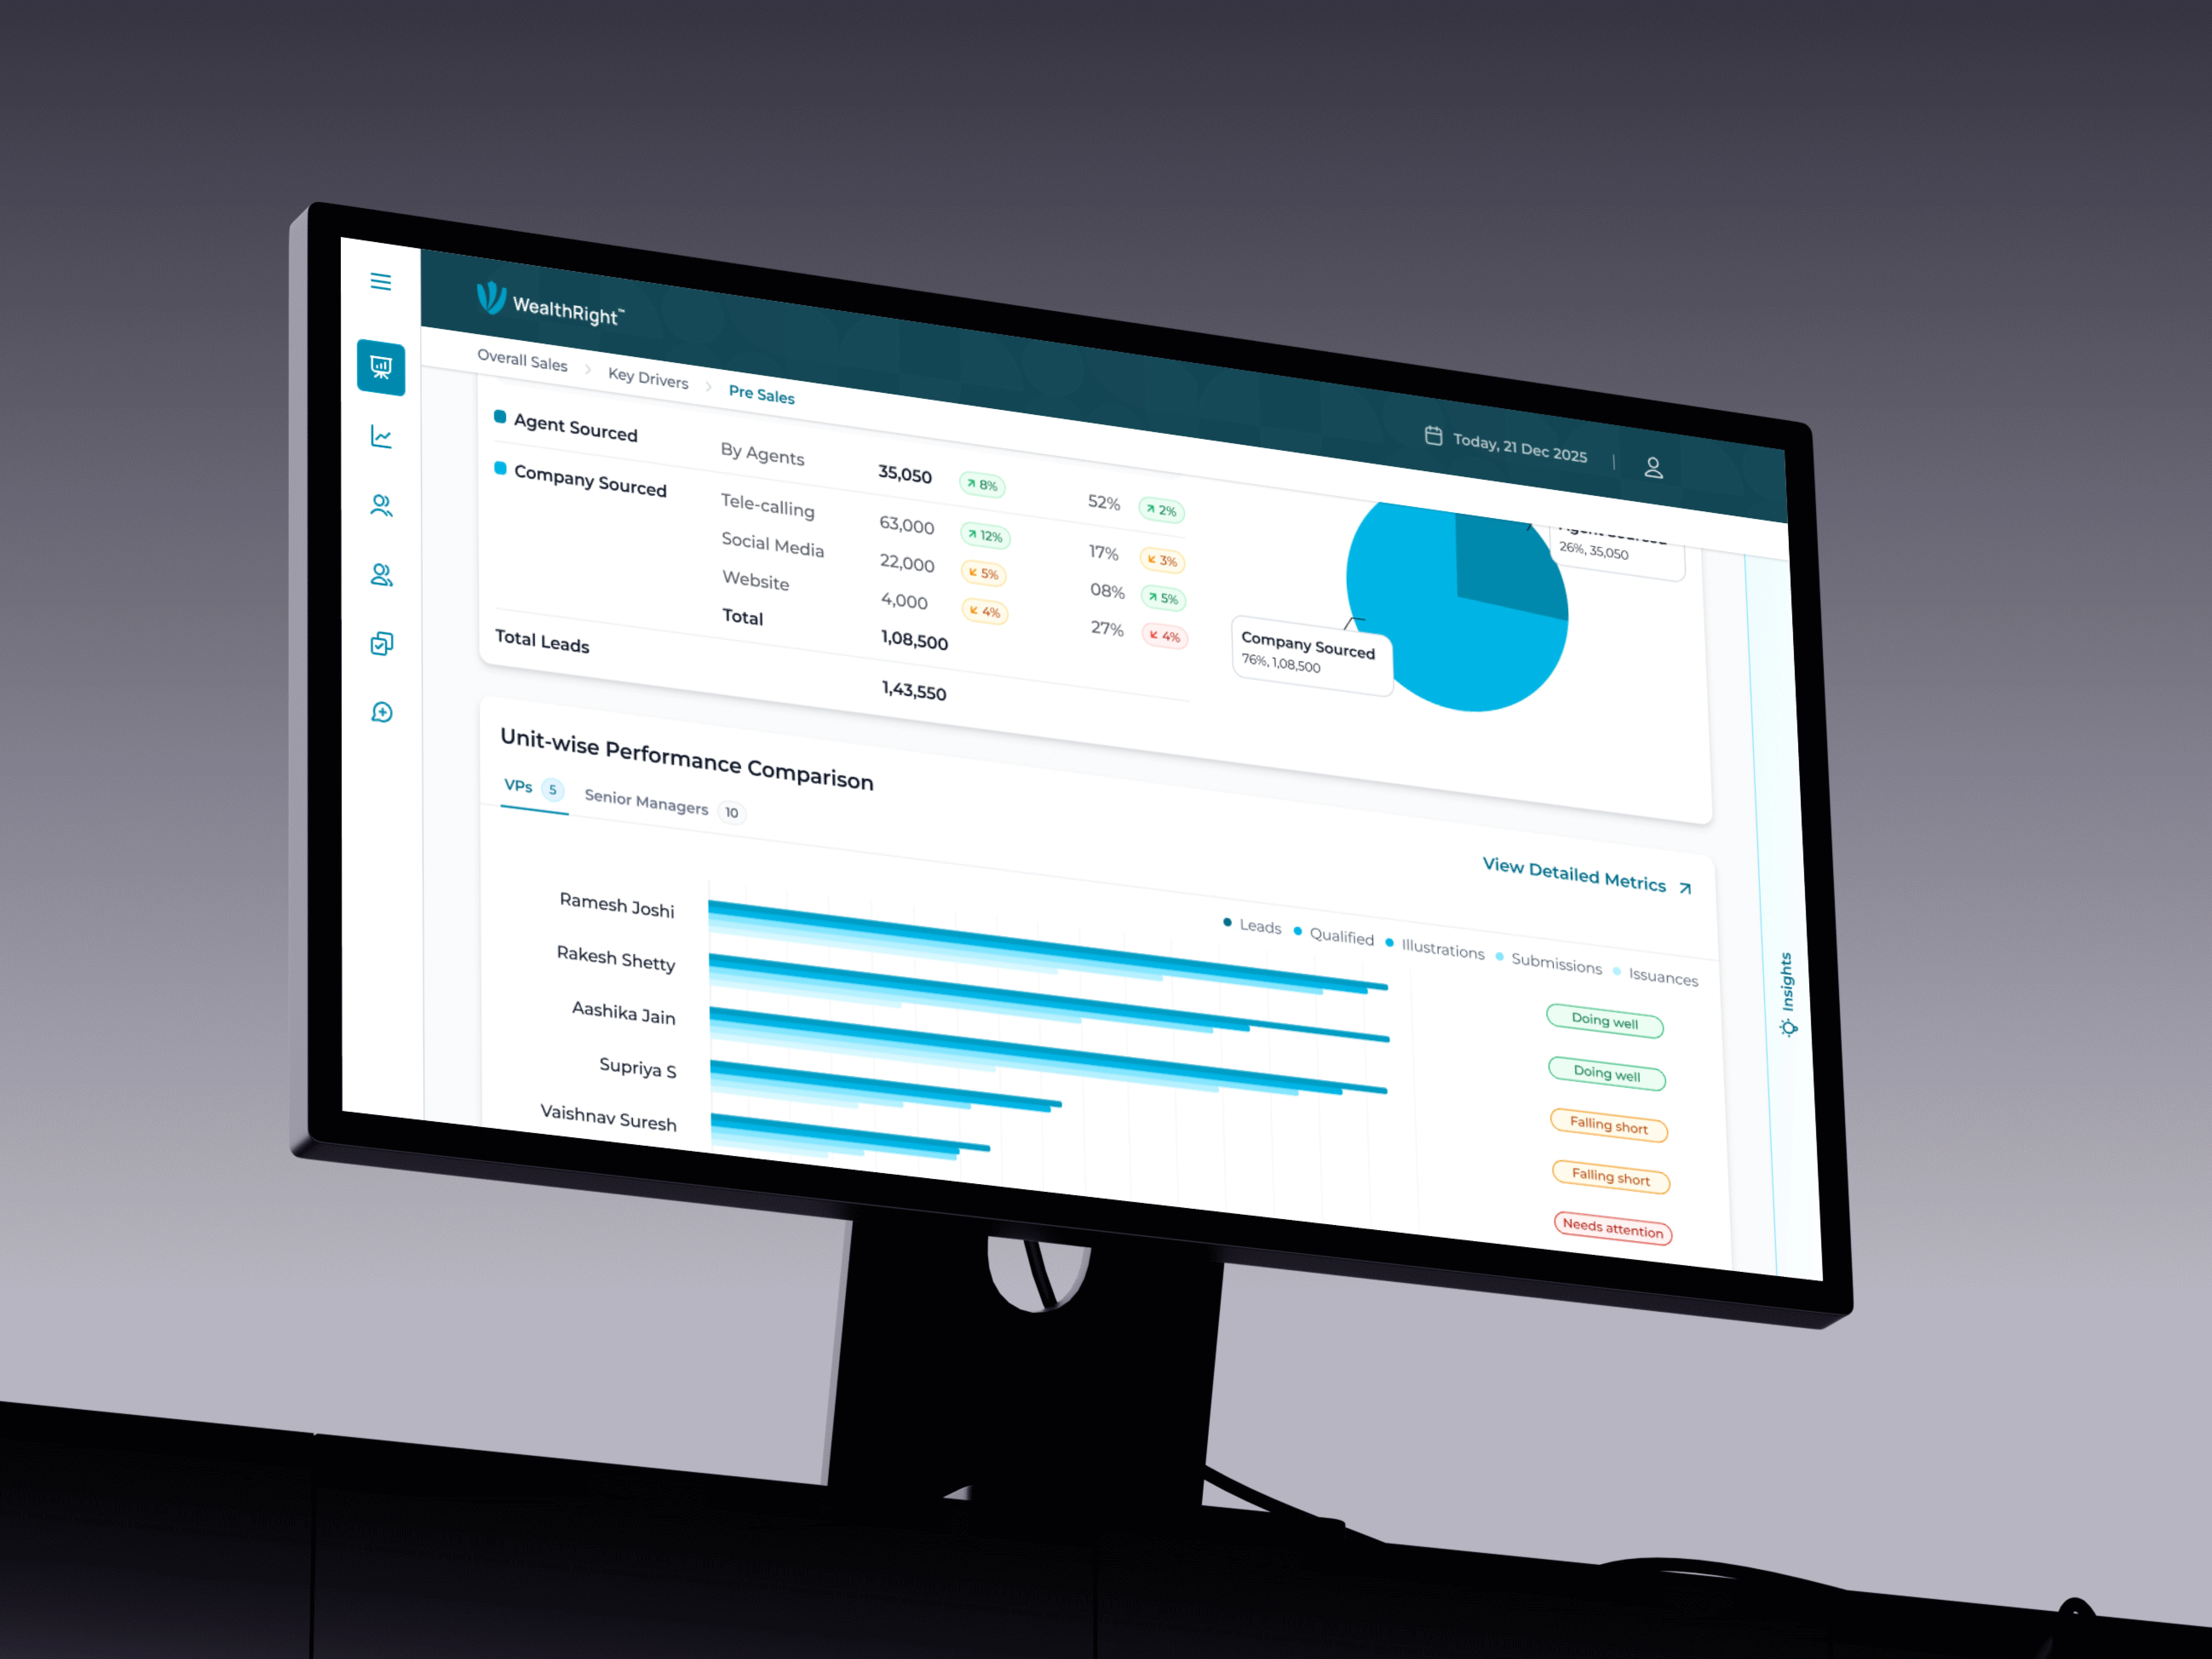
The dashboard is divided into top-level Overall Sales and specific Key Drivers of Pre Sales, Post Sales, Agent Quality & Expenses.
What we delivered
The final platform seamlessly integrates with all of an insurance company's data sources to translate raw numbers into a unified narrative.
We designed the UX with incredible depth a CXO can look at high-level Zonal Manager numbers, and with just a few clicks, drill all the way down to the Branch Manager, the Agent Manager, and finally to the performance of a single Agent on the ground.
To ensure leadership is never caught off guard, we also integrated an AI component to monitor data in real-time, instantly notifying CXOs of any sudden abnormalities or emerging risks so they can act immediately.
Measuring success
The results from the initial trials validated the entire approach.
CXOs using the executive dashboard reported feeling much more confident in their strategic decisions. They were making sense of complex trends 50% faster and identifying potential business risks almost 3-4x faster than their old spreadsheet methods.
Like this project
Posted Feb 19, 2026
Insurance leaders don’t need more data. They need direction. We designed an AI-driven dashboard that cuts through noise and tells CXOs exactly what to do next.
Likes
2
Views
12
Timeline
Jul 1, 2025 - Sep 30, 2025
Clients
WealthRight