
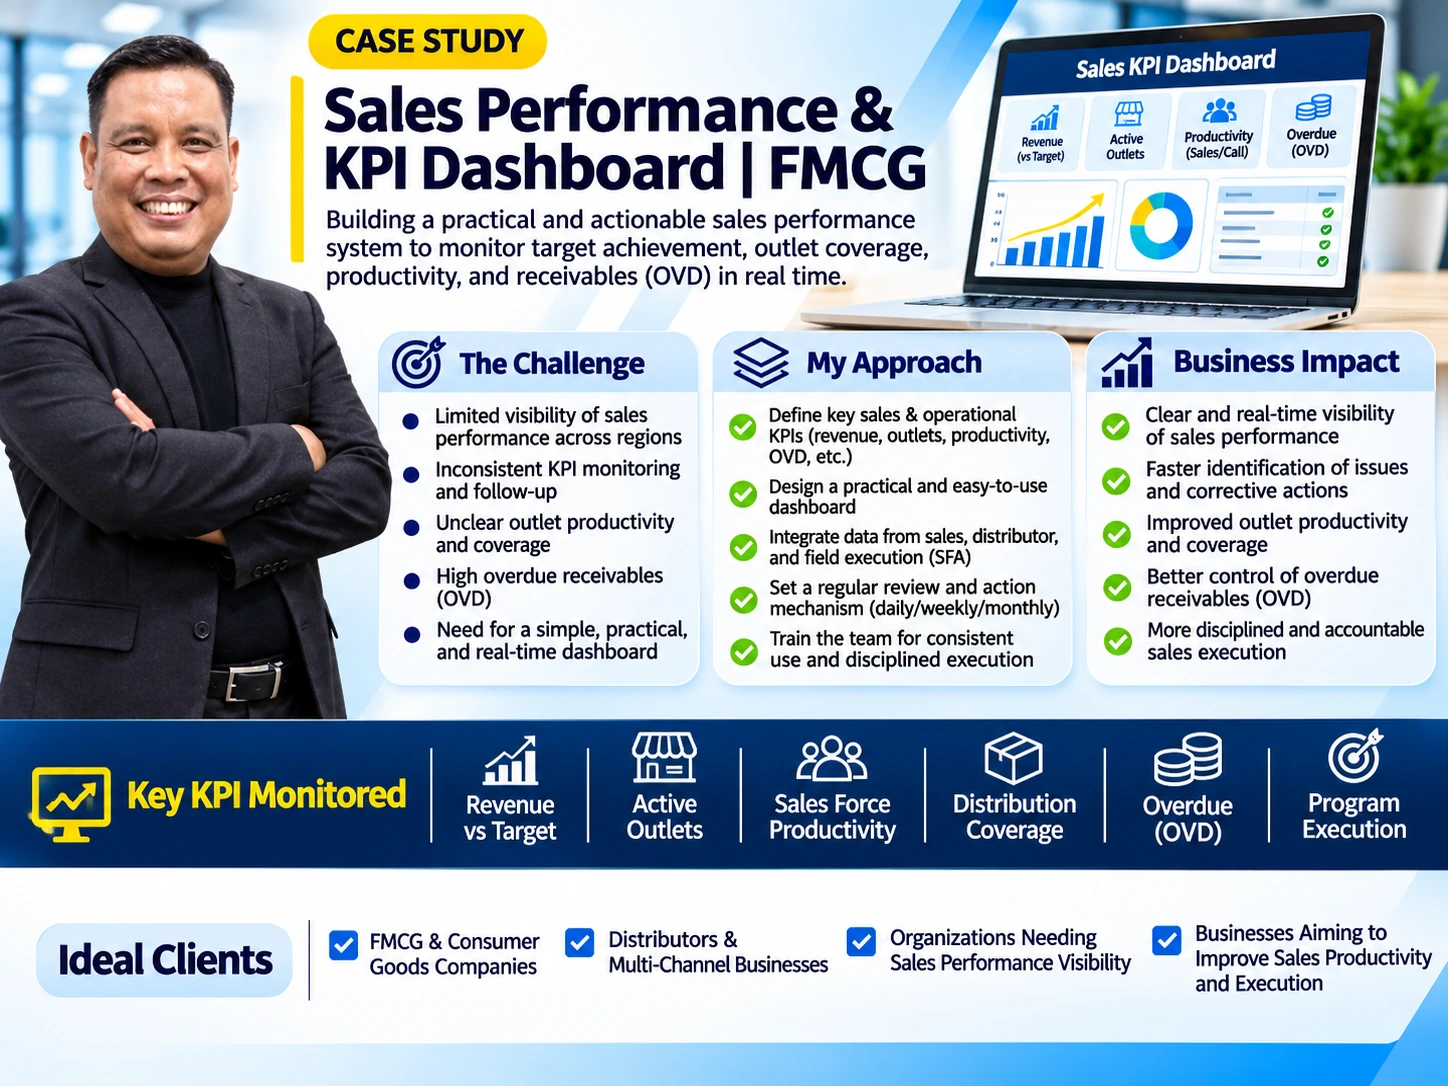
Sales Performance & KPI Dashboard | FMCG
OVERVIEW
You can't fix what you can't see.
FMCG sales teams operate across multiple regions, distributors, channels, and thousands of outlets. Without a clear performance system, management sees problems too late, after the month is already lost.
This project shows how I build practical sales KPI frameworks and dashboards that connect revenue targets with daily field execution.
THE CHALLENGE
• Limited visibility of performance by region and territory
• Inconsistent tracking of targets vs. achievement
• Outlet numbers growing, but productivity staying low
• Ineffective sales force deployment
• Principal and distributor sales reports that don't match
• Weak overdue and collection monitoring
• Performance gaps identified too late
MY APPROACH
Sales KPI Framework
Clear definitions for the KPIs that drive results:
• Revenue vs. target, volume, and growth
• Active and productive outlets
• Numeric Distribution (ND) and Weighted Distribution (WD)
• Sales rep productivity, strike rate, and call productivity
• Distributor performance
• Overdue receivables and collection effectiveness
Dashboard Development
A practical management dashboard showing performance by region, distributor, channel, and sales team.
Performance Gap Analysis
Find the gap between target and actual, identify root causes, and prioritize what management must act on.
Field Execution Monitoring
Track Field Journey Plans (FJP), outlet visits, New Outlet Opening (NOO), and productive calls.
Review & Corrective Action
A clear review rhythm: daily execution, weekly performance tracking, and monthly business reviews.
WHAT YOU GET
• KPI framework with measurement definitions
• Sales performance dashboard structure
• Target achievement and revenue analysis
• Outlet coverage and productivity assessment
• Sales force effectiveness review
• Distributor performance monitoring
• Overdue receivables monitoring framework
• Gap analysis and corrective action plan
• Management review and reporting structure
BUSINESS BENEFITS
• Full visibility of sales performance
• Earlier detection of revenue and execution gaps
• Stronger sales team accountability
• Higher outlet productivity and distribution effectiveness
• Better distributor and receivables control
• Faster, data-driven commercial decisions
IDEAL FOR
• FMCG, food & beverage, and consumer goods manufacturers
• National and regional distributors
• Multi-channel sales organizations
• Companies looking to improve field sales productivity
WHY WORK WITH ME
Senior FMCG sales and distribution leader in Indonesia, with a track record that includes:
• Managing sales operations across 48 branches
• Monitoring performance of 42,000+ active outlets
• Reducing credit overdue from above 20% to approx. 4%
I combine strategic thinking with field reality, turning sales data into clear priorities and actions.
MY FOCUS
Better visibility. Stronger execution. More productive sales operations.
Note: Dashboard examples are illustrative unless identified as actual historical results. No confidential company or customer information is disclosed.
0 likes · 3 views · Nov 3, 2026
Designing practical sales KPI dashboards to monitor revenue, outlet coverage, sales productivity, distribution performance, and overdue receivables.


