GRAPHIC DESIGN

Lois Mata


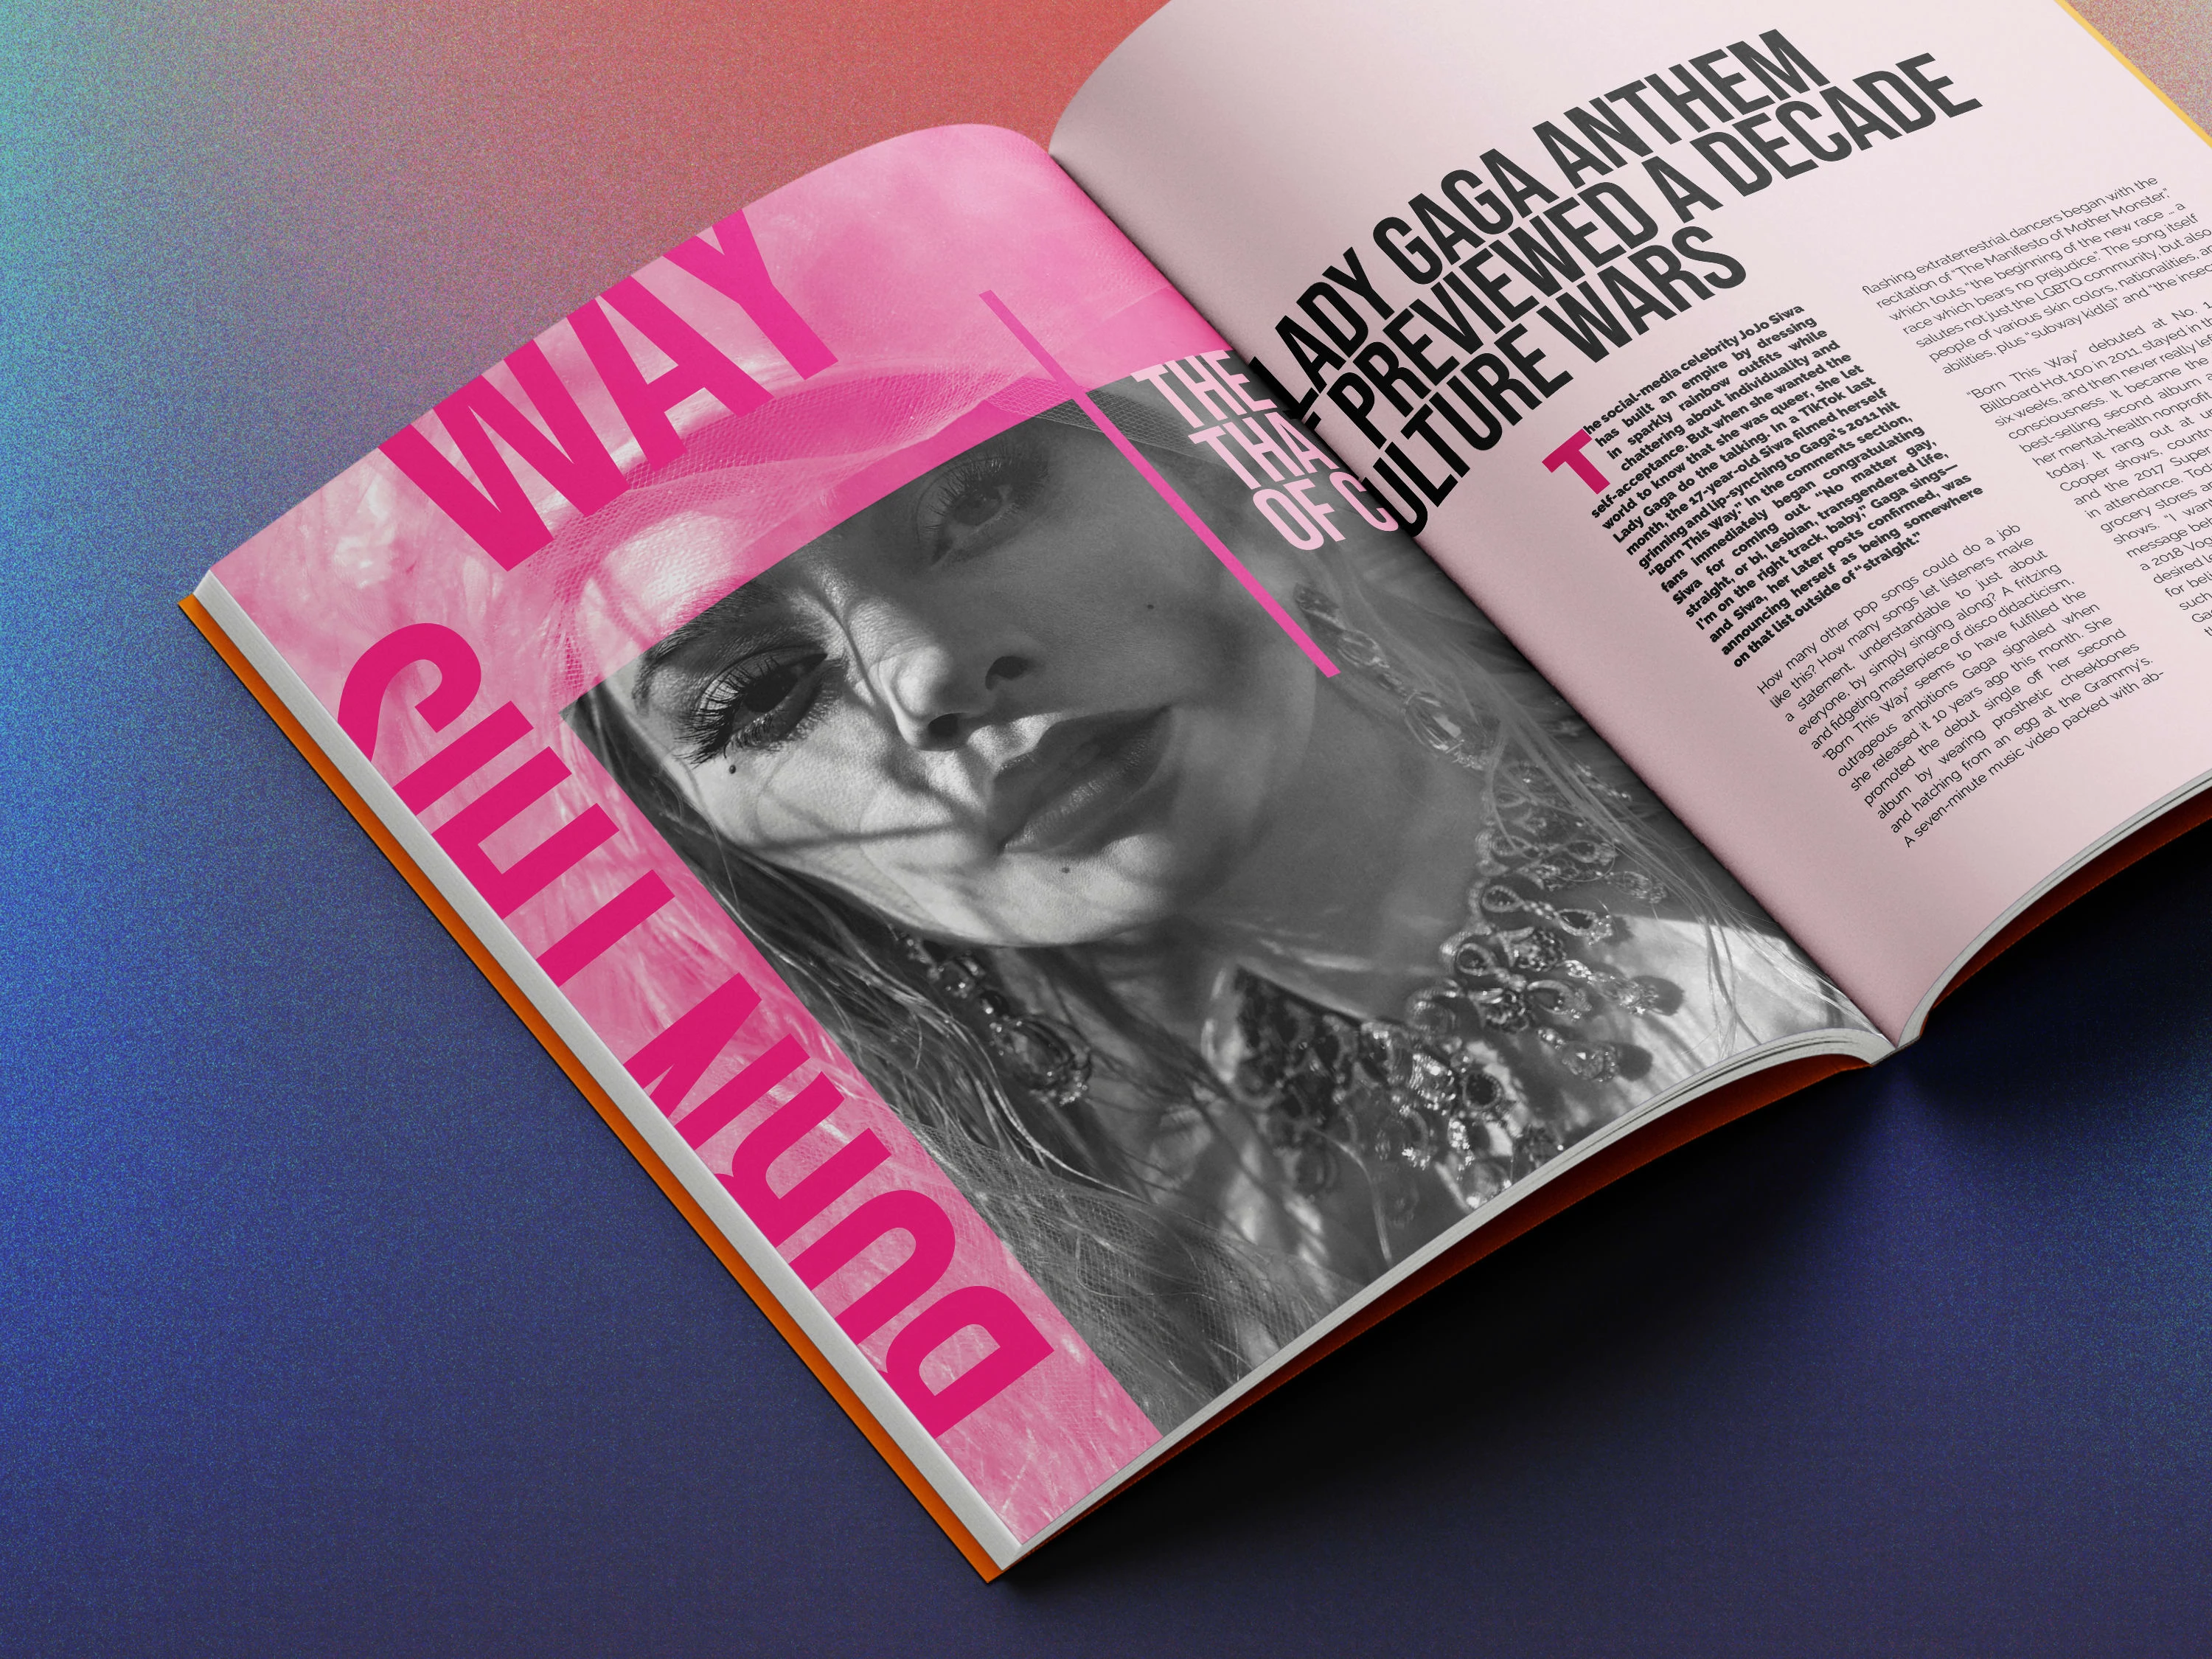
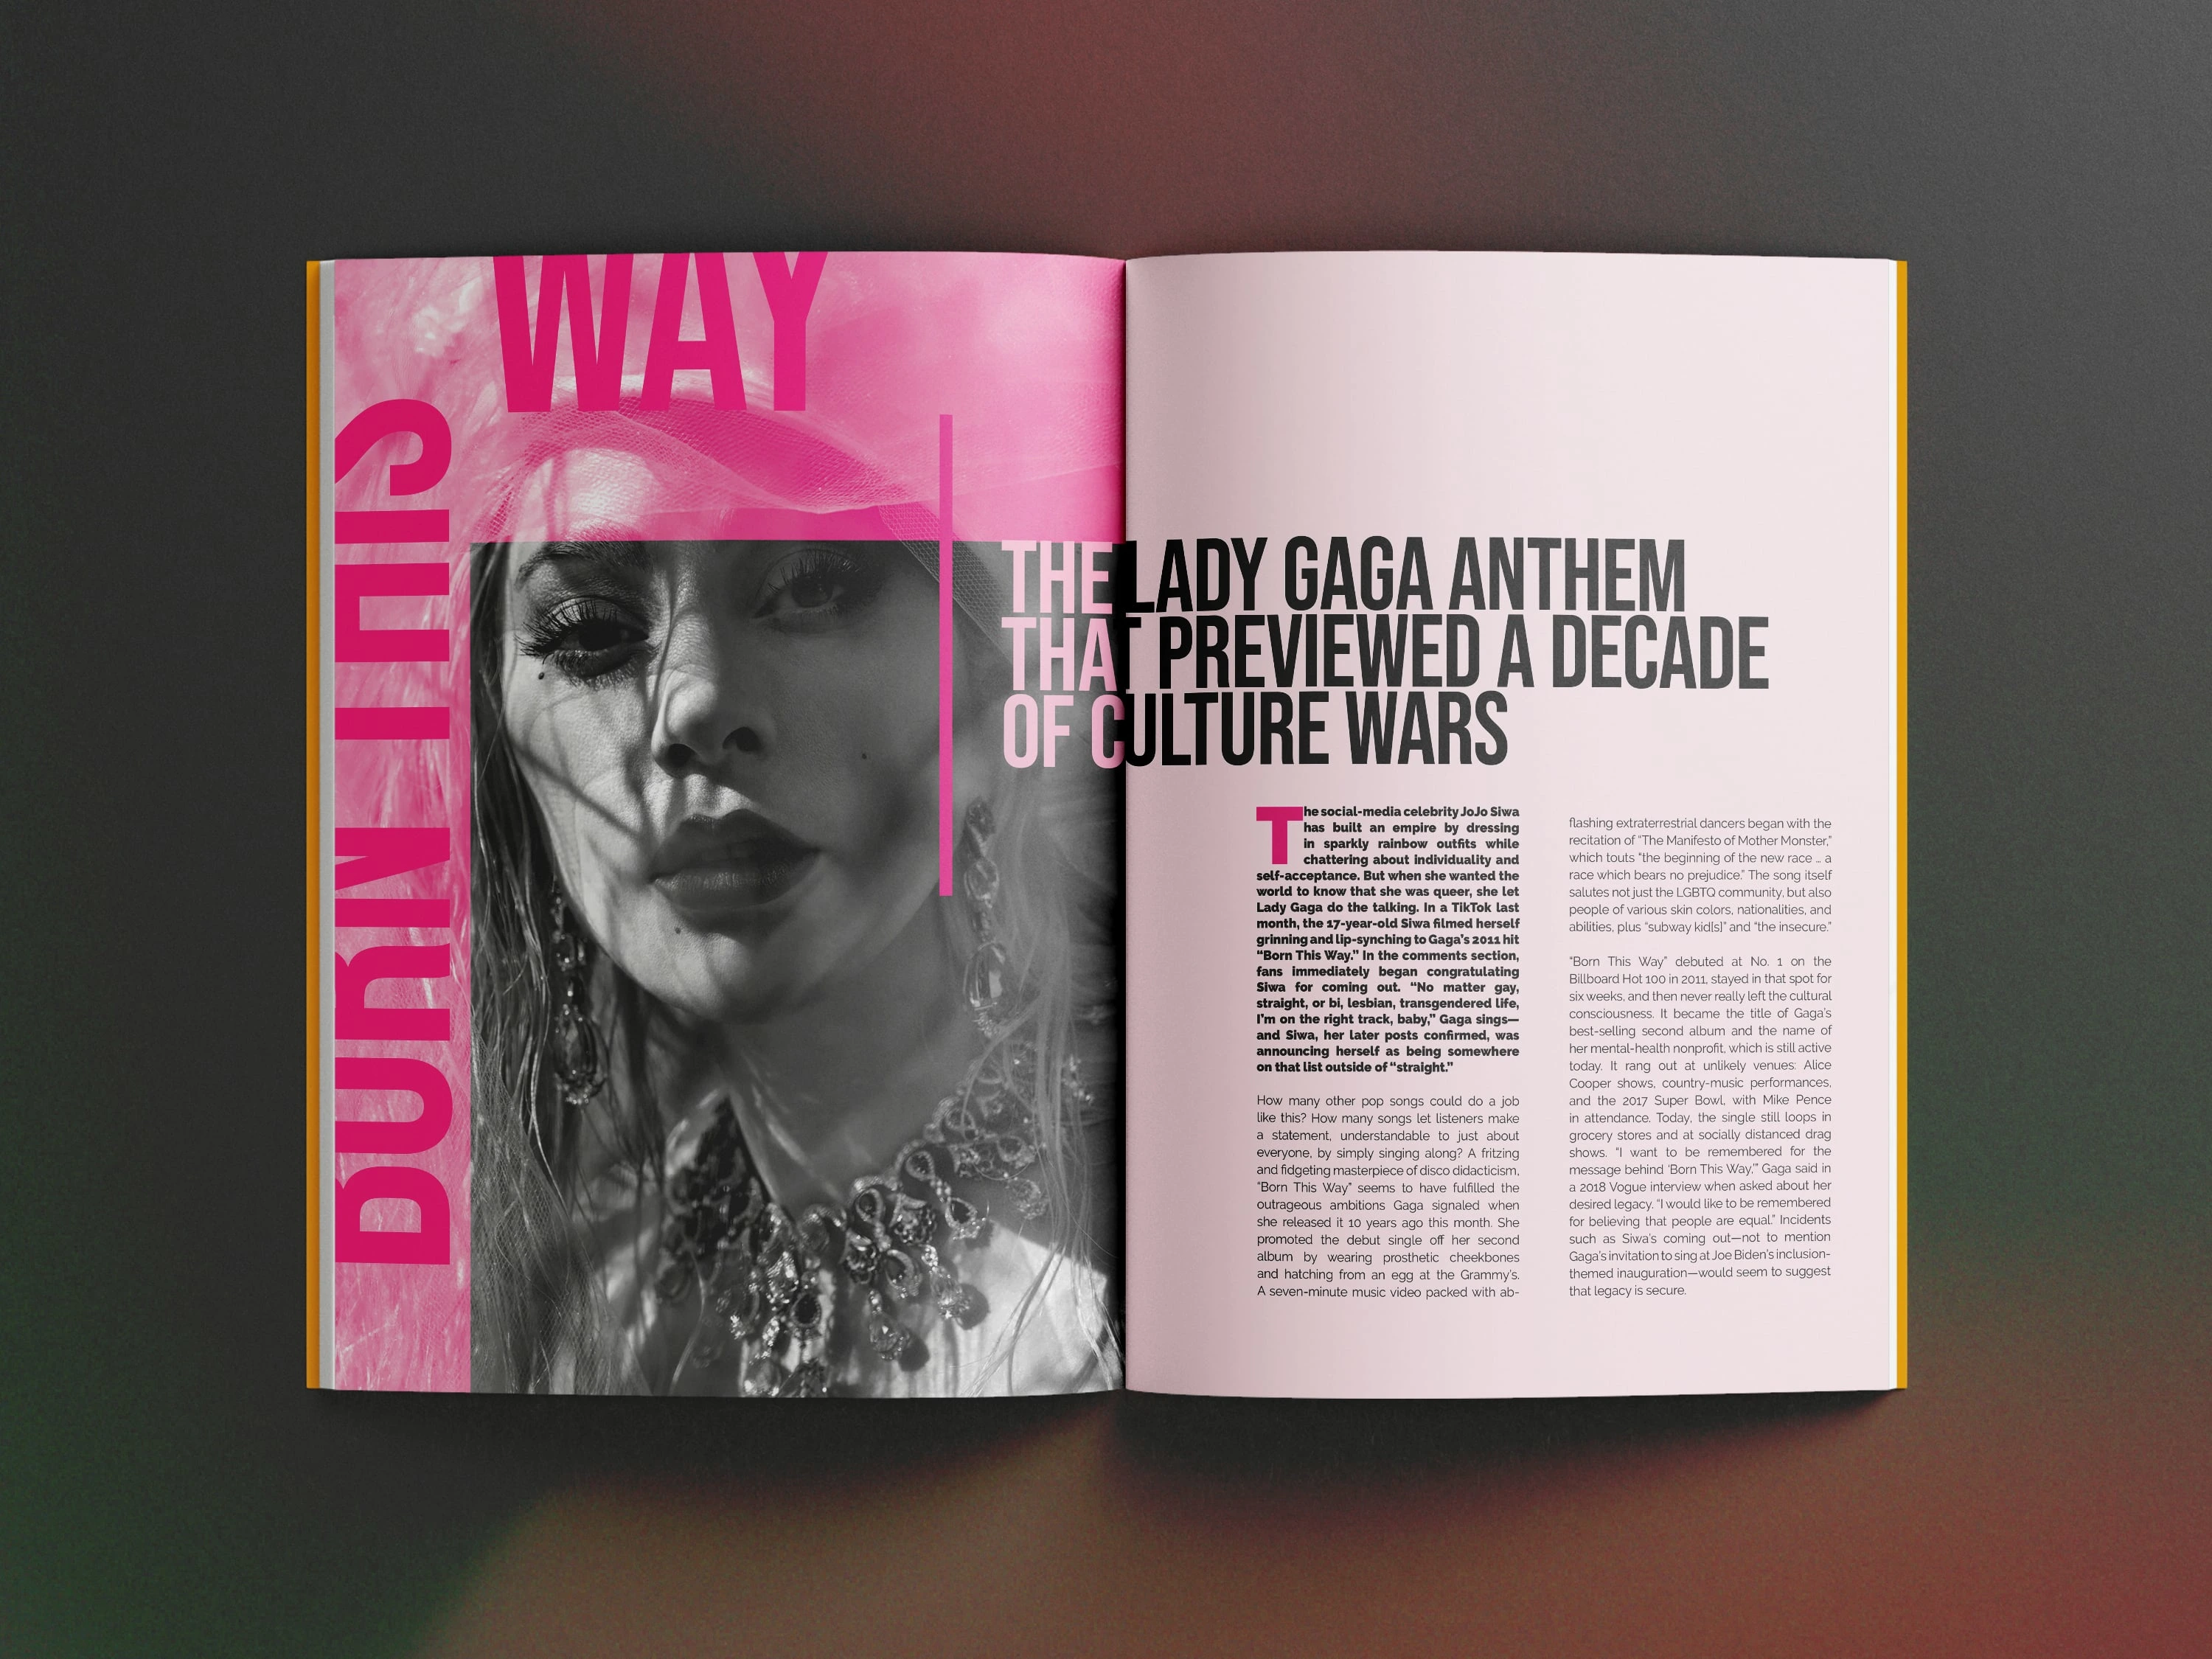
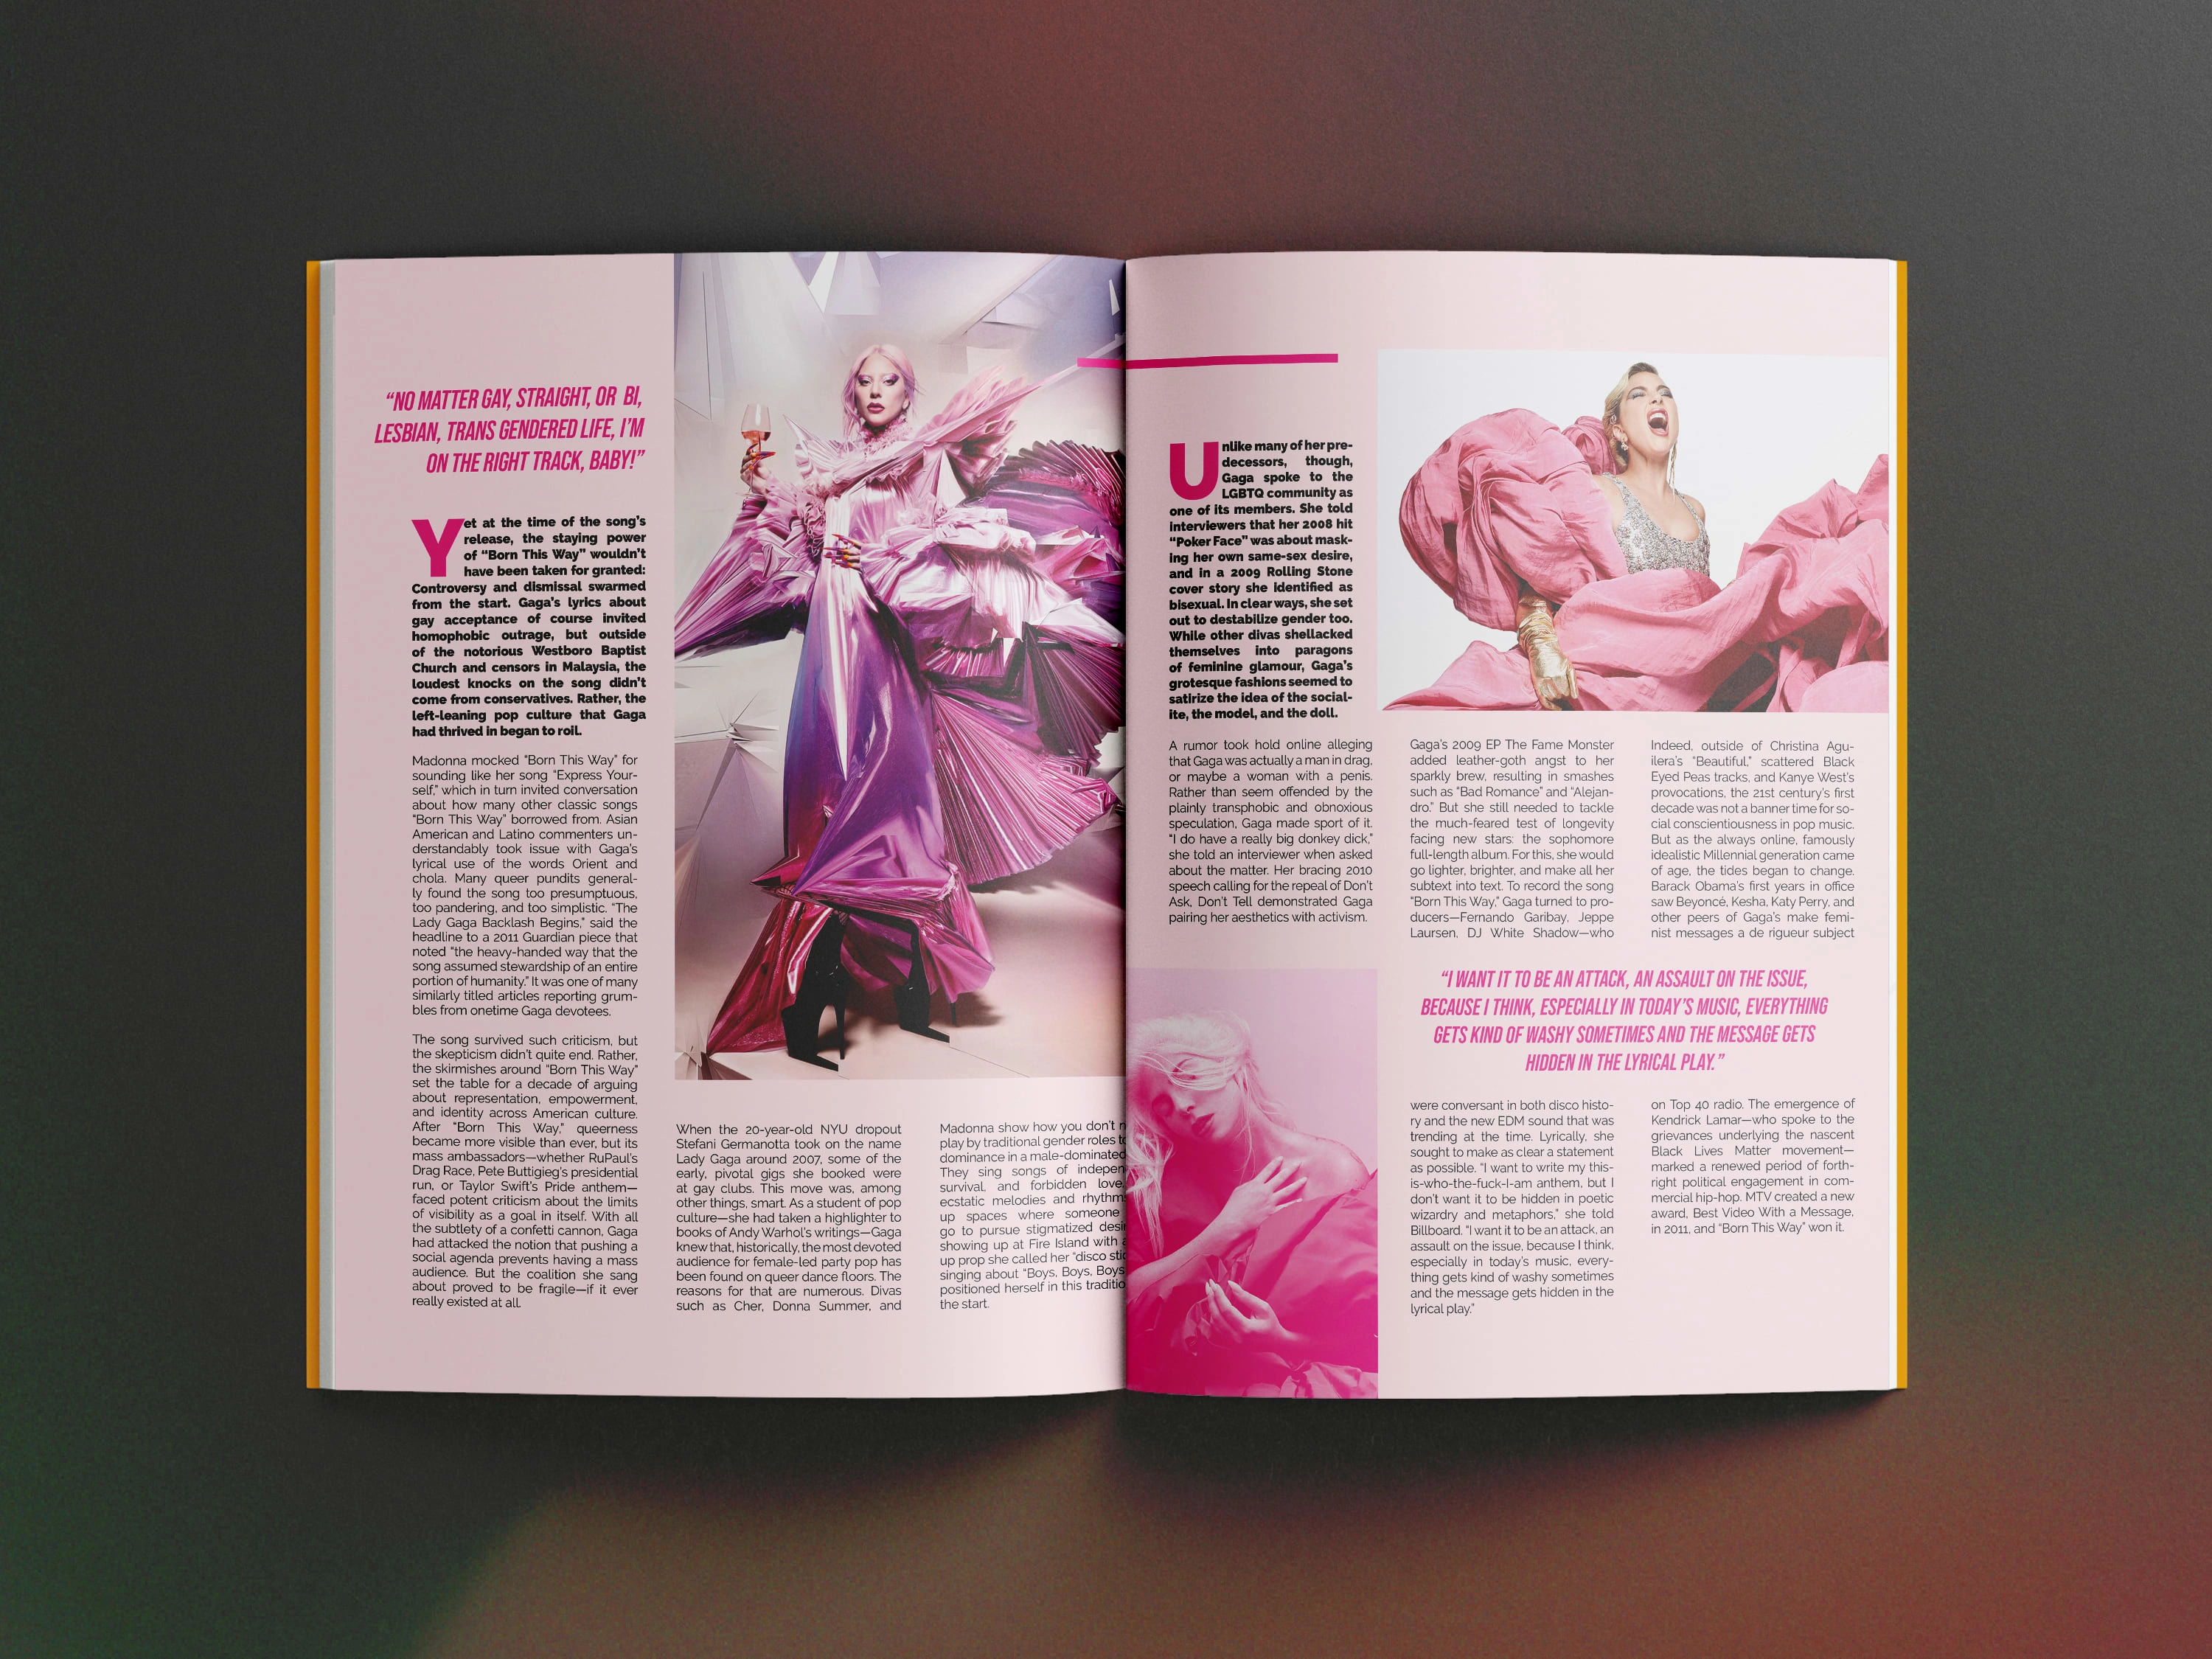
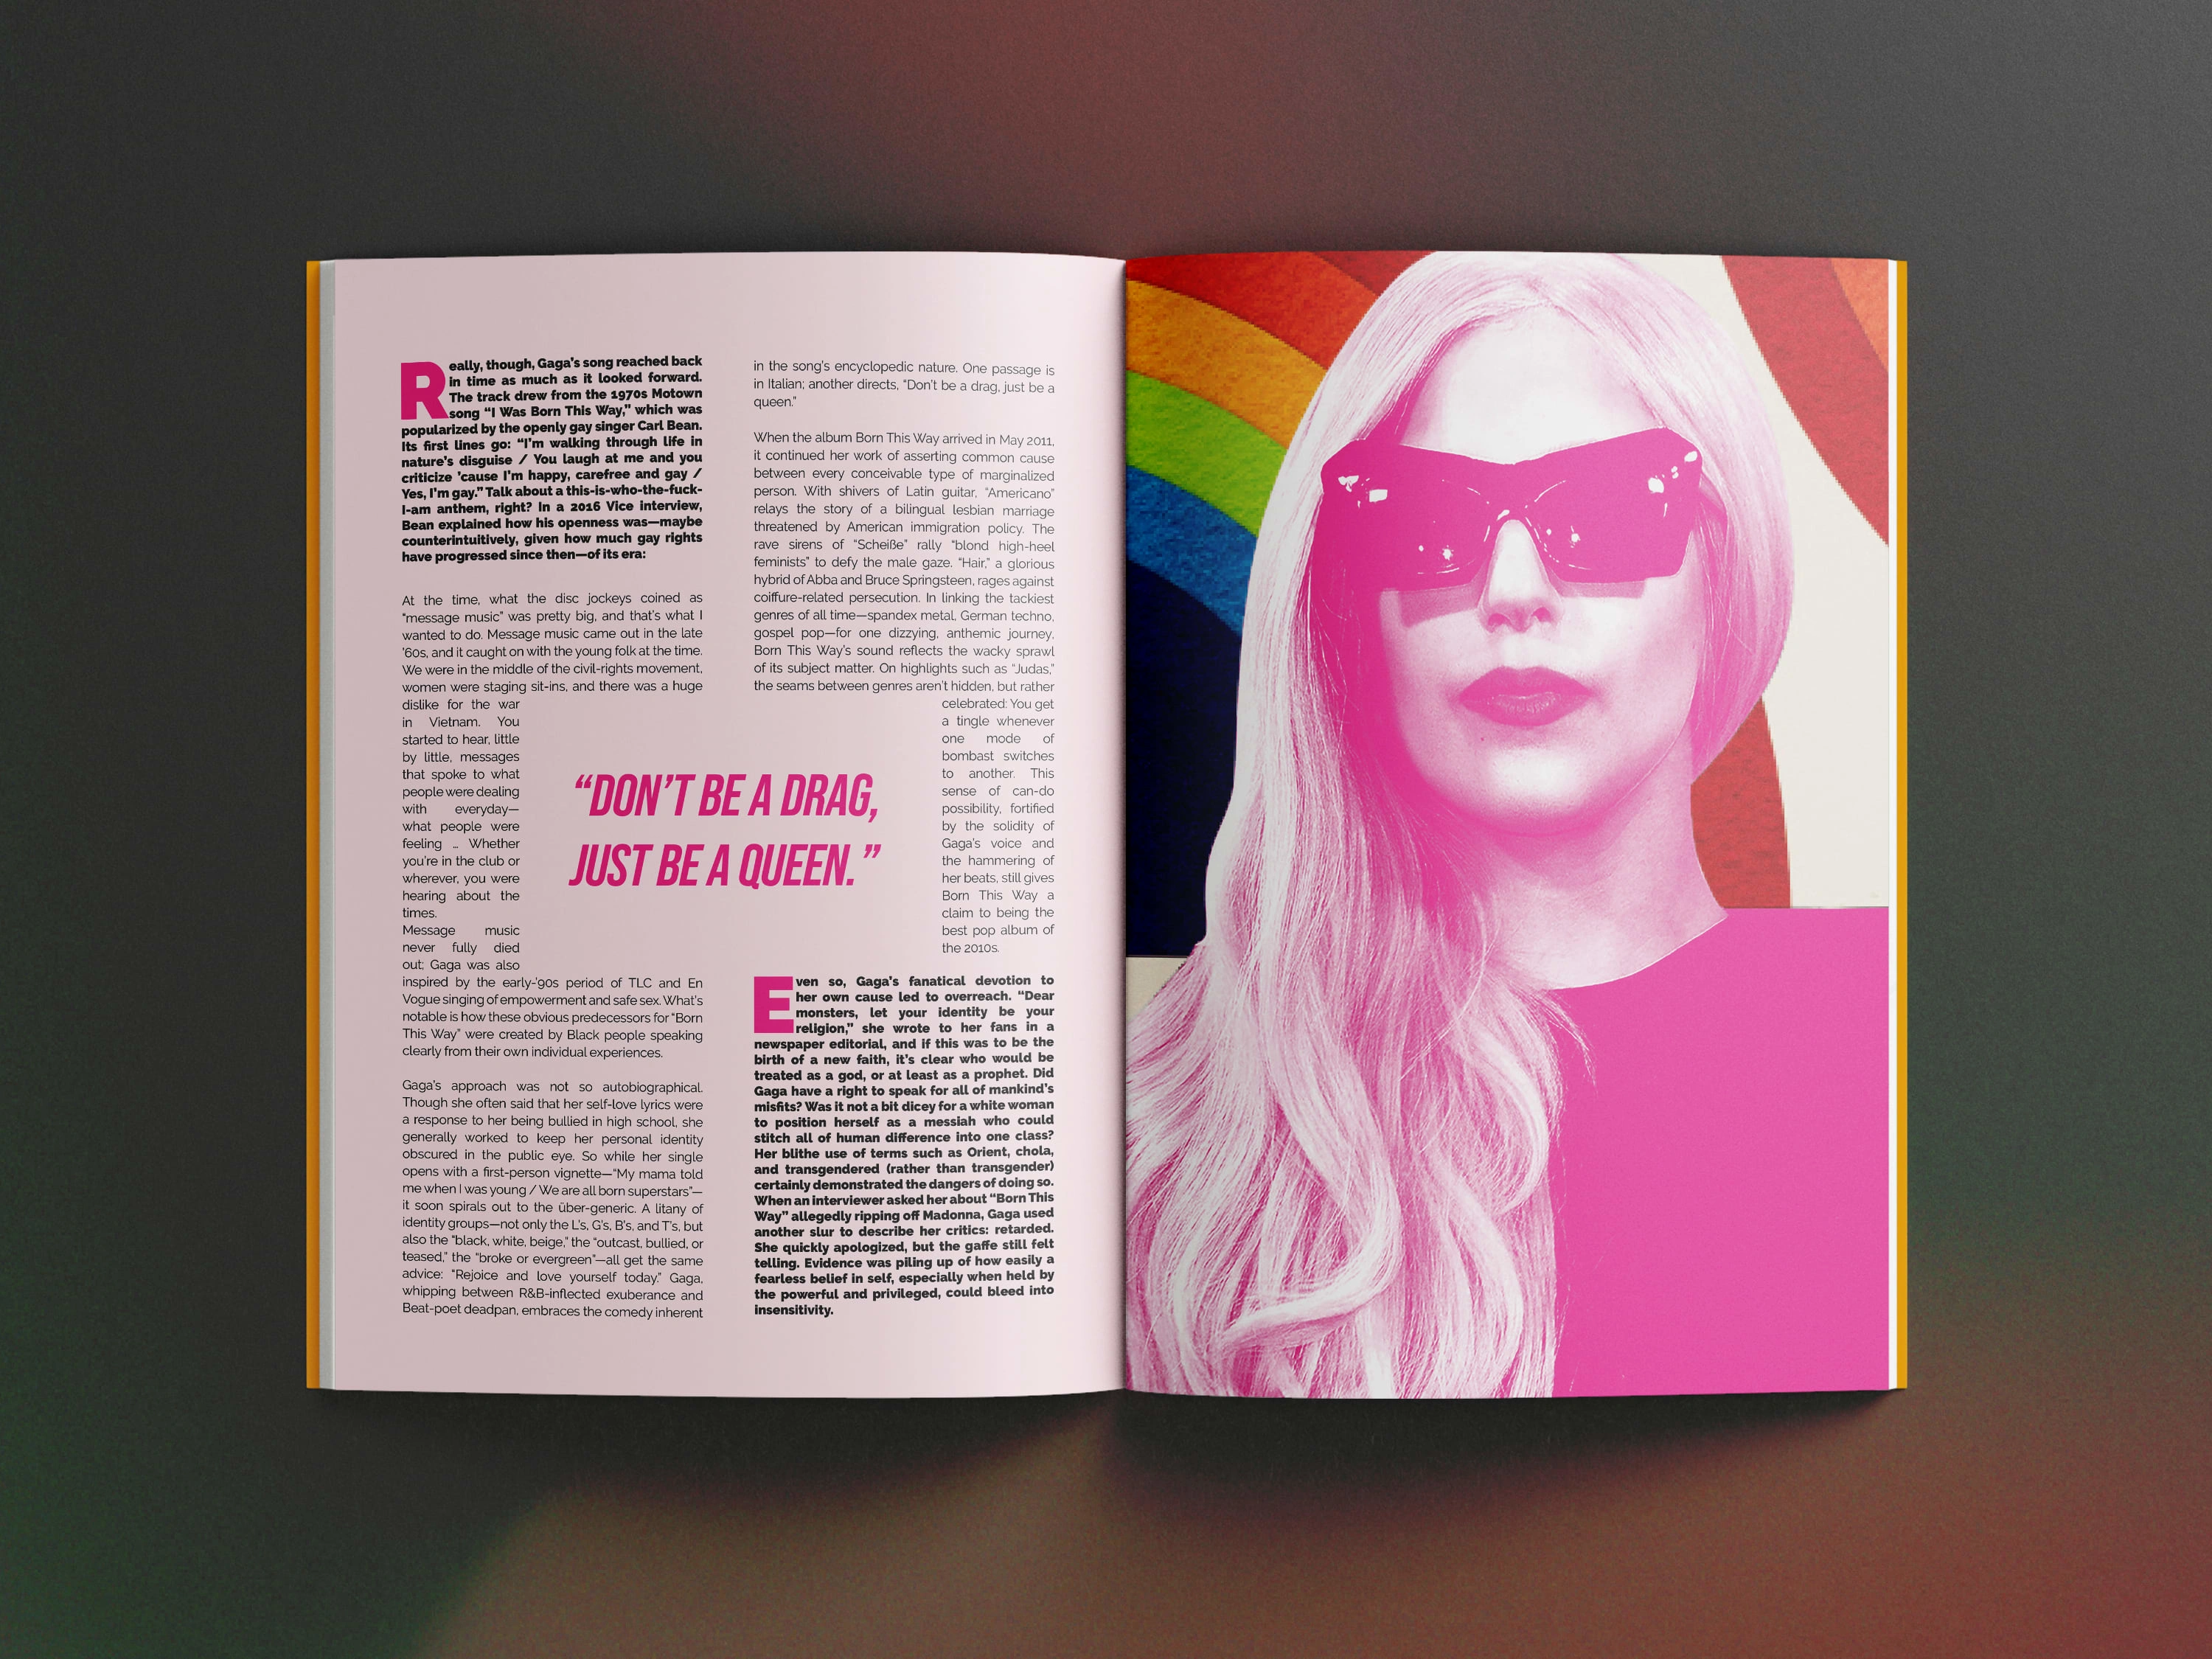
LADY GAGA Magazine Article
Tools: Adobe Indesign, Adobe Photoshop
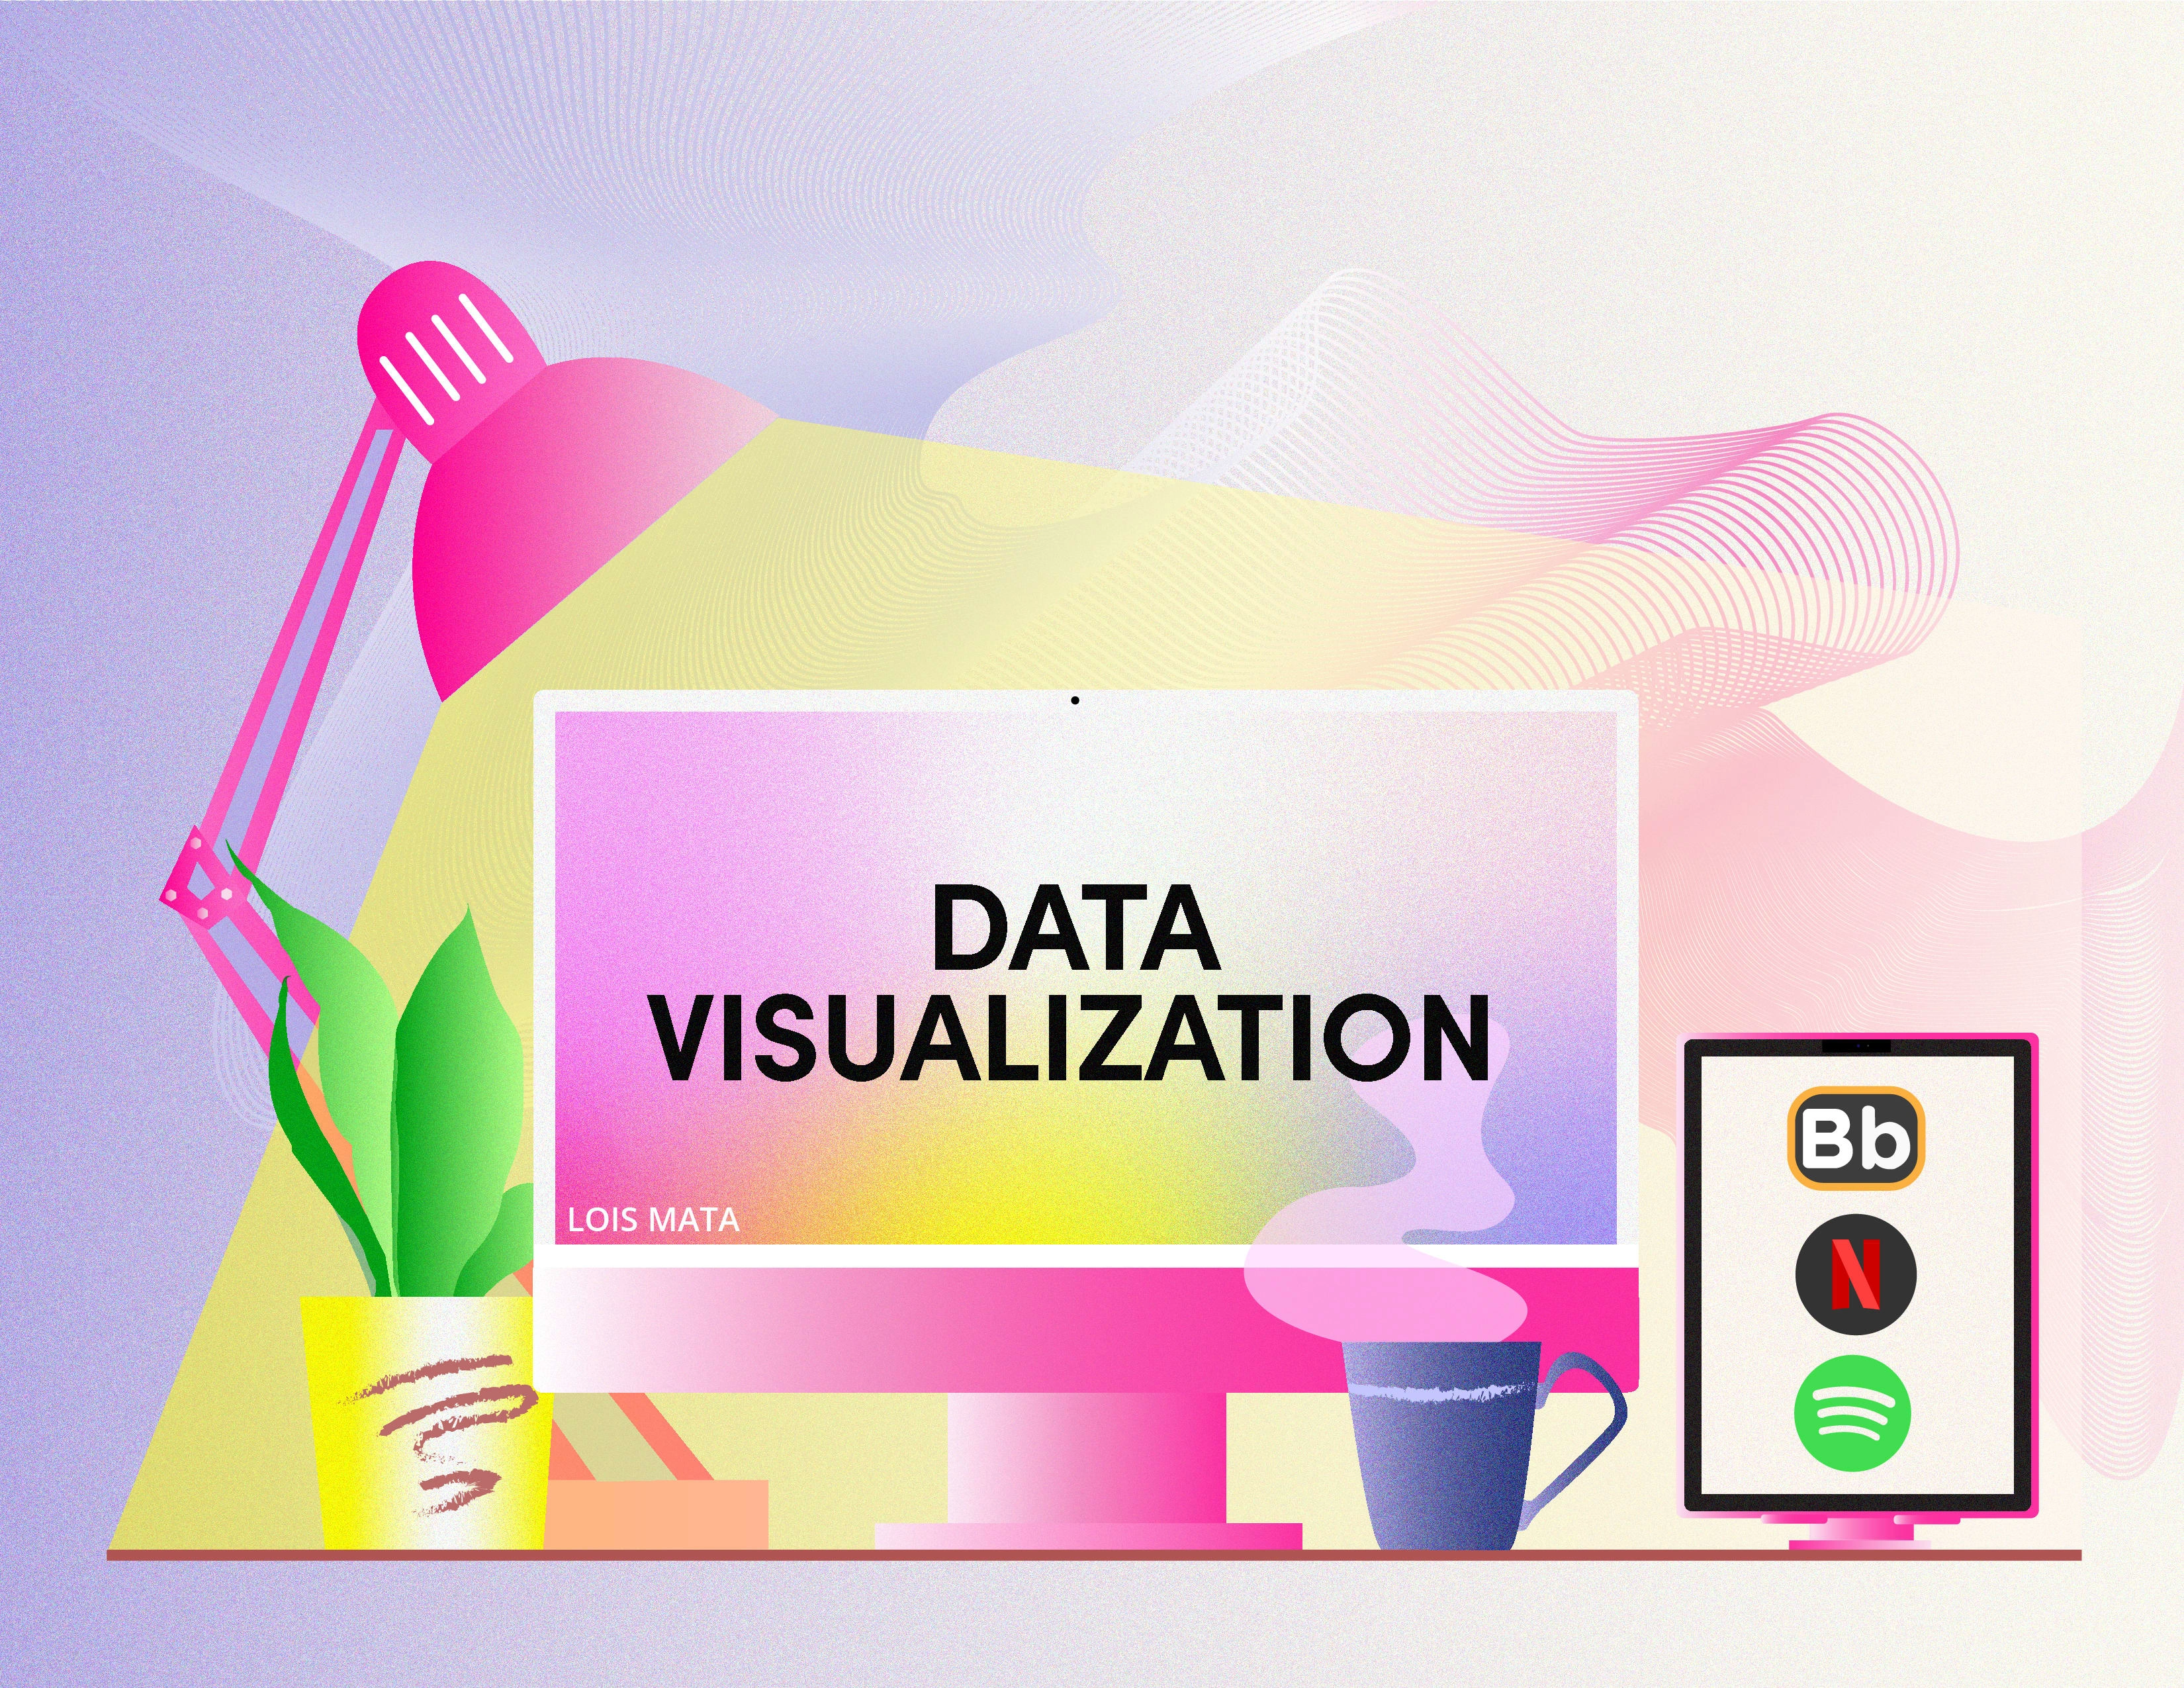
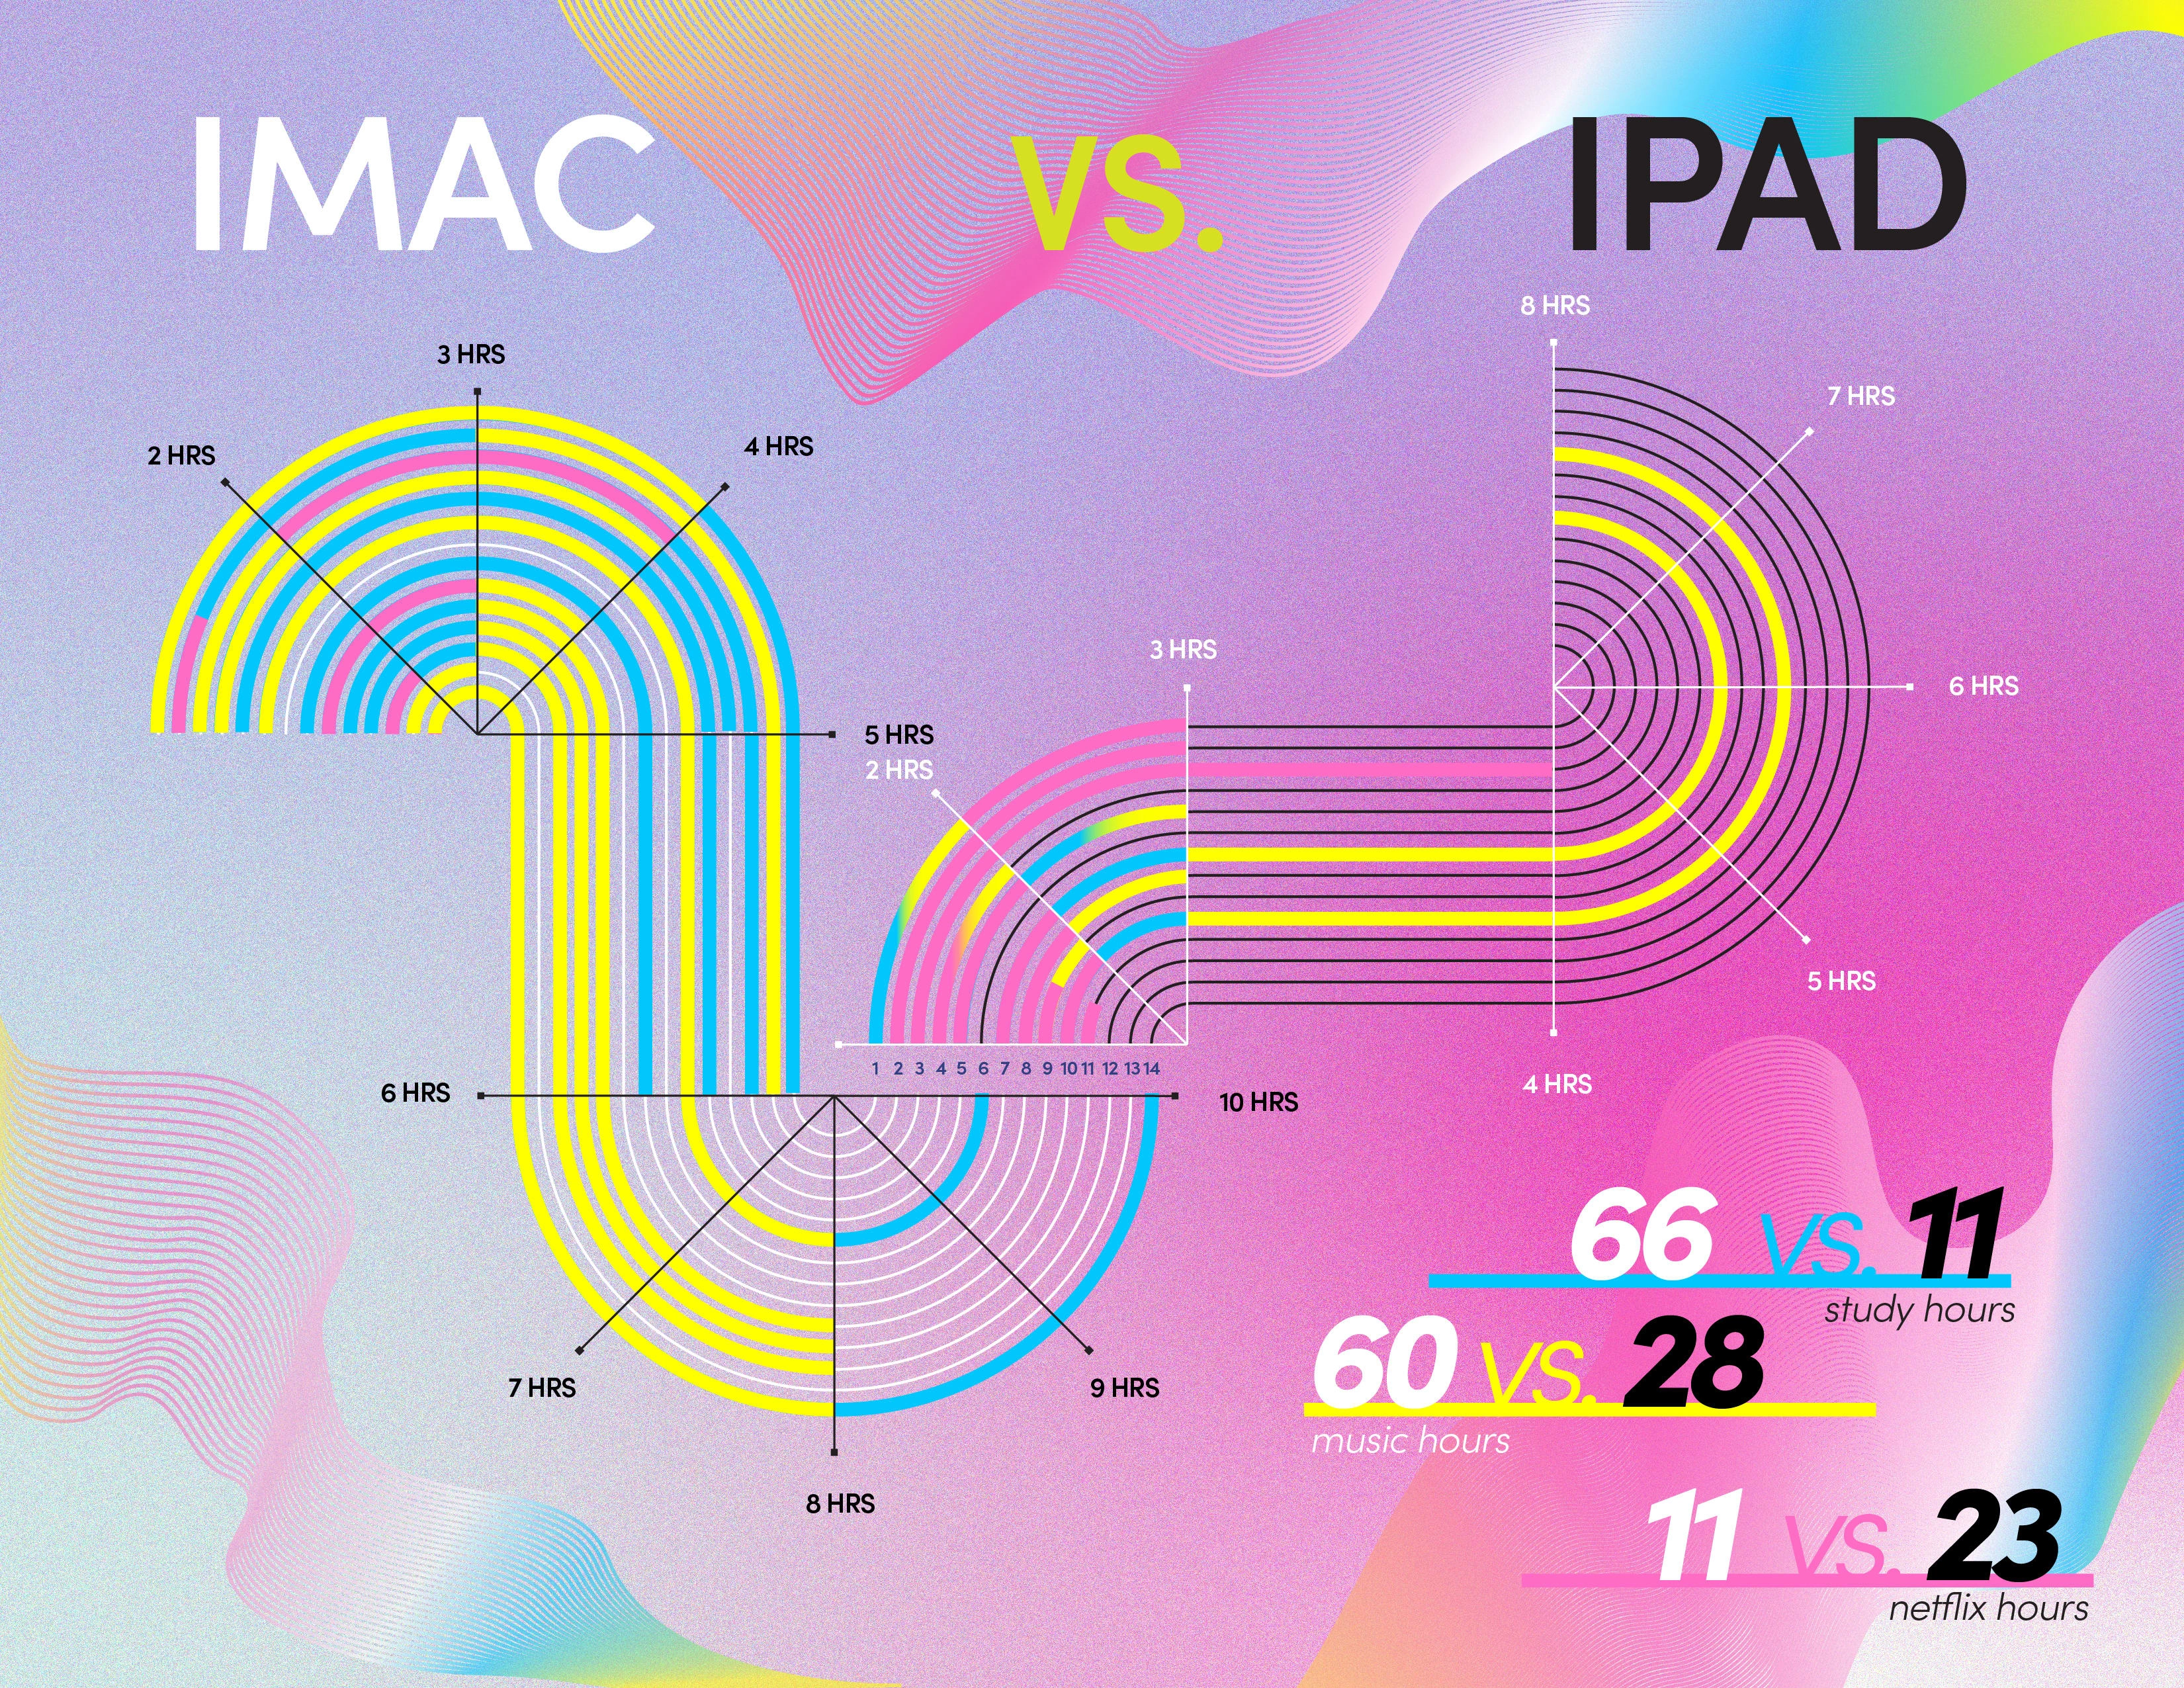
DATA VISUALIZATION
Tools: Adobe Illustrator
Using data collected over the course of 14 days, this visualization shows how many hours of usage have been tracked on Blackboard, Netflix, and Spotify on both iMac and iPad. The number of hours tracked determines which gadget has better reliability.
View the whole documentation here:
ANINO
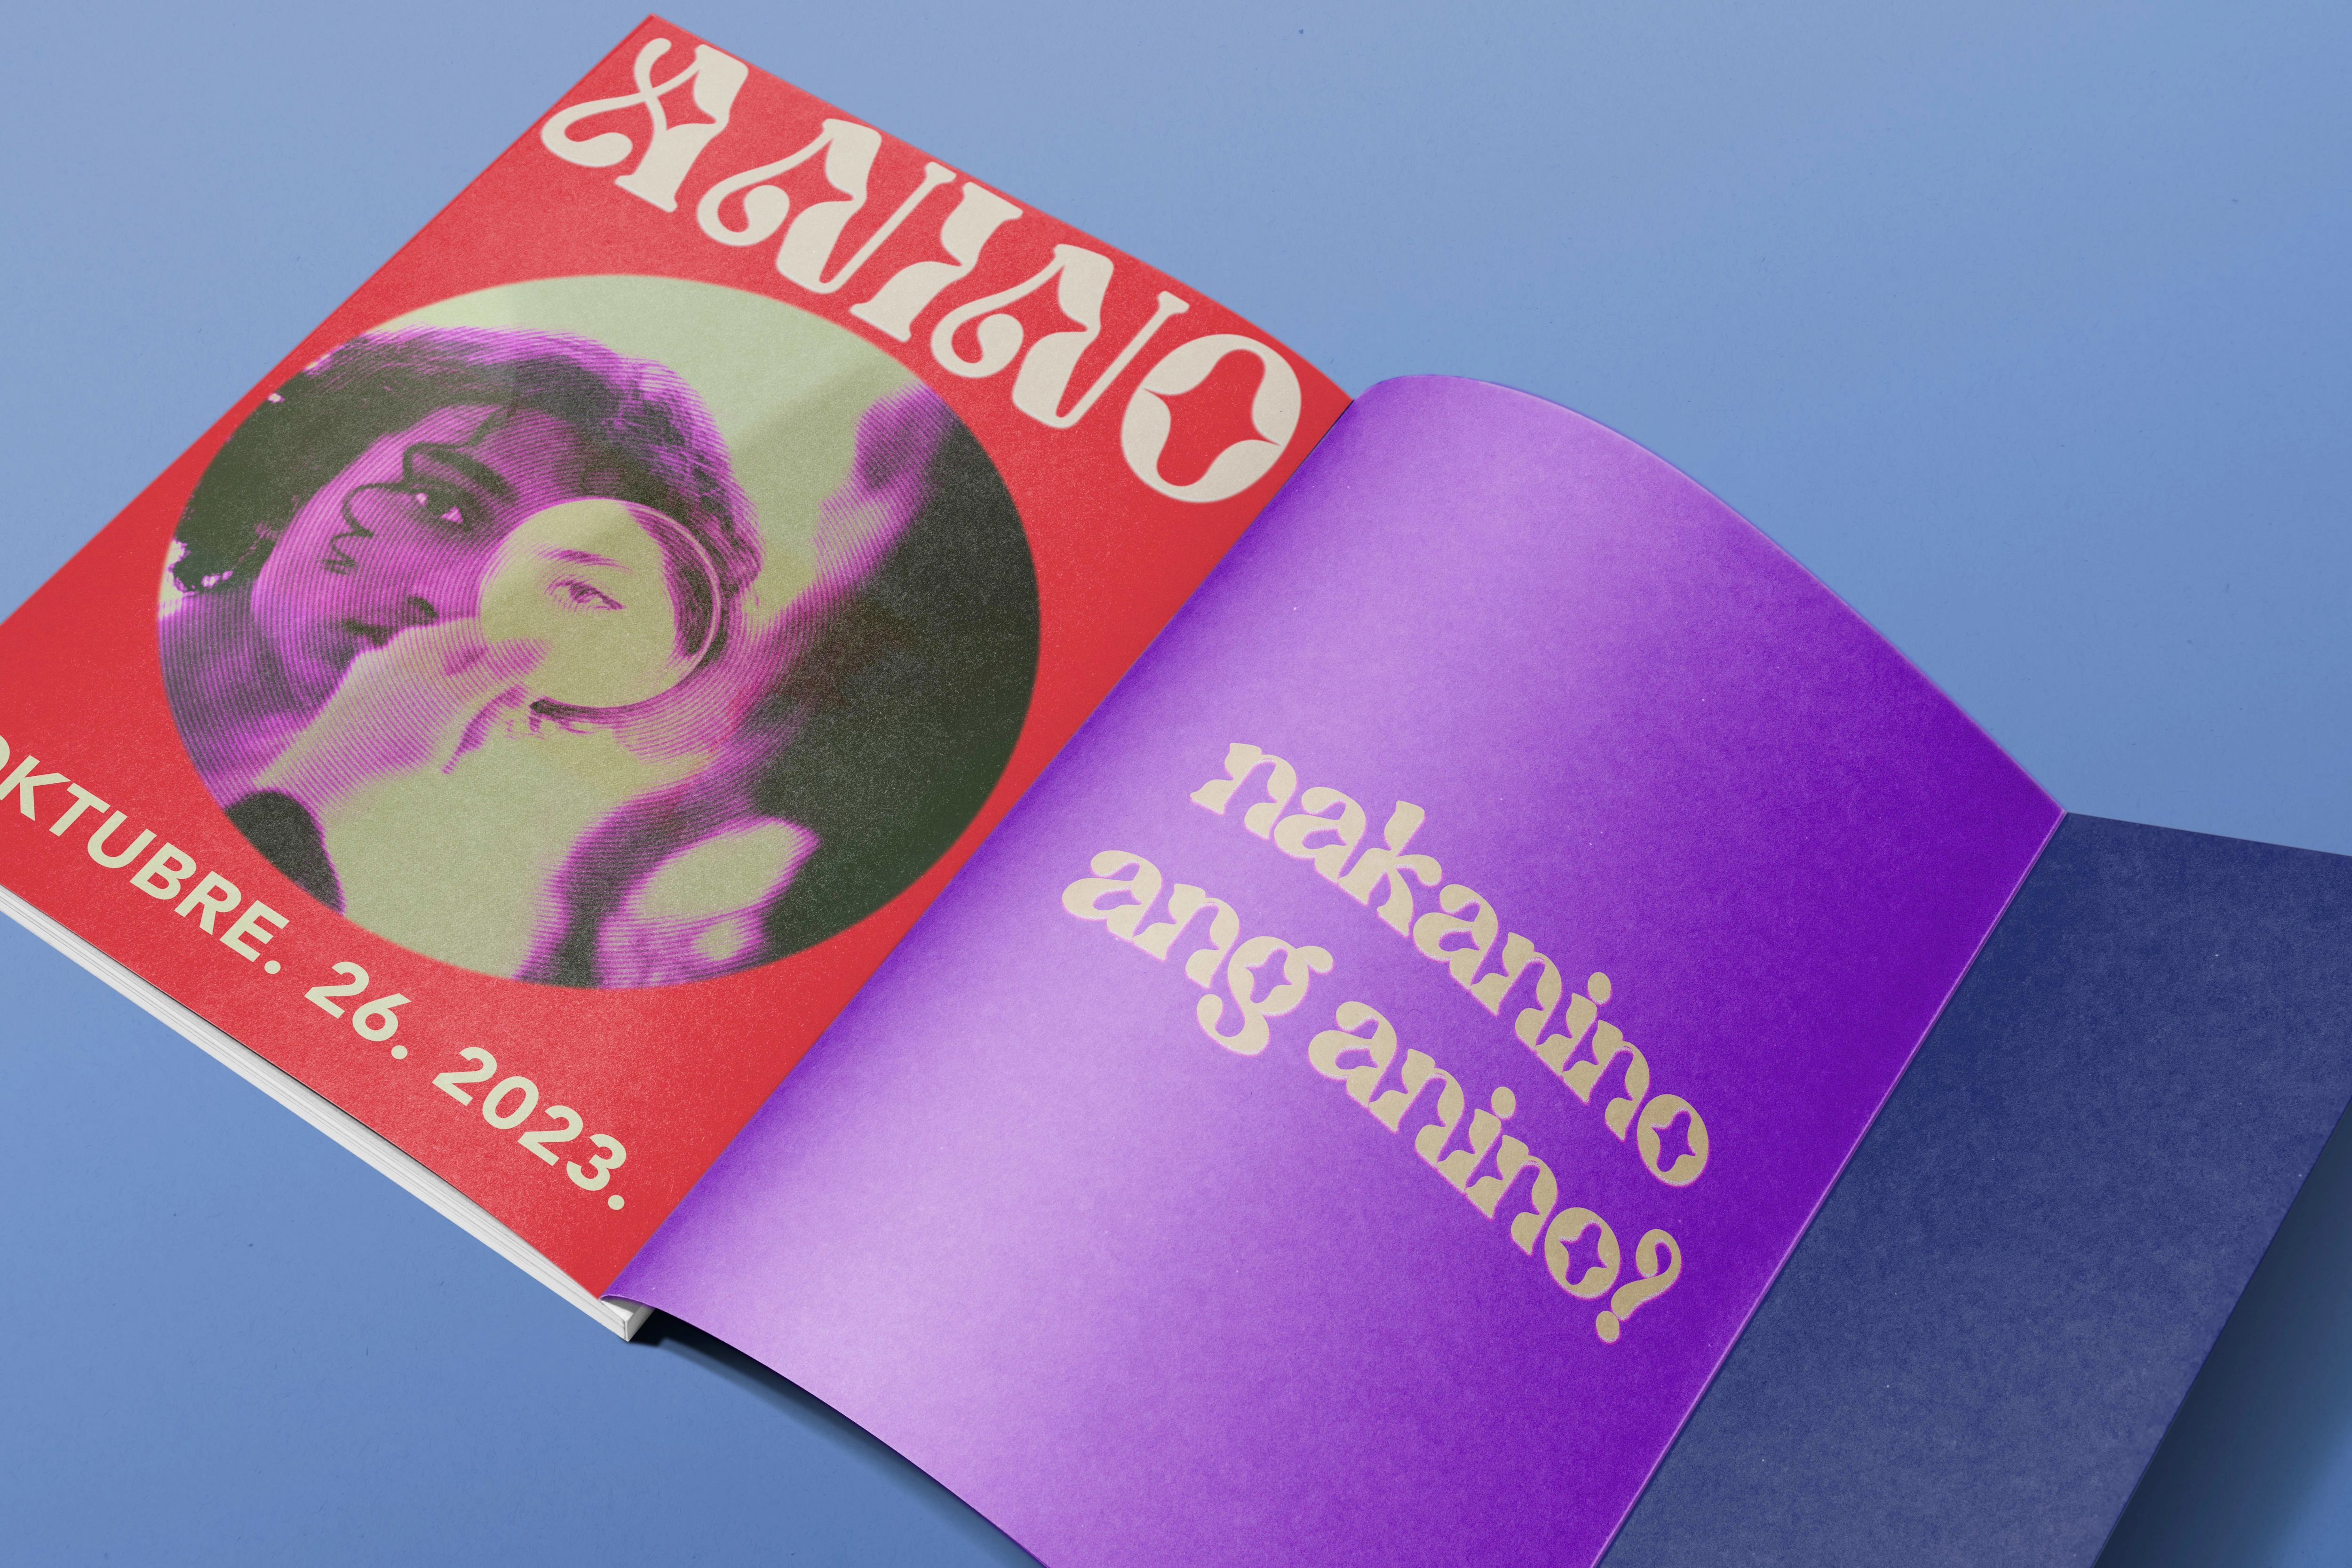
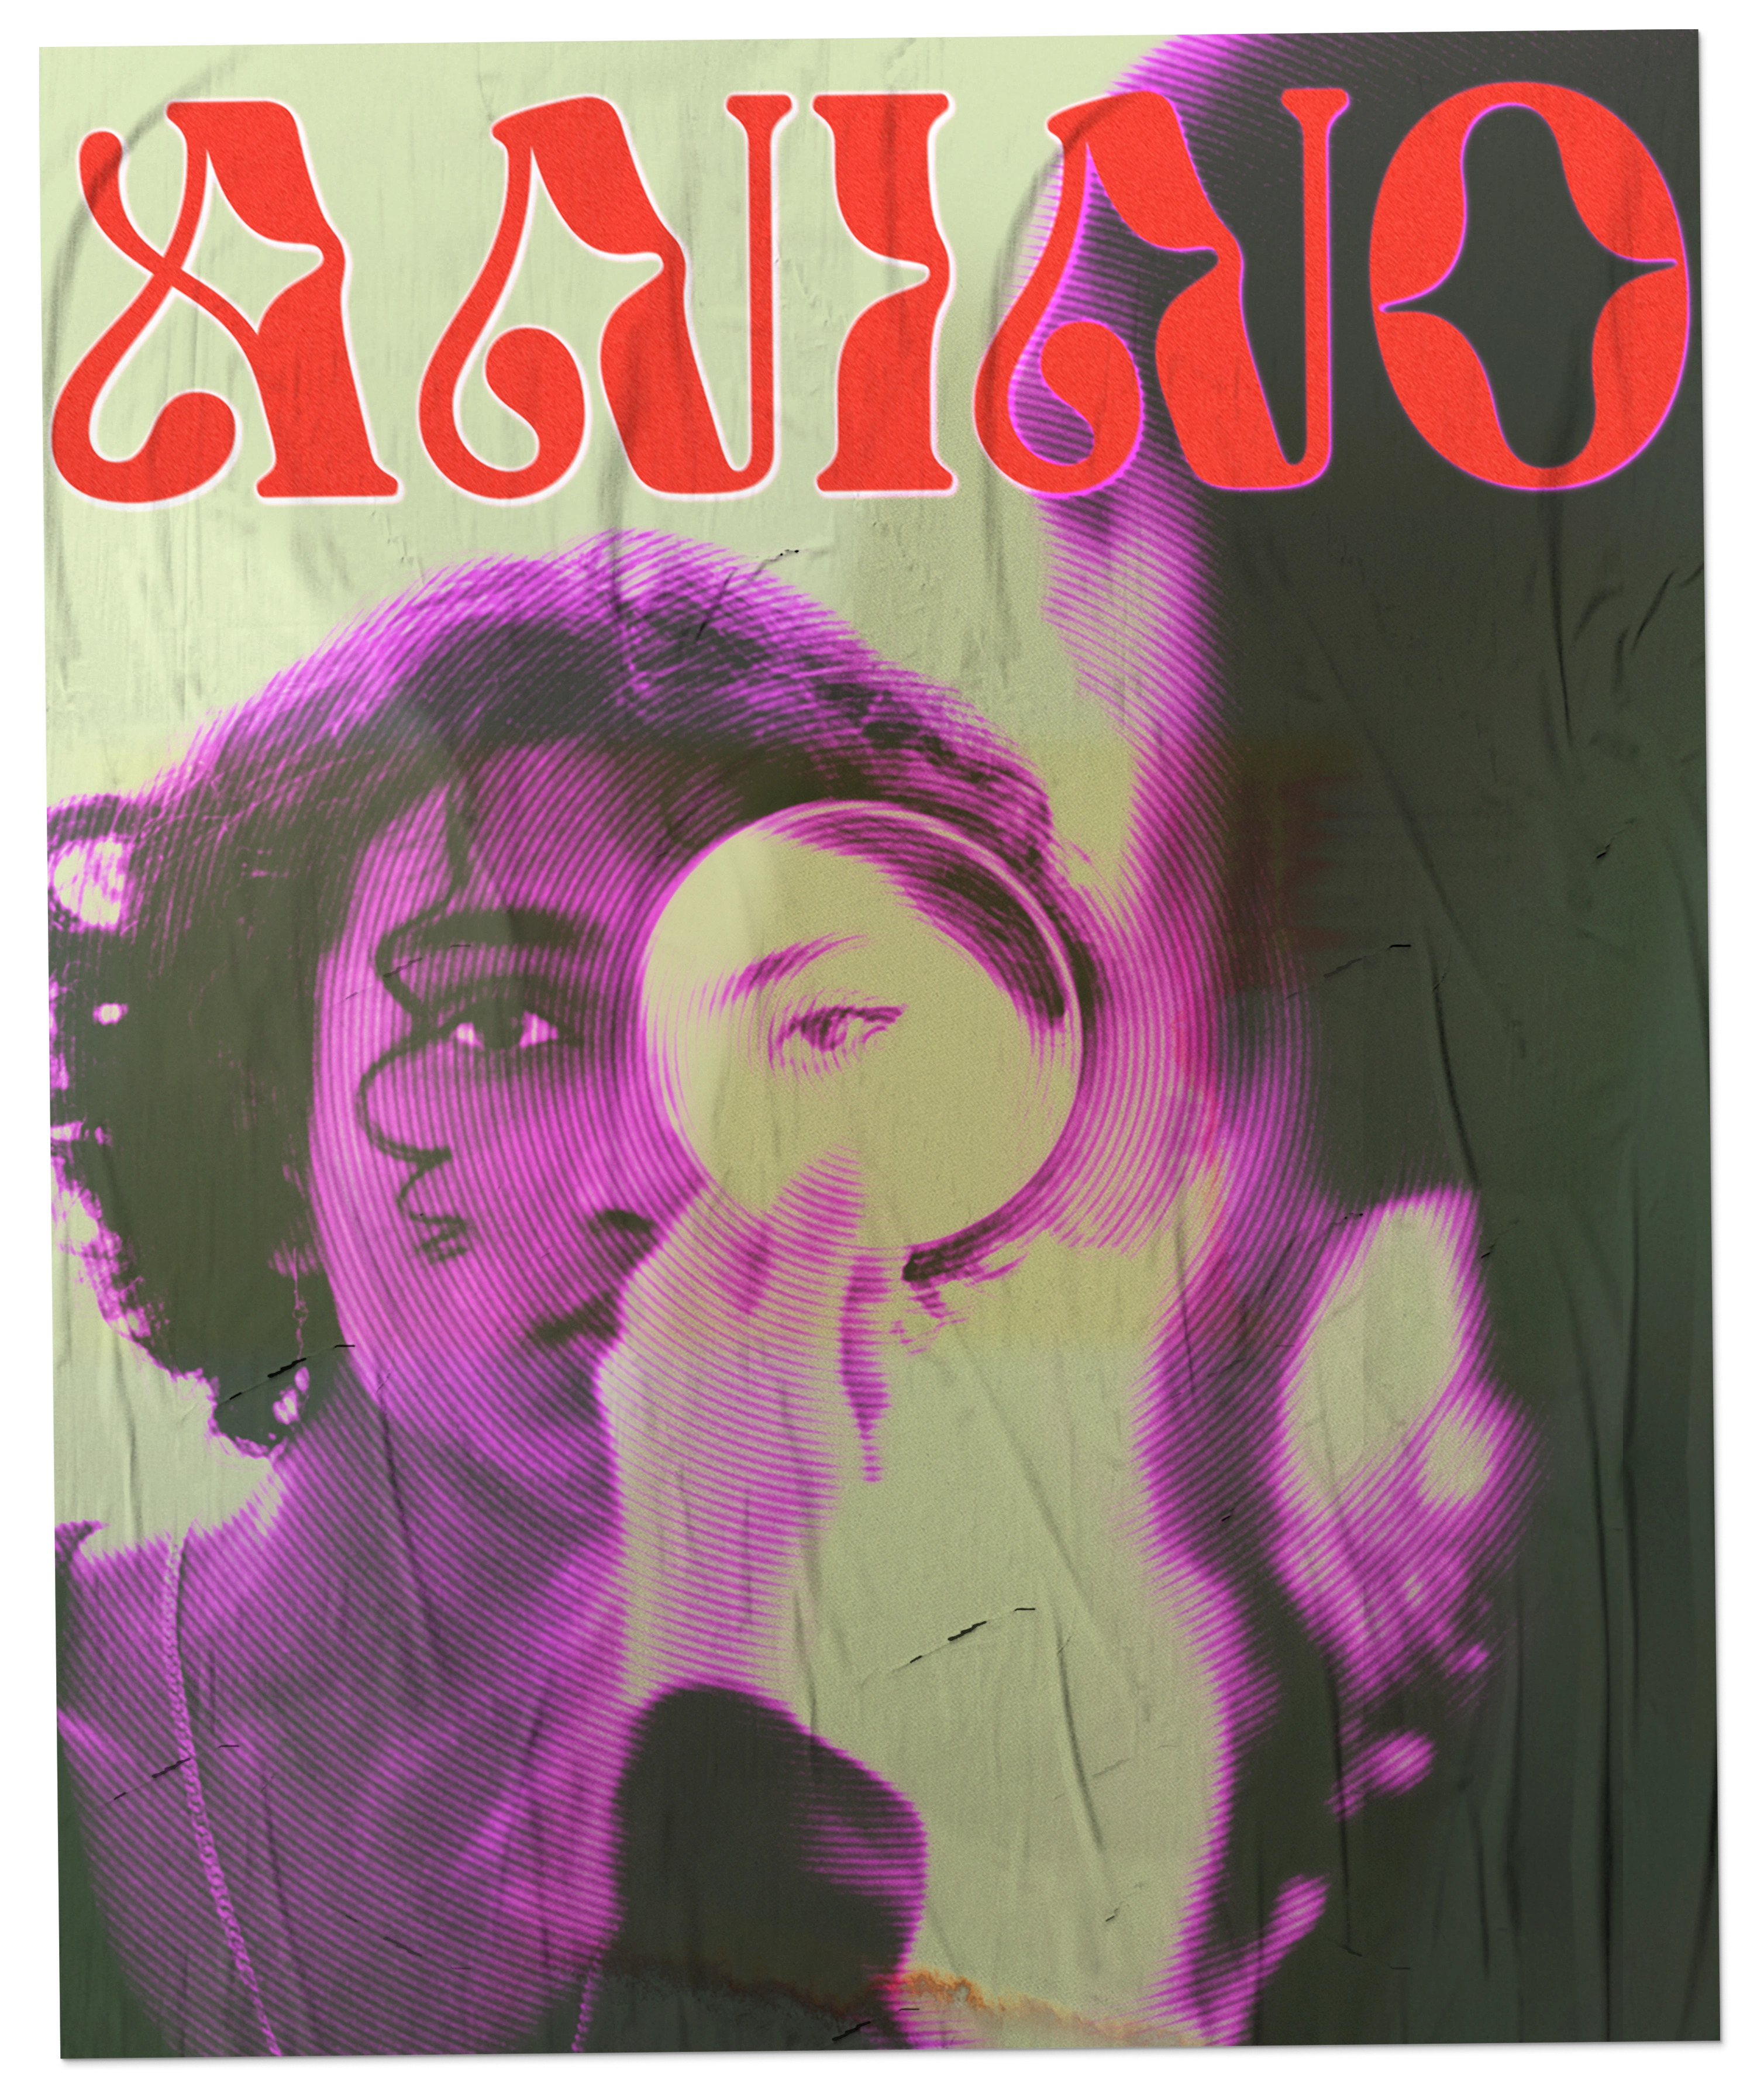
MOVIE POSTERS
Tools: Adobe Illustrator, Adobe Photoshop

Like this project
Posted Mar 24, 2023
.