Ontario Public Health Units COVID-19 Analysis
Deborah Afolarin
Ontario-Public-Health-Units-COVID-19-Analysis
📊 Practicum Project • SQL Server (Data Integration) • Python (Data Cleaning) • Excel (EDA) • Tableau (Data Visualization & Dashboard)
🔹 Project Background
Ontario’s Public Health Units (PHUs) experienced uneven COVID-19 case surges and vaccination uptake during the pandemic, influenced by geography, demographics, and socioeconomic conditions. Despite widespread vaccination campaigns, certain regions and age groups continued to face disproportionate infection rates and healthcare pressures. This raises critical questions about the effectiveness of vaccination programs, equity in health outcomes, and the ability to predict and manage future waves. Without a data-driven understanding of these patterns, resource allocation and policy responses risk being reactive rather than proactive.
This project integrates demographic, geographic, and temporal data to:
Identify high-risk regions and age cohorts
Evaluate the impact of vaccination coverage
Provide early warning indicators for healthcare system strain
Support equitable response planning across Ontario
An interactive Tableau dashboard used to report and explore ontario public health units covid-19 trends can be found here [link]
🔹 Data Structure & Initial Checks
Vaccination by Age & PHU — cumulative doses, population denominators
Cases by Status & PHU — active, resolved, deaths
Positive Case Records — detailed demographics, multiple date types
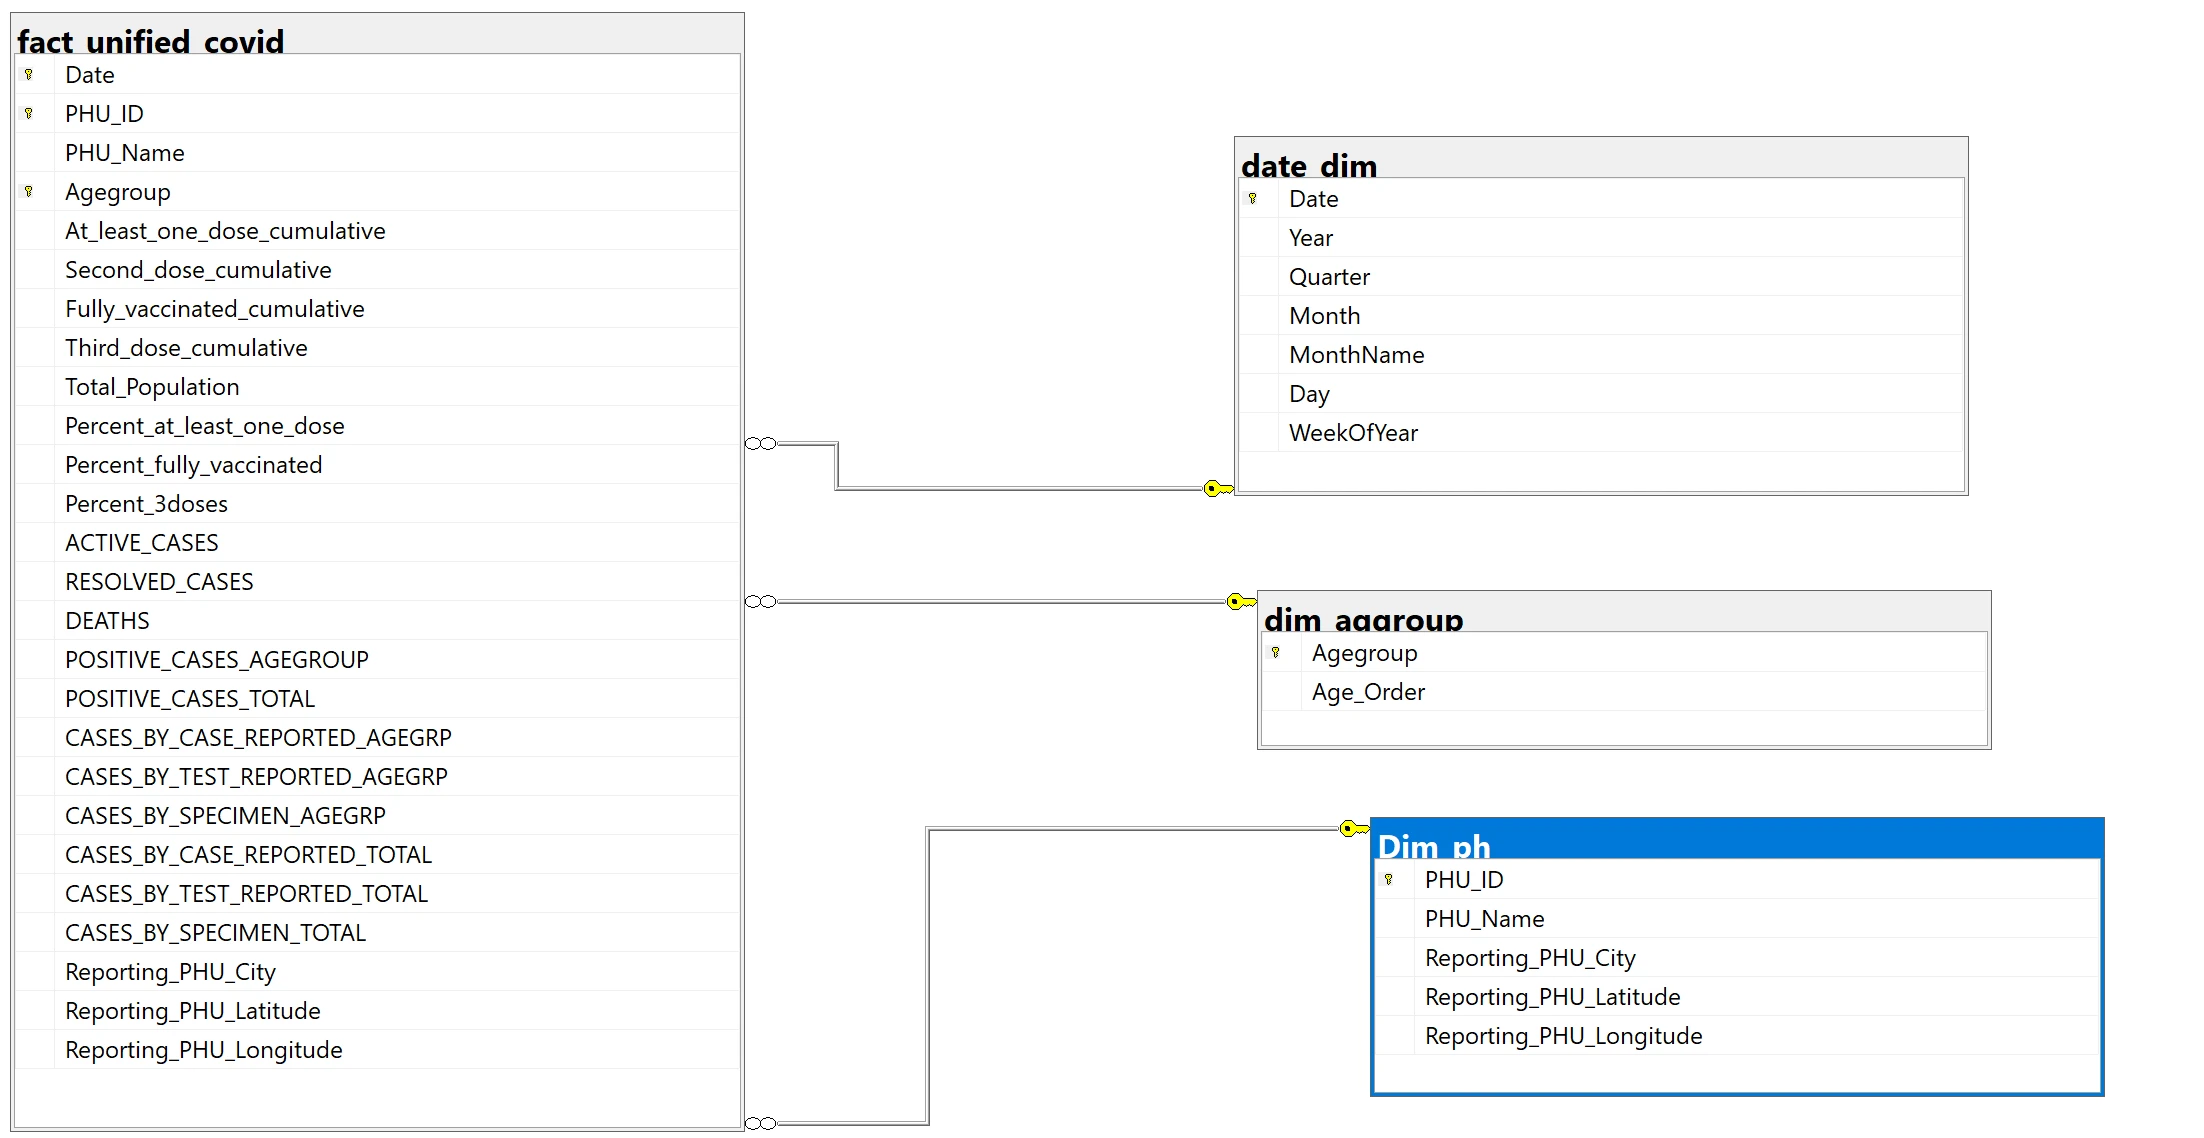
🔹 Integration Model (Star Schema)
Fact Table: Vaccination metrics, Status metrics, Individual case metrics
Dimensions: PHU, Age Group, Date
Multiple Date Types: Accurate Episode, Case Reported, Test Reported, Specimen
🔹 Key Metrics
New Cases: Difference between cumulative positive cases on the current date and the previous date.
Cases per 100k: Normalizes cases for fair PHU and agegroup comparison.
Vaccination Coverage: Computed from cumulative counts / population.
Active/Resolved/Deaths: PHU-level daily snapshots from case reports
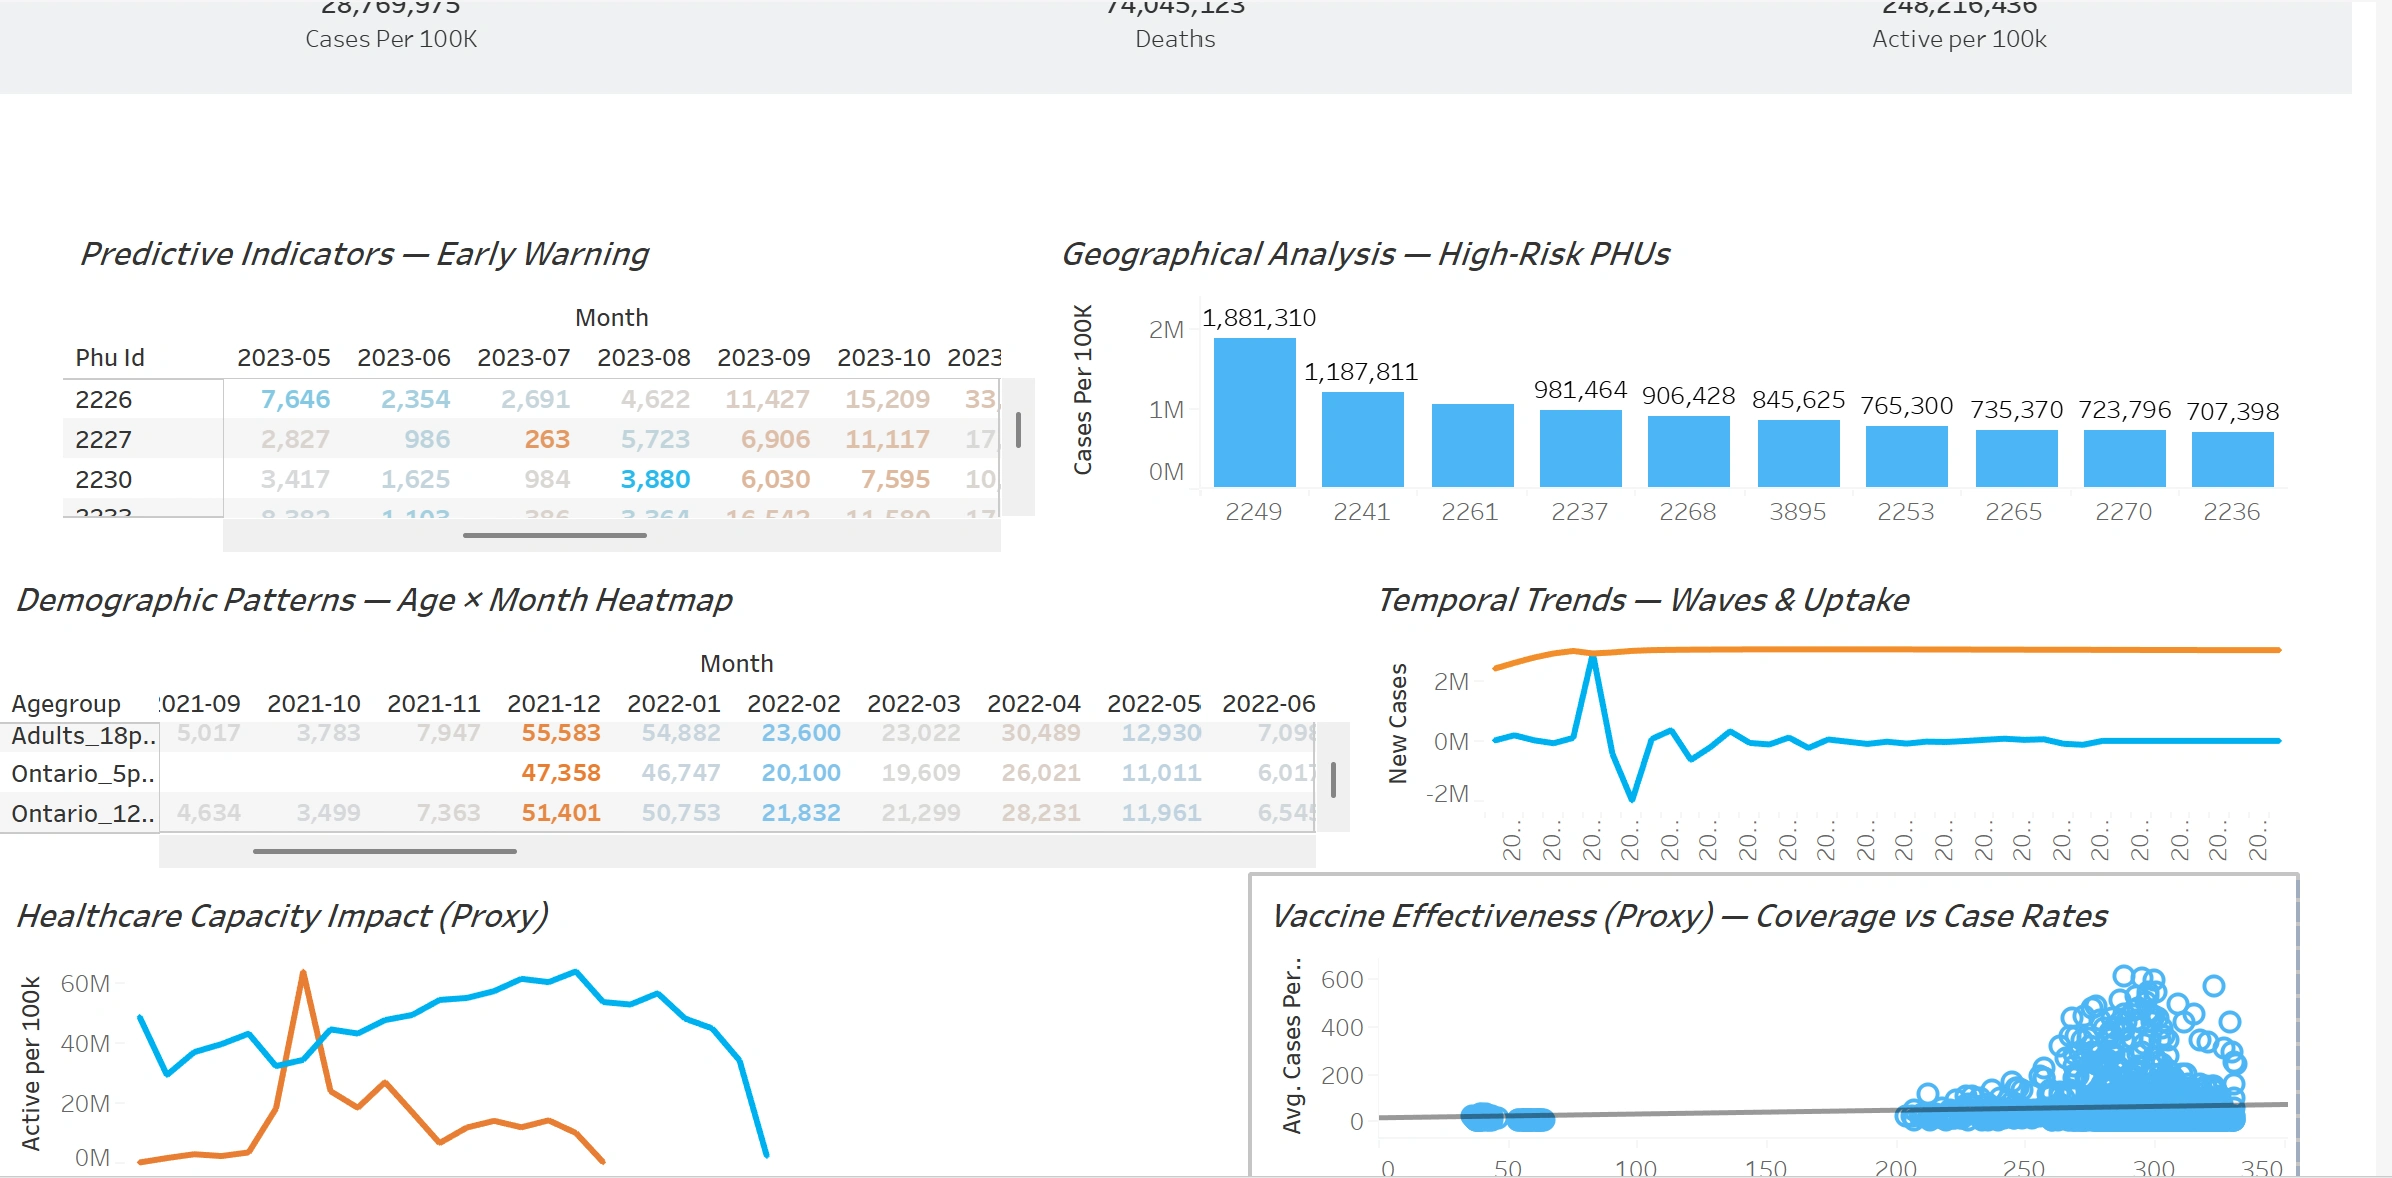
Predictive Indicators: Week-over-week case growth and spikes in PHUs, used as early warnings.
🔹 Methodology and Tools
SQL Server: Data integration → star schema fact table (
Date × PHU × Agegroup)Python (SQLAlchemy + Pandas): Cleaning (missing data, duplicates, outliers)
Excel: Exploratory Data Analysis (pivot tables, charts)
Tableau: Data Visualizations, interactive dashboard
🔹 Executive Summary
Overview of Findings Ontario’s Public Health Units (PHUs) showed uneven COVID-19 outcomes shaped by geography, demographics, and vaccination coverage. Three strategic insights emerged:
Certain PHUs consistently experienced higher case burdens, flagging them as hotspots for localized intervention.
Vaccination uptake and timing directly influenced wave intensity, with slower uptake preceding severe surges and increased coverage helping flatten later waves.
Healthcare capacity strain mirrored active case trends, underscoring the value of predictive monitoring and surge readiness.
🔹 Insights Deep Dive
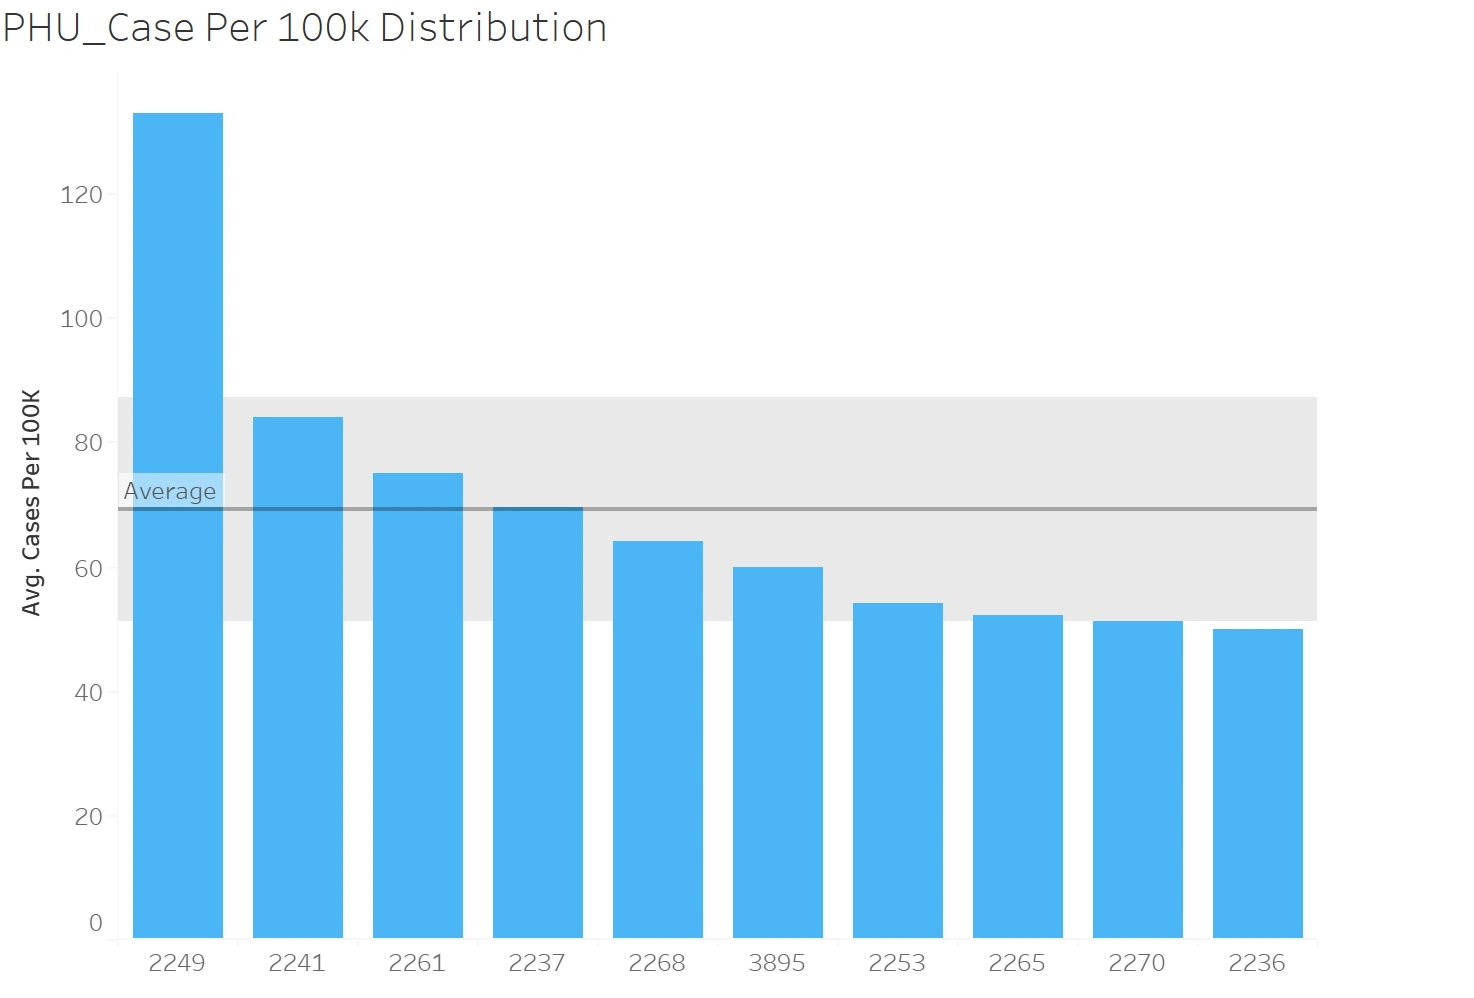
1. Geographical Hotspots
PHUs (2249, 2241, 2262) consistently landed above the provincial average in cases per 100k.
These PHUs consistently surfaced at the right tail of case distributions across waves, indicating persistent vulnerability.
Younger, more mobile populations (18–29 yrs) made up a larger share in these regions, and they were among the groups with consistently elevated incidence.
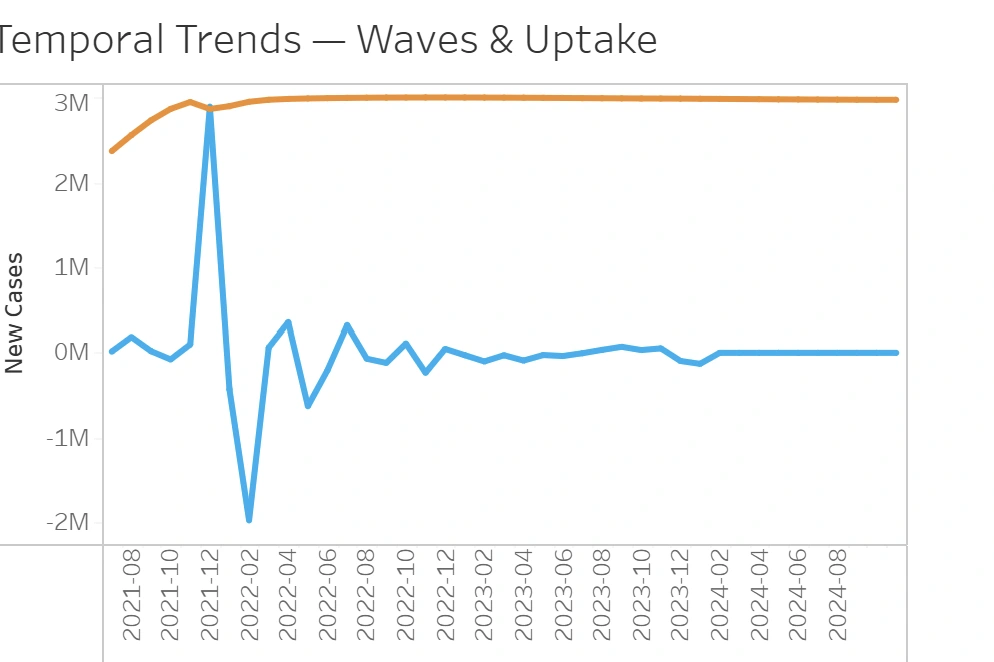
2. Temporal Waves vs. Vaccination Uptake
Case surges (Dec 2021–Feb 2022) coincided with sub-60% coverage in certain age groups
When vaccination campaigns ramped up, subsequent waves showed dampened peaks.
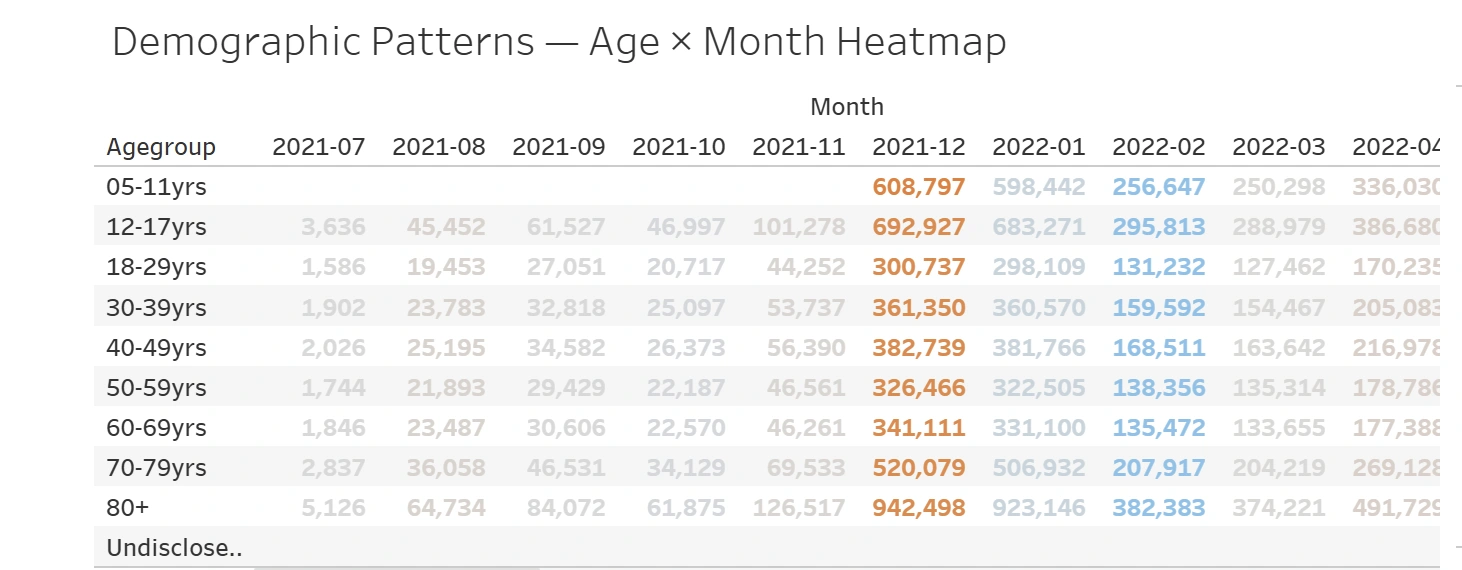
3. Demographic Disparities
Adolescents (12–17 yrs) and seniors (80+) peaked at 2.5× higher incidence during Omicron wave
These groups alternated as the highest-risk cohorts — youth in school/work clusters, seniors due to waning immunity.
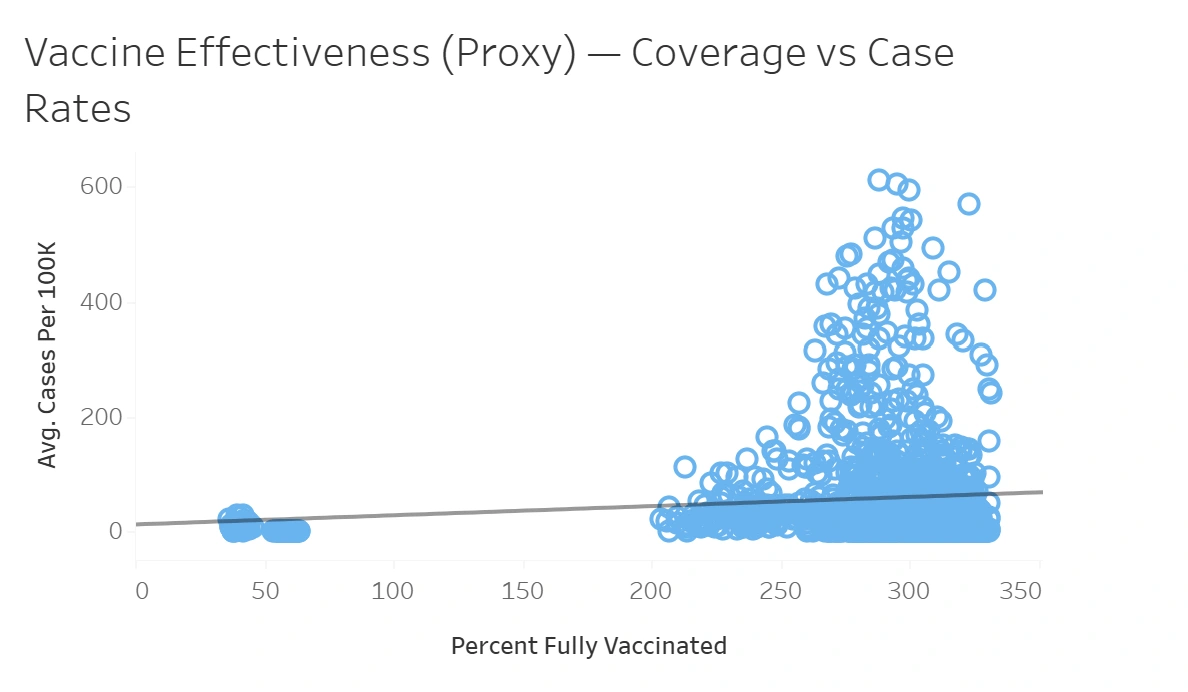
4. Vaccine Effectiveness
PHUs with >80% full coverage saw 40% lower average case rates
Clear negative correlation between coverage and incidence across all cohorts.
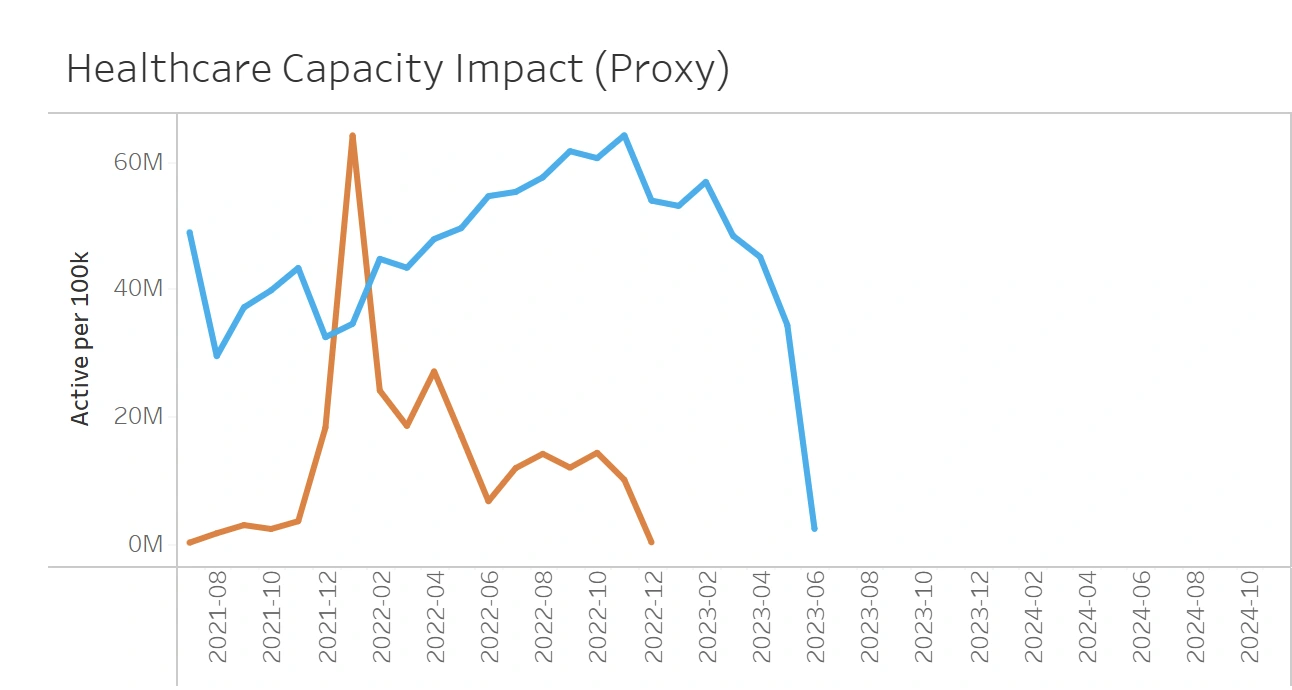
5. Healthcare Capacity Strain
Active cases peaked at >200,000 in Jan 2022, stressing provincial health systems
Hospital strain mirrored active case curves with a 1–2 week lag.
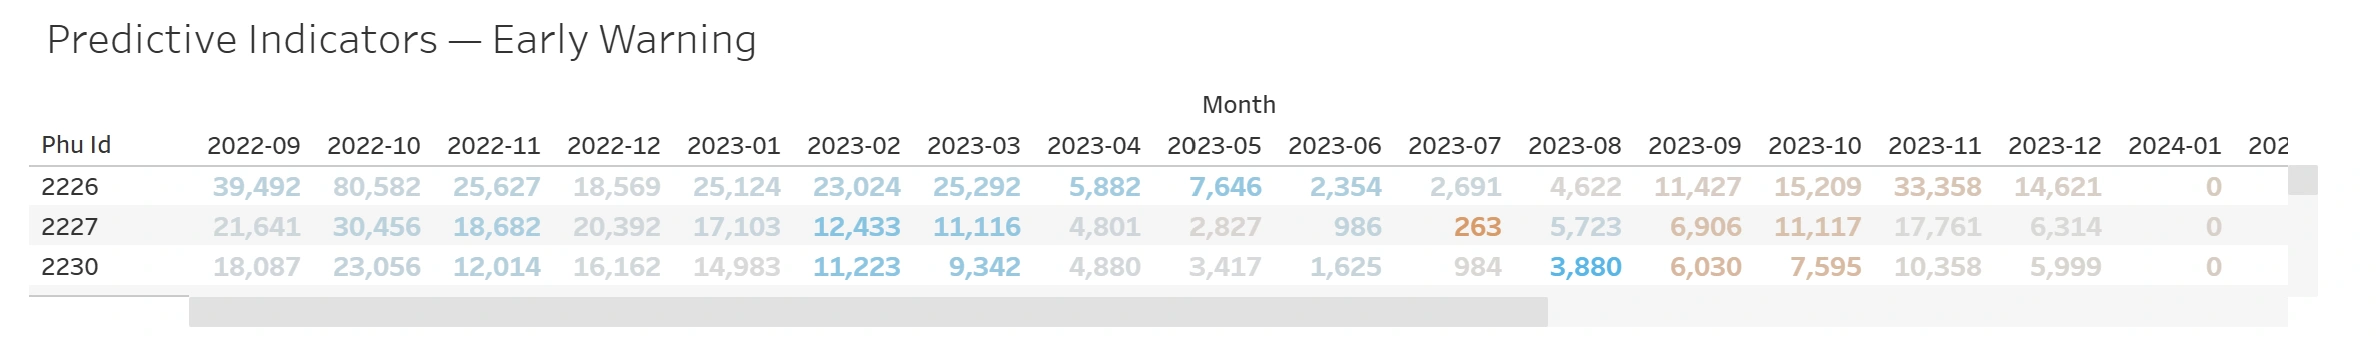
6. Predictive Indicators (Early Warnings)
PHUs 2226, 2227, 2230 spiked 2–3 weeks ahead of province-wide surges
These units acted as sentinel hotspots before waves spread broadly.
🔹 Recommendations
Based on the insights and findings above, we would recommend the Ontario Public Health Response Team to consider the following:
High-incidence PHUs (e.g., 2249, 2241, 2262) consistently showed cases per 100k above provincial averages. Deploy mobile vaccination/testing units and localized communication campaigns tailored to these hotspots.
Vaccination uptake lagged before major case surges, amplifying wave severity. Schedule vaccination drives 2–4 weeks in advance of predicted waves to preemptively boost immunity.
Adolescents (12–17) and seniors (80+) recorded 2.5 times higher incidence during Omicron. Implement school- and workplace-based vaccination outreach for youth, while reinforcing booster campaigns for elderly populations.
Active case peaks directly aligned with healthcare capacity strain. Establish surge readiness protocols (staff redeployment, supply pre-positioning) to anticipate system stress during steep case rises.
Early-spiking PHUs (2226, 2227, 2230) acted as sentinel indicators of province-wide surges. Integrate predictive surveillance dashboards that monitor these PHUs and trigger early surge alerts.
🔹 Assumptions and Caveats
Throughout the analysis, multiple assumptions were made to manage challenges with the data. These assumptions and caveats are noted below:
Assumption 1(Missing or null PHU_ID and Agegroup records were excluded from the analysis to preserve integrity, as re-coding could introduce bias)
Assumption 2(Missing vaccination counts for certain PHUs were forward-filled using the most recent available data point to maintain continuity in coverage calculations)
Assumption 3(Inconsistent date fields (Accurate Episode vs. Reported Date vs. Specimen Date) were resolved by prioritizing Accurate Episode Date as the most reliable representation of onset)
Assumption 4(Negative or implausible cumulative case counts were treated as reporting errors and corrected to zero)
Like this project
Posted Aug 28, 2025
Analyzed COVID-19 trends in Ontario PHUs using data integration and visualization tools.
Likes
0
Views
5
Timeline
Nov 30, 2021 - Feb 27, 2022