Theft incident visualization heat map
Vasiliy Kuzmenko
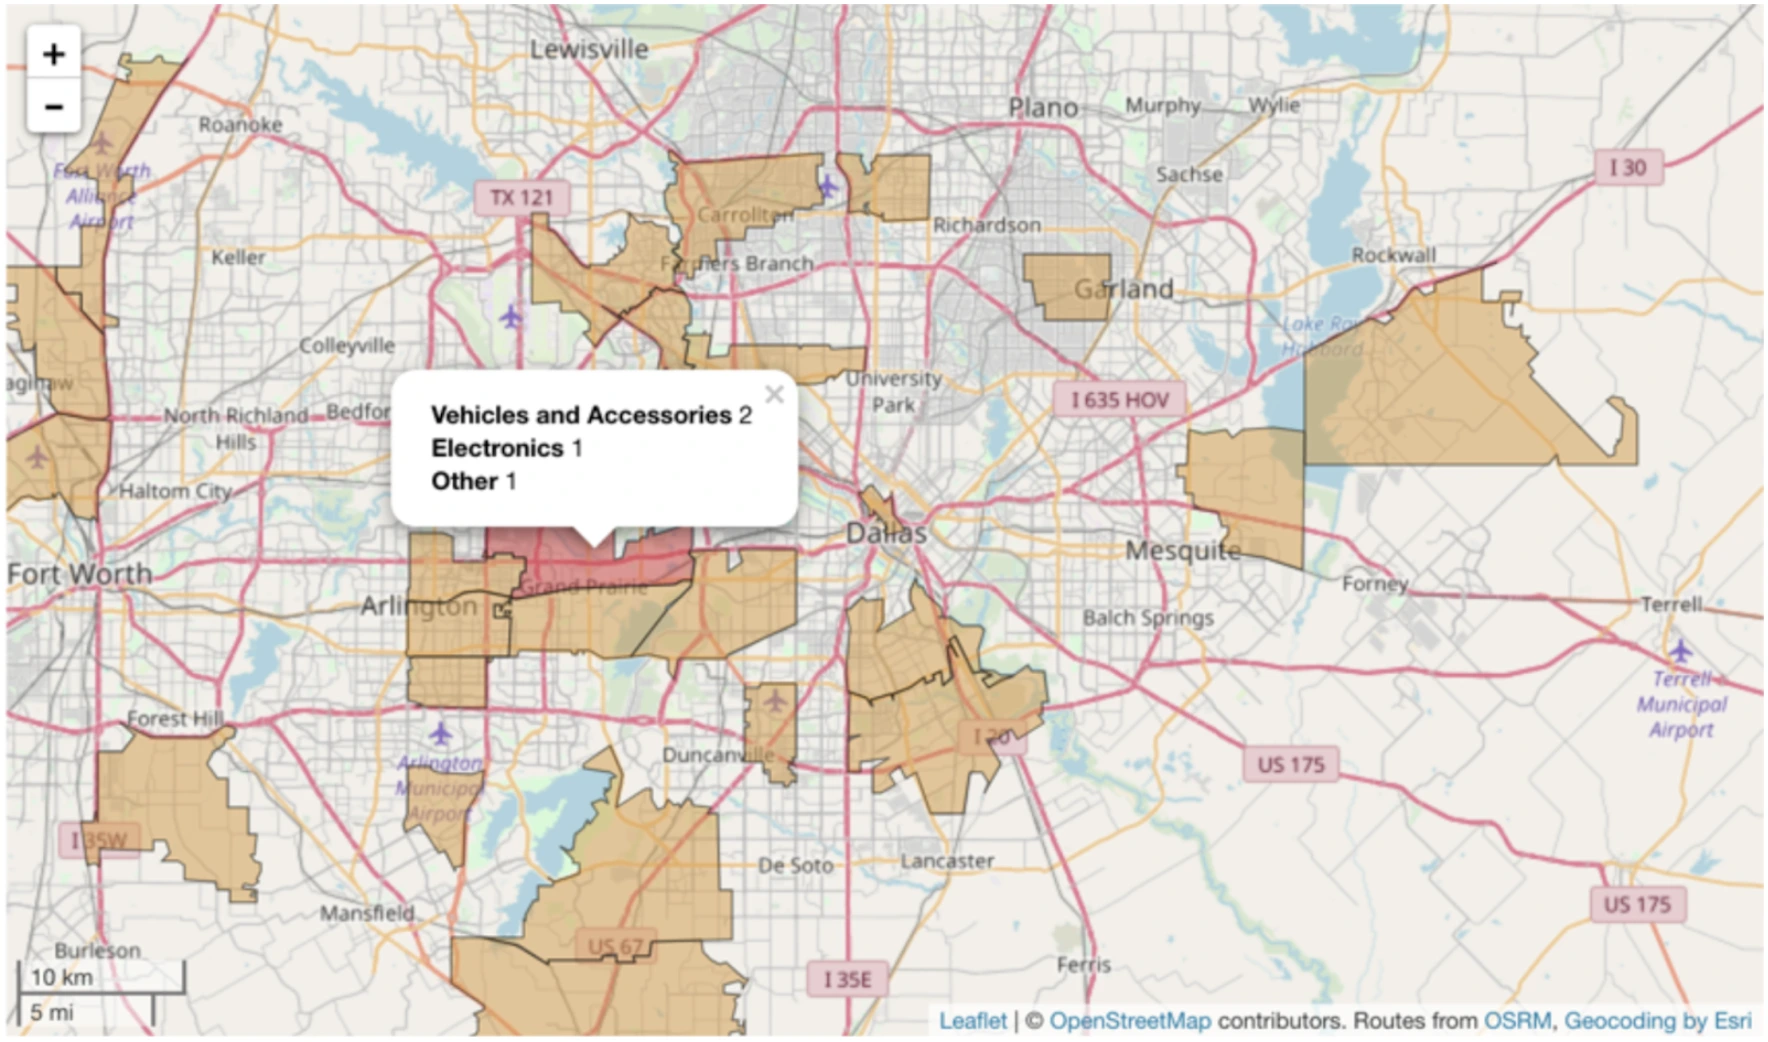
An interactive heat map that visualizes the number of incidents across different zip code areas. The intensity of the color represents the volume of incidents in each zone. When a user clicks on a specific area, a popup displays a categorized list of incidents that occurred there.
Like this project
Posted Aug 6, 2025
Visualize transformed data from source about incidents on map divided by incident category and zip codes.
Likes
0
Views
20