Innovation Intelligence Dashboard

View completed worktrakintel.ai

Innovation Intelligence Dashboard
Dashboard for corporate innovation teams: fast search, filters, and charts over millions of records.
Trakintel helps corporations discover growth opportunities by tracking innovation signals: technology news, patents, research papers, and startup data from across the globe. I built both the frontend dashboard and backend API infrastructure.

enterprise.trakintel.ai - Homepage
What Made This Hard
Millions of records, sub-second queries. The web scraper pulls roughly 10,000 articles daily. With millions of historical records in MongoDB, users still expect instant search results and complex filtering. The database alone couldn't deliver that performance.
Complex visualizations over massive datasets. Corporate innovation teams need charts showing technology trends, patent landscapes, startup ecosystems, and competitive intelligence. Each visualization aggregates thousands or millions of data points while staying interactive.
AI enrichment from an external service. Another team's AI service categorizes content, generates summaries, and identifies trends. I needed to integrate their endpoints, validate data quality, and incorporate the enriched data into search and visualizations.
How I Built It
The key was a multi-layer caching strategy. Redis stores pre-aggregated statistics, frequently accessed datasets, and query results. When users search or filter, the system checks Redis first before hitting MongoDB. Query times dropped from seconds to milliseconds.
I designed MongoDB indexes specifically for common query patterns: industry, technology category, date ranges, and source types. Background aggregation pipelines calculate complex statistics and cache results in Redis for instant retrieval.
The frontend uses Next.js and Material-UI. The filtering system lets users search millions of records by industry vertical, technology category, innovation type, geographic region, and custom date ranges. Virtual scrolling and progressive loading keep the UI responsive with large result sets.
For AI integration, I built endpoints to receive categorized content and trend identifications from the external service. The pipeline validates responses, stores enriched data in MongoDB, and surfaces it through search and visualizations.
Authentication supports both email/password and enterprise SSO. Multi-tenant architecture ensures complete data isolation between corporate clients.
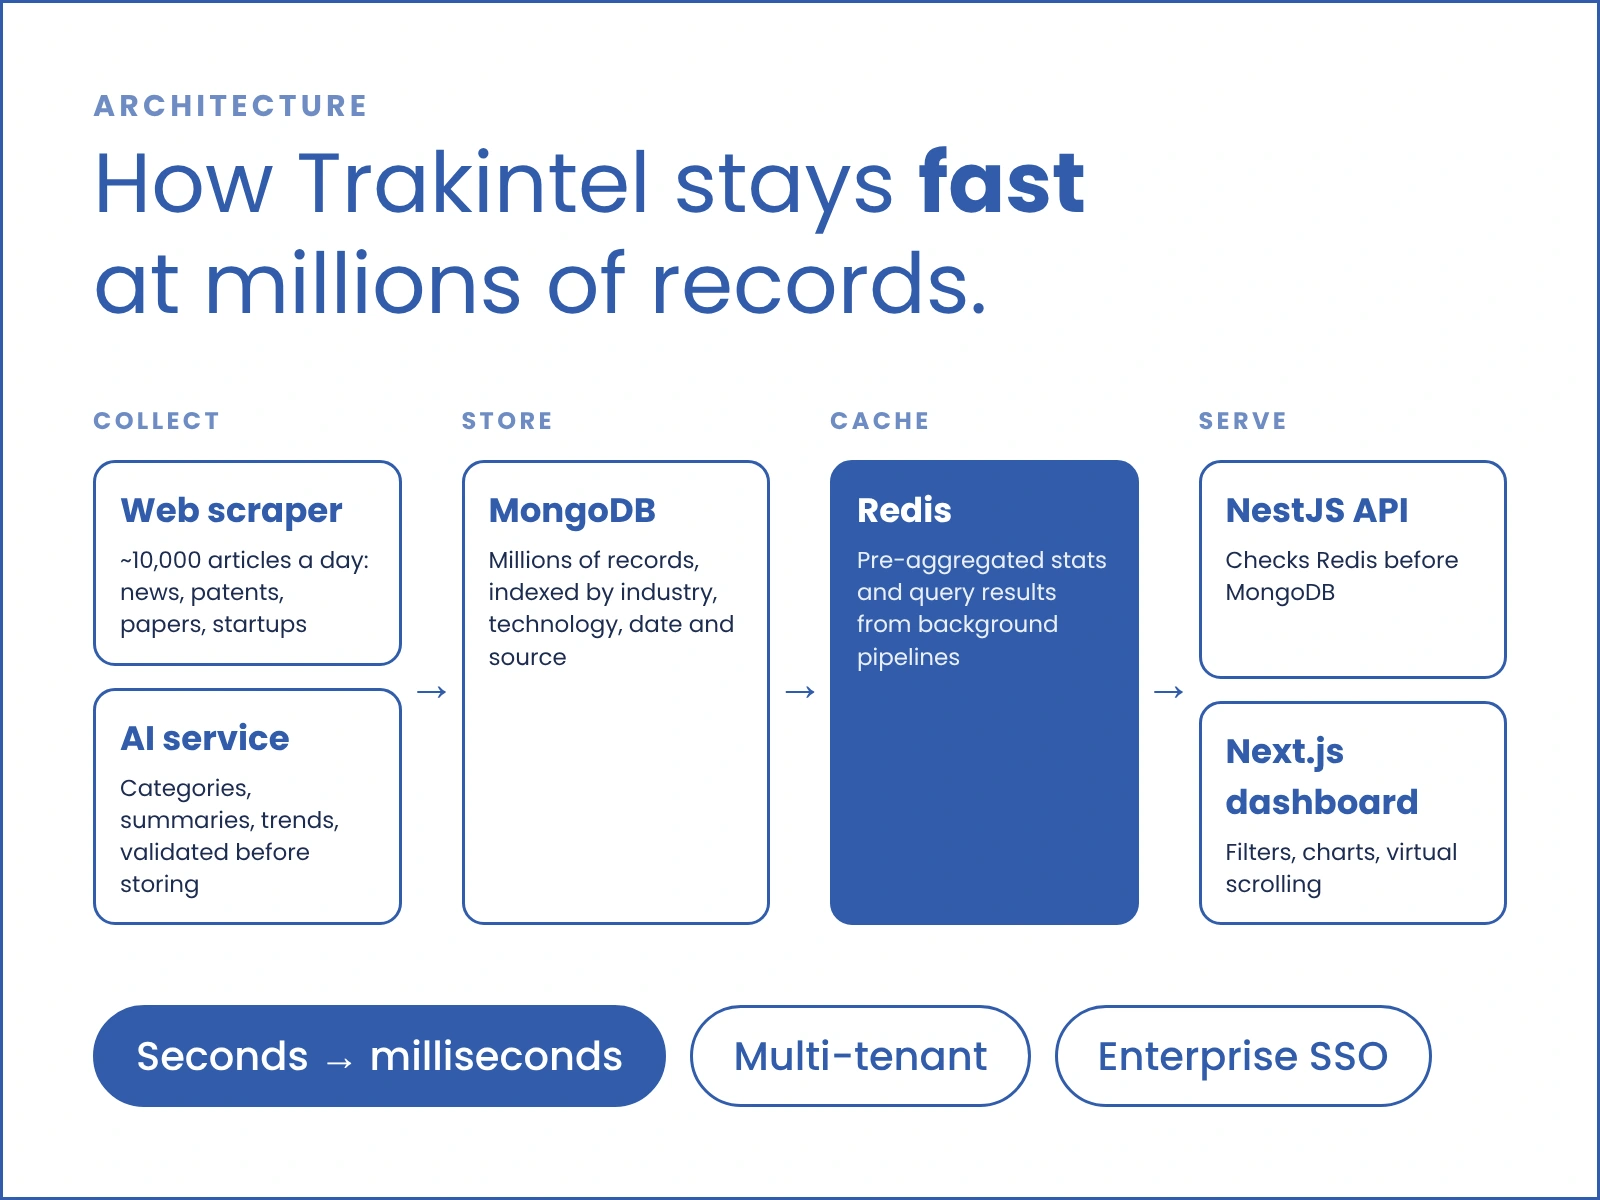
Architecture: Redis caches what MongoDB stores, so queries return in milliseconds.
Results
Redis caching delivers sub-second queries across millions of records
Background aggregation pre-calculates statistics, so dashboards load instantly
Each corporate client's data is fully separated from the others
New data sources and chart types plug in without reworking the core
Tech Stack
Frontend: Next.js, Material UI (MUI), TypeScript
Backend: NestJS, Node.js
Database: MongoDB, Redis
AI Integration: Custom API integration with an external AI service
Deployment: Ubuntu, Nginx, Docker
Link
Have a dashboard that’s slowing down as your data grows? I’m happy to take a look.
1 like · 48 views · Jan 25, 2026
Dashboard for corporate innovation teams. Built Redis caching and MongoDB indexing for sub-second queries across millions of daily records.