Data Science and Bioinformatics

Oluwasegun Daramola


Like this project
Posted Jun 15, 2024
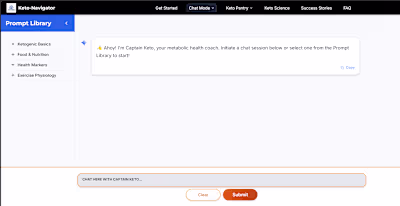
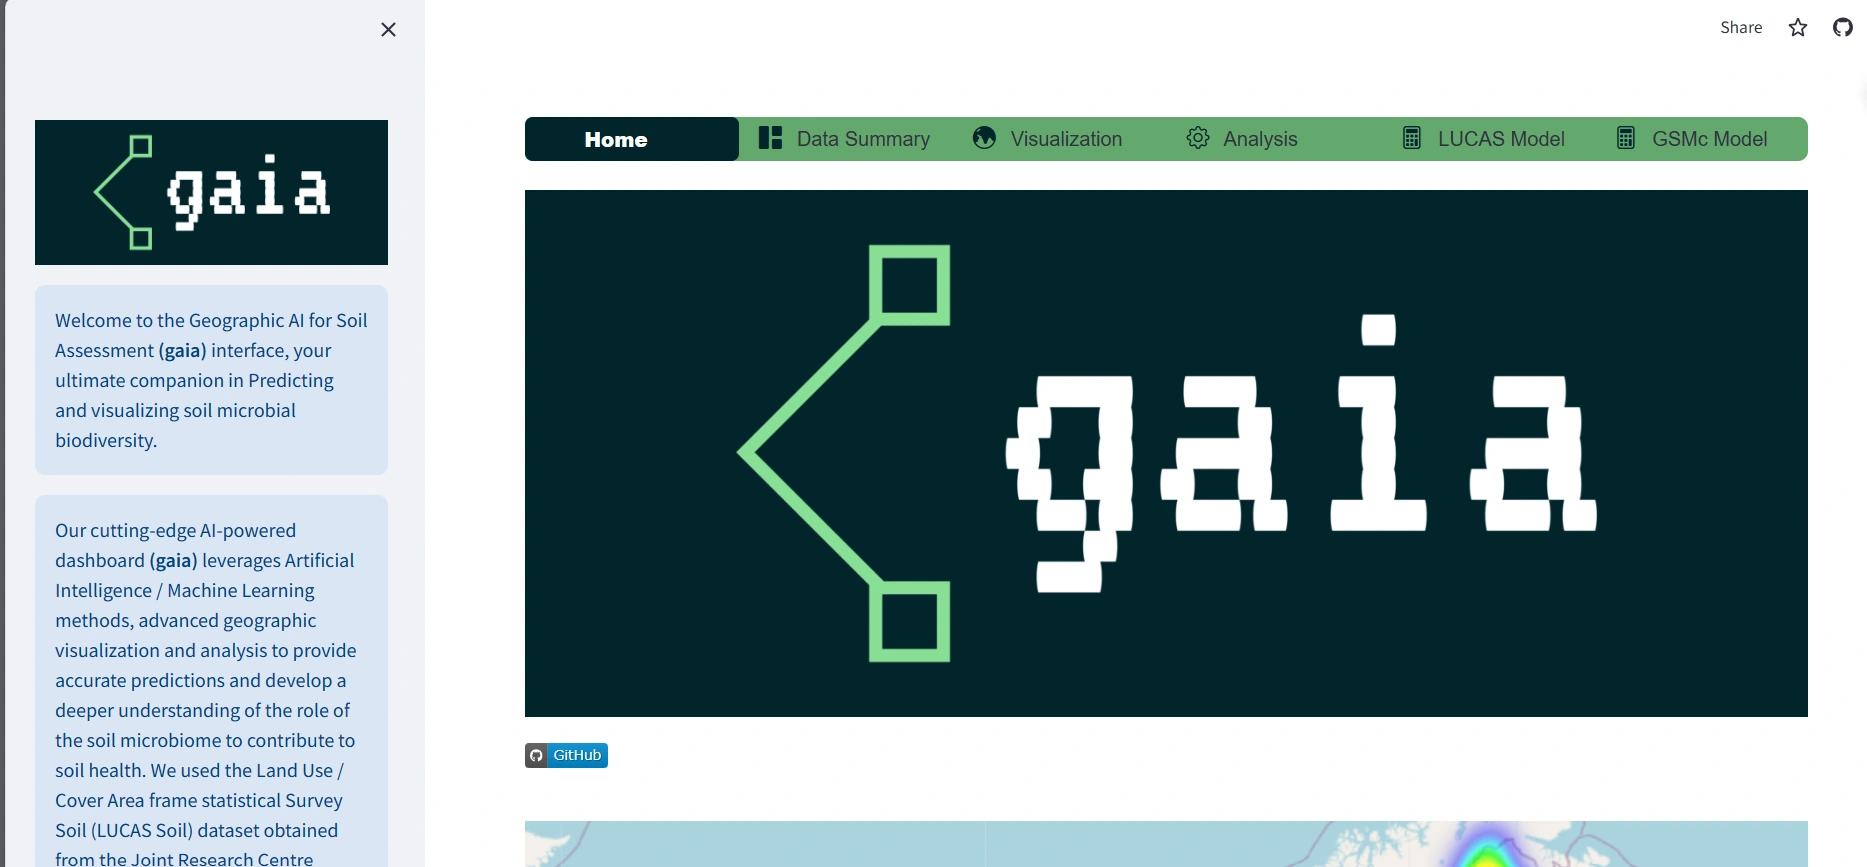
To visualize geographical distributions of features and predictions as well as visualizations that provide informative summaries of the model data.
Likes
0
Views
4


streamlit
streamlit-option-menu
pandas
numpy
scikit-learn==1.2.2
joblib
catboost
plotly
Create Directories for Analysis Create two new directories: one for bacteria analysis and another for fungi analysis.
Organize Relevant Files Move all relevant files to their respective directories. Ensure that reference files from the respective databases (SILVA 138 for bacteria and UNITE QIIME release version 9.0 for fungi) are saved in their respective folders.
Download Files In each directory, use the following command to download the files specified in the _download_links.txt:
Create Manifest Files Use the provided manifest.sh files to generate the manifest files required for Qiime2 import.
Run Analysis Scripts Navigate to each directory and execute the analysis.sh files. Before running, review the content of these files to ensure that all necessary files are accounted for and modify the scripts as needed to suit your specific analysis requirements.