REST API Performance Testing & Optimization

Faisal Iqbal


REST API Performance Testing & Bottleneck Analysis
I built this performance engineering project to evaluate REST API behavior under load, identify performance bottlenecks, and validate the impact of an optimized implementation using Apache JMeter.
Rather than treating performance testing as a simple response-time check, I structured the project around a repeatable engineering workflow: establish a baseline, apply controlled load, analyze endpoint behavior and runtime characteristics, compare implementations, and preserve the execution evidence for review.
The project demonstrates parameterized API load testing, assertions, bottleneck analysis, comparative performance testing, automated result analysis, and CI-based execution.
Project Overview
The test environment uses a controlled REST API so performance behavior can be reproduced and analyzed without depending on an external production system. Apache JMeter drives the workload, while raw execution results and generated reports provide the evidence used for performance analysis.
A key part of the project is comparing the original API behavior with an optimized worker-based implementation. This makes it possible to evaluate not only whether performance changed, but also how the change affected response behavior, throughput, and system resource characteristics.
Testing: REST API performance and load testing
Tool: Apache JMeter
Approach: Baseline → bottleneck analysis → optimization → validation
Coverage: Parameterized API scenarios with functional assertions
Analysis: Response time, throughput, errors, and runtime behavior
Automation: Reproducible execution and CI validation
The Challenge
Performance problems in an API are not always caused by the endpoint that appears slow. Under concurrent load, CPU-intensive processing can affect the responsiveness of other requests and create system-wide degradation that is difficult to identify from individual response times alone.
The objective of this project was to create a controlled workload that could expose this behavior, establish a repeatable performance baseline, and determine how CPU-intensive processing affected the API under concurrent traffic.
The next objective was to evaluate an alternative worker-based implementation under the same workload. Keeping the workload consistent made it possible to compare the two implementations using measured results rather than relying on isolated observations.
Establish a repeatable baseline under controlled load
Exercise multiple API operations within the same workload
Include CPU-intensive processing to expose contention under concurrency
Validate responses with assertions instead of measuring invalid requests
Preserve raw execution evidence for deeper analysis
Compare the baseline and worker-based implementations under equivalent conditions
Evaluate performance improvement and runtime/resource trade-offs
Performance Test Strategy & Workload Design
I designed the JMeter test plan to generate a repeatable workload across several API operations rather than measuring a single endpoint in isolation. This allowed the test to represent concurrent API activity while deliberately introducing CPU-intensive processing to observe its impact on the wider application.
Shared request configuration is centralized through HTTP Request Defaults, while CSV Data Set Config provides parameterized test inputs. Assertions validate response codes and response content so that performance measurements are collected only alongside functional validation.
The same workload design is used when evaluating the baseline and worker-based implementations. Keeping the test conditions consistent is essential because differences in the measured results should come from the implementation being evaluated rather than from changes to the workload itself.
HTTP Request Defaults — Centralized API host and request configuration
CSV Data Set Config — Parameterized test data for repeatable execution
Multiple API operations — Exercises different application paths within the workload
CPU-intensive request — Deliberately introduces processing pressure
Response assertions — Validates expected behavior during performance execution
Raw JTL results — Preserves sampler-level execution evidence
Consistent workload — Enables meaningful baseline-versus-optimized comparison
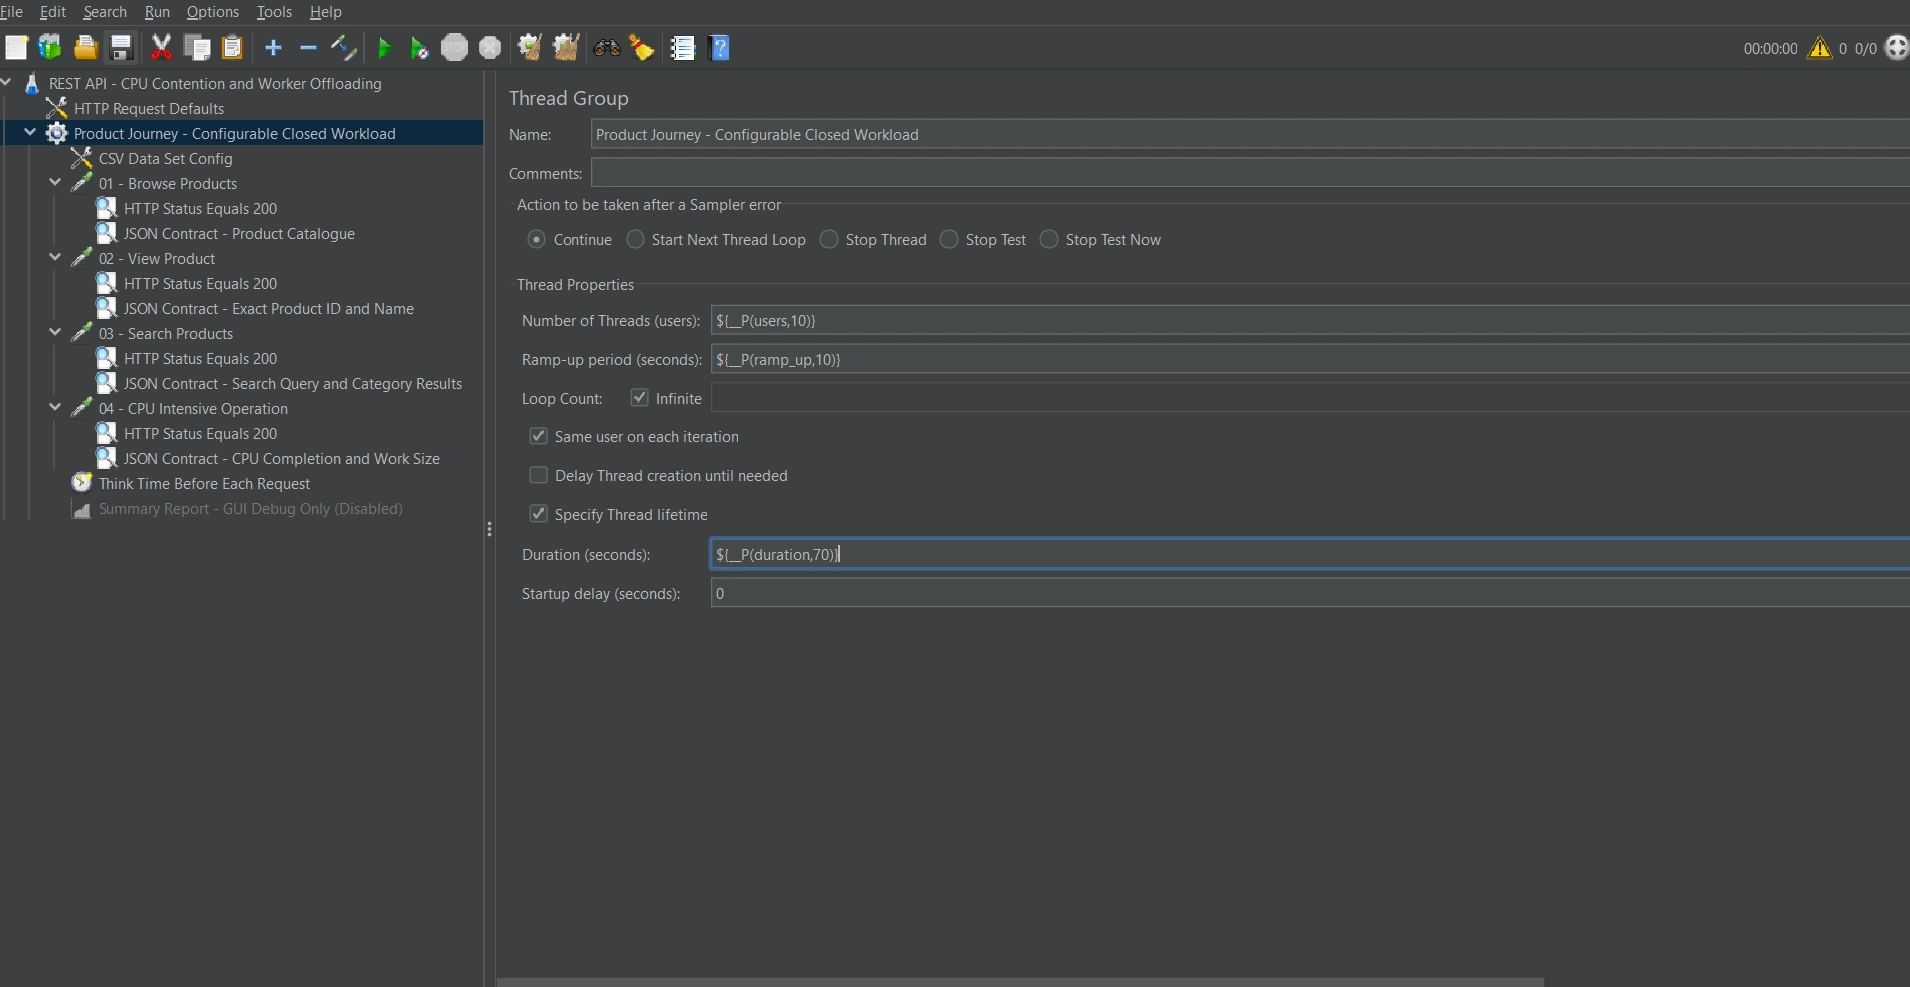
Configurable JMeter workload for the product journey, combining parameterized concurrency and duration with multiple REST API operations, CPU-intensive processing, think time, and response-contract assertions.
Controlled Performance Comparison
To validate the bottleneck and the proposed optimization, I executed three baseline runs and three worker-based runs under equivalent workload conditions. Results were pooled across repetitions to reduce reliance on a single execution.
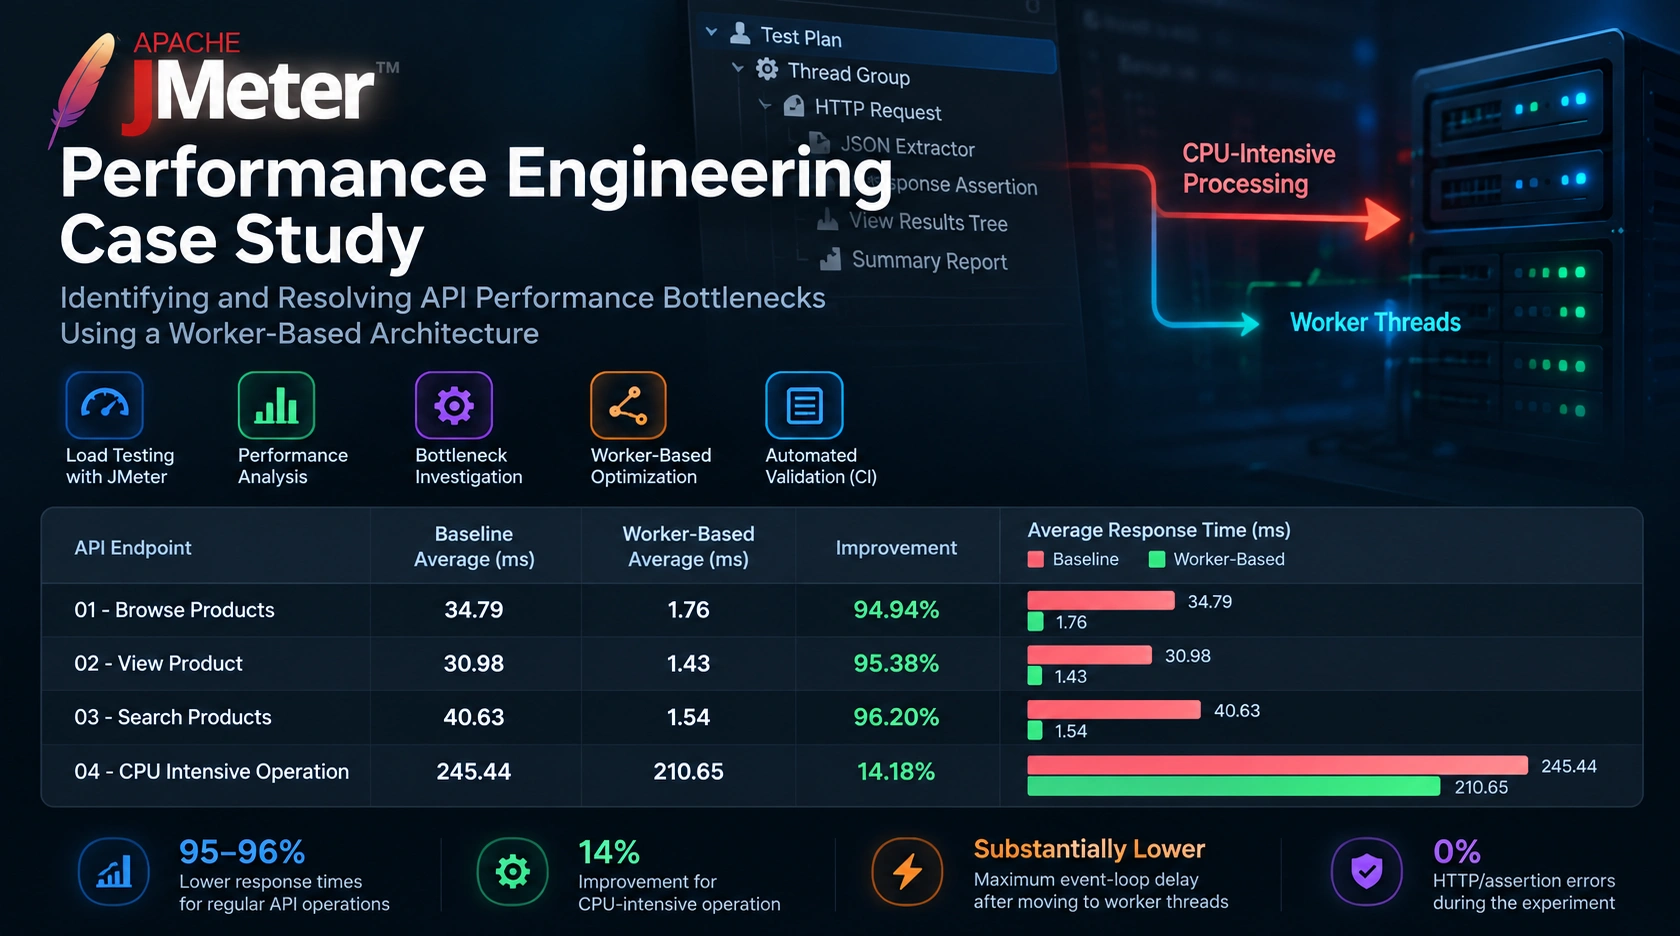
The comparison showed that worker offloading substantially reduced the impact of CPU-intensive processing on the rest of the API. Average response time decreased by approximately 95% for Browse Products and View Product, and 96% for Search Products. The CPU-intensive operation itself improved by approximately 14%.
Runtime telemetry supported the endpoint results: maximum event-loop delay dropped substantially in every worker-based run, demonstrating that CPU work was no longer blocking normal API traffic to the same extent.
All measured requests completed without HTTP or assertion errors during the controlled comparison.
Measured Performance Results
The pooled results across three baseline and three worker-based runs showed a substantial improvement in normal API responsiveness. Browse Products improved from 34.79 ms to 1.76 ms, View Product from 30.98 ms to 1.43 ms, and Search Products from 40.63 ms to 1.54 ms. The CPU-intensive operation improved from 245.44 ms to 210.65 ms.
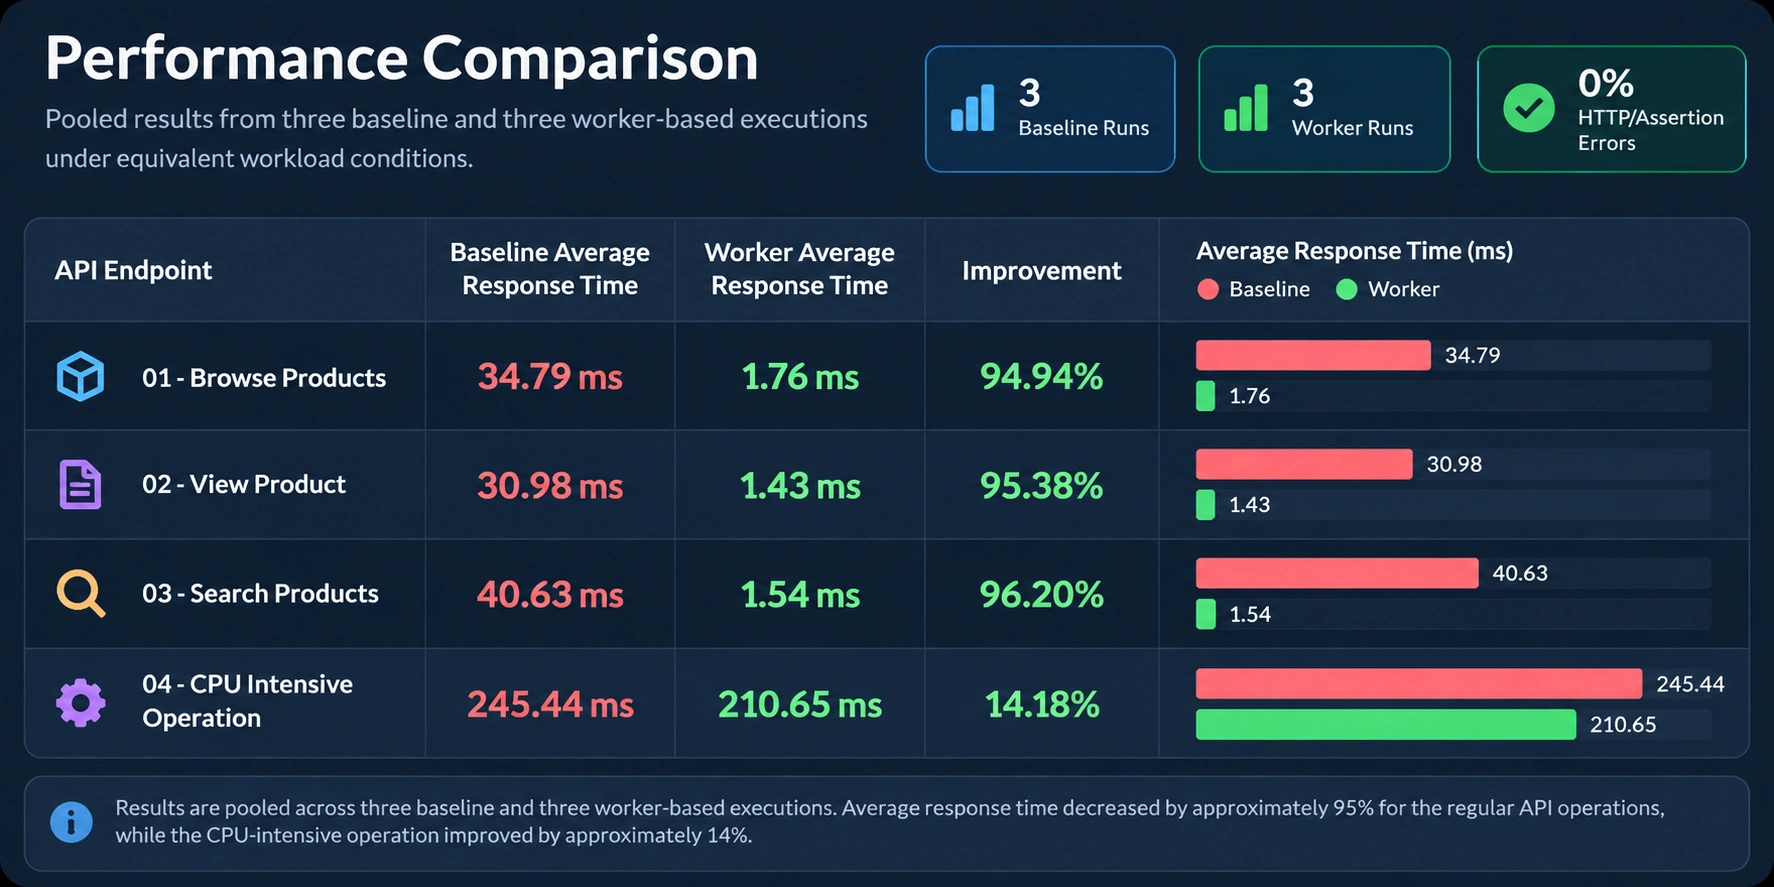
Pooled performance comparison across three baseline and three worker-based executions, showing substantial response-time improvements for regular API operations after CPU-intensive processing was offloaded to worker threads.
Runtime Evidence
Endpoint response times showed the user-facing impact of the optimization, while runtime telemetry helped explain why the improvement occurred. In the baseline implementation, CPU-intensive processing blocked the main event loop and increased maximum event-loop delay. After the work was moved to worker threads, maximum event-loop delay dropped substantially across the worker-based runs.
This provided supporting evidence that the improvement was not simply normal variation between test executions. Offloading CPU-intensive work reduced contention on the main event loop, allowing regular API requests to remain responsive while the CPU-heavy operation was executing.
Runtime Telemetry Results
Across all three controlled repetitions, the baseline implementation showed substantially higher maximum event-loop delay: 594.02 ms, 403.96 ms, and 603.46 ms. After CPU-intensive processing was offloaded to worker threads, maximum event-loop delay fell to 63.08 ms, 50.76 ms, and 44.34 ms respectively.
Event-loop utilization also decreased from approximately 28–29% in the baseline runs to below 1% in each worker-based run. This runtime evidence aligns with the endpoint results and indicates that worker offloading prevented CPU-intensive processing from blocking the main event loop to the same extent.
Maximum Event-Loop Delay (ms)
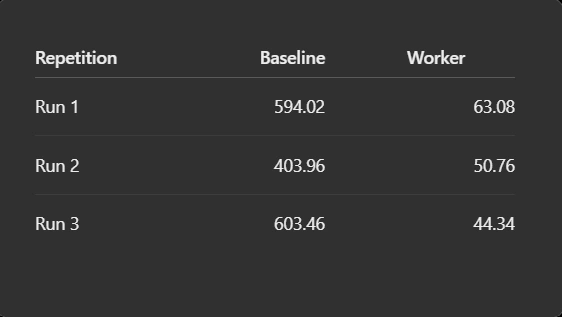
Runtime telemetry across three controlled repetitions showing substantially lower maximum event-loop delay after CPU-intensive processing was moved from the main event loop to worker threads.
Automated Analysis & Reproducibility
To make the performance comparison repeatable and auditable, the project includes automated result processing rather than relying on manual interpretation of individual JMeter reports.
Raw JTL execution data from each run is preserved and processed to calculate endpoint-level metrics across the controlled repetitions. The analysis produces sample counts, average and median response times, minimum and maximum response times, error rates, throughput, and supporting runtime telemetry.
The comparison uses pooled measurements across the three baseline and three worker-based executions. This reduces reliance on any single test run and keeps the baseline-versus-worker evaluation based on the same analysis methodology.
The project therefore preserves the complete path from test execution → raw evidence → automated analysis → comparative results, making the findings reproducible and independently reviewable.
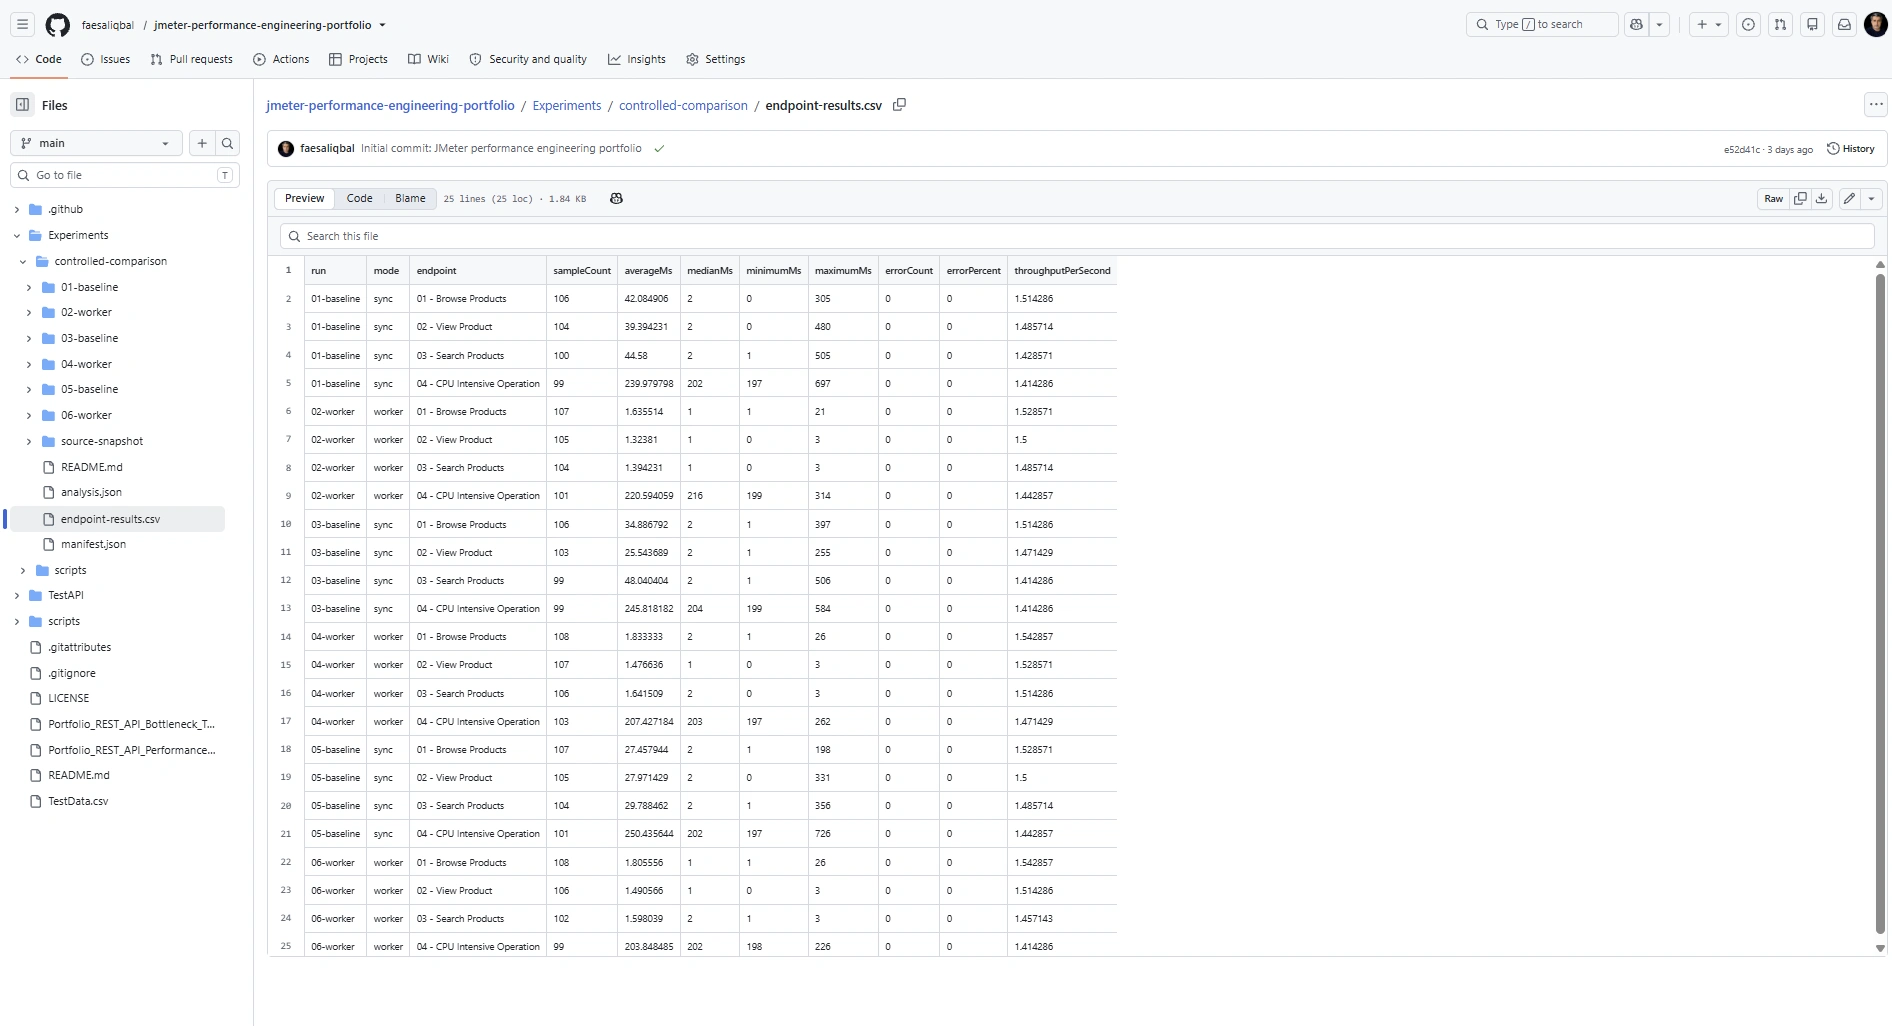
Automated endpoint-level results from three baseline and three worker-based executions, preserving response-time, sample-count, error, and throughput measurements for reproducible performance analysis.
CI Validation & Evidence Integrity
The project includes a GitHub Actions validation workflow that automatically checks the application, test assets, and published performance evidence on pushes and pull requests, with support for manual execution.
The pipeline installs the API dependencies and runs automated application tests, including validation of worker failure paths. It also validates the JMeter test-plan structure and associated JavaScript syntax to detect configuration or implementation problems.
As a final integrity check, the workflow audits the published experimental evidence using the project's comparison-analysis script. This helps ensure that the performance evidence committed to the repository remains consistent with the automated analysis used to produce the comparison.
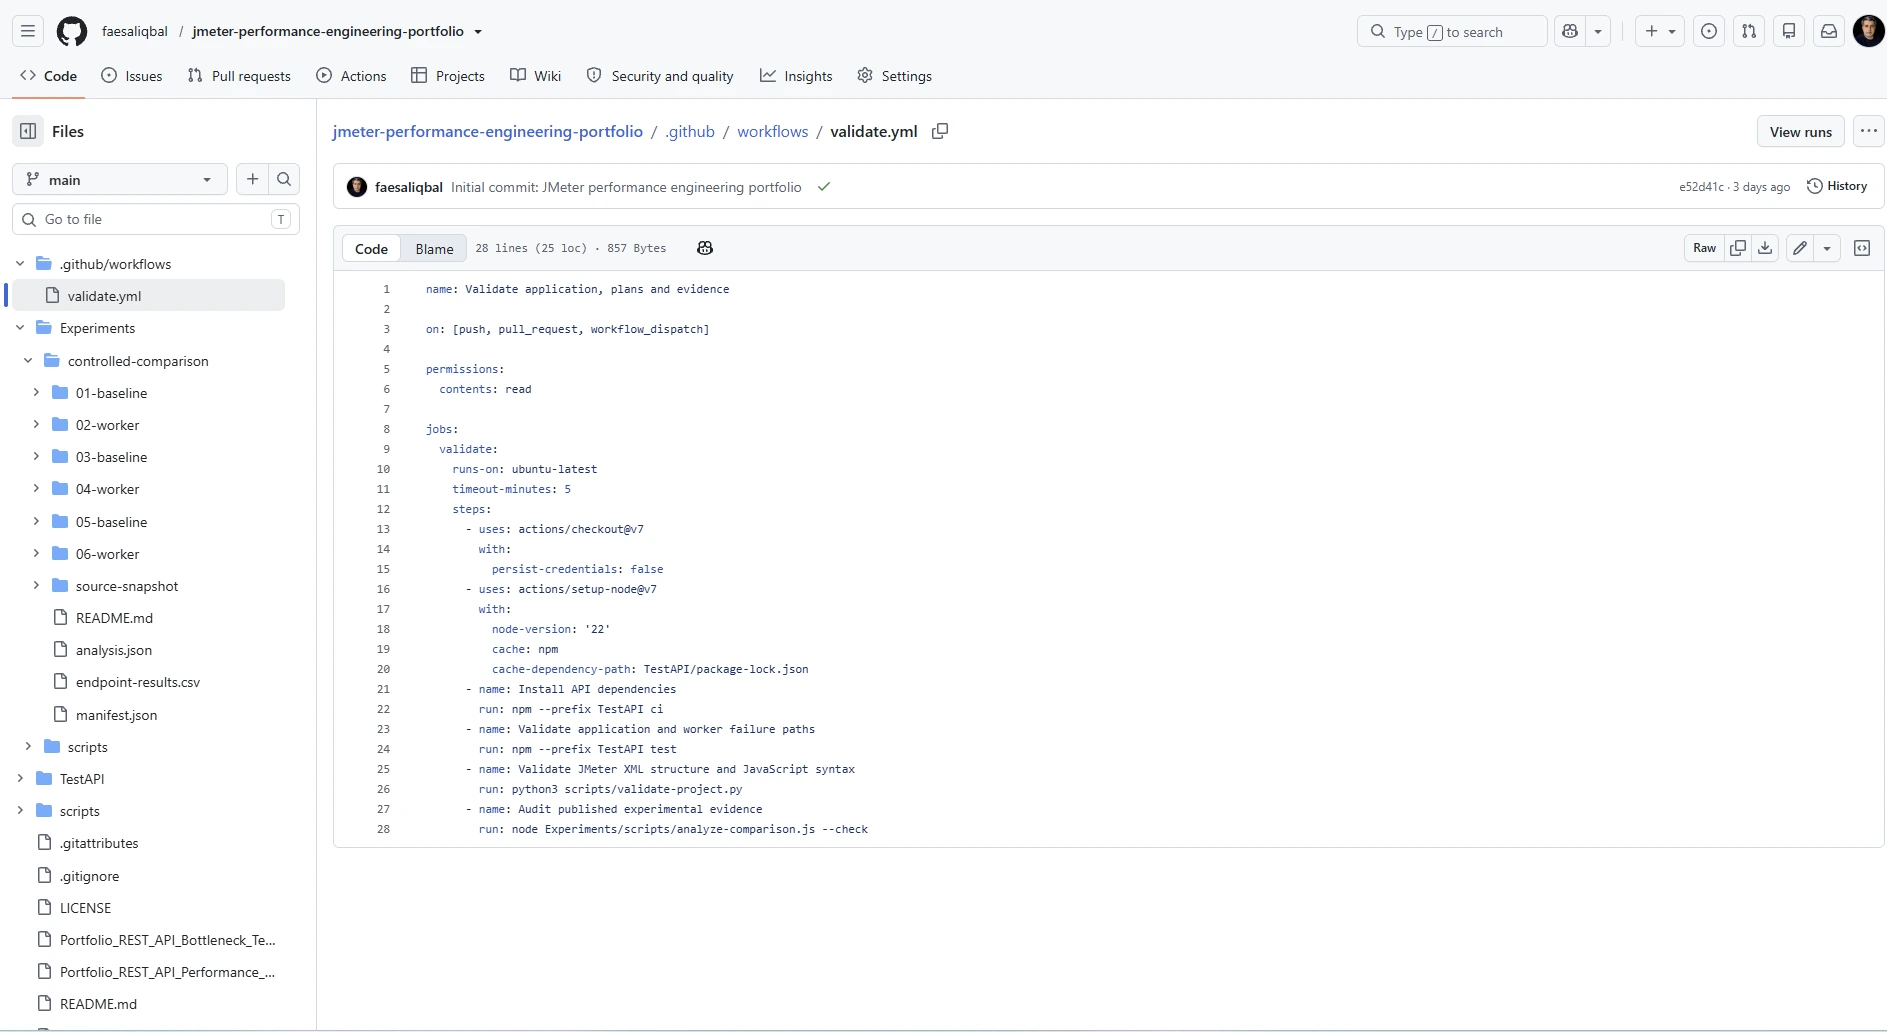
GitHub Actions validation workflow automatically testing the API implementation, validating JMeter test assets, and auditing the published performance evidence on repository changes.
Project Outcome
This project demonstrates an end-to-end performance engineering workflow rather than an isolated load test. I designed a parameterized JMeter workload, established repeatable baseline measurements, investigated the effect of CPU-intensive processing, and validated an alternative worker-based implementation under equivalent test conditions.
The controlled comparison showed approximately 95–96% lower average response times for the regular API operations, while the CPU-intensive operation itself improved by approximately 14%. Runtime telemetry provided additional evidence for the underlying cause: maximum event-loop delay dropped substantially after CPU-intensive work was moved to worker threads.
The project also preserves the supporting evidence behind these conclusions, including raw JTL results, endpoint-level analysis, runtime telemetry, repeatable comparison runs, and automated repository validation. This makes the findings reproducible and independently reviewable rather than relying solely on screenshots or a single test execution.
Key outcomes:
Identified CPU-intensive processing as a source of contention affecting otherwise lightweight API operations
Validated the optimization through three baseline and three worker-based executions
Reduced regular API average response times by approximately 95–96%
Reduced maximum event-loop delay substantially across all three controlled comparisons
Maintained 0% HTTP/assertion errors during the controlled experiment
Preserved raw test evidence and automated the comparison analysis
Added CI validation for application behavior, JMeter assets, and published experimental evidence
Technologies & Skills
Apache JMeter · Performance Testing · Load Testing · REST API Testing · Performance Engineering · Bottleneck Analysis · JavaScript · Node.js · GitHub Actions · CI/CD · Data Analysis
Source Code & Evidence
The complete project, including JMeter test plans, parameterized test data, automated analysis, raw experimental evidence, runtime telemetry, and CI validation, is available in the GitHub repository.
Like this project
Posted Oct 4, 2026
Identified and validated an API performance bottleneck using JMeter, reducing response times by up to 96% through controlled load testing and optimization.