WalidBenzineb/Airbnb-NYC-Price-Prediction-July-2024-Data-
Project Overview
This project aims to predict Airbnb listing prices in New York City using data from July 25, 2024. We'll walk through the entire data science process, from collecting and analyzing data to building a predictive model and creating a user-friendly web application. Project Steps and Key Decisions
Technologies and Skills Showcase
Programming Languages: Python
Data Manipulation: Pandas, NumPy
Data Visualization: Matplotlib, Seaborn
Machine Learning: Scikit-learn, XGBoost
Web Application: Streamlit
Version Control: Git, GitHub
Data Analysis: Exploratory Data Analysis (EDA), Statistical Analysis
Feature Engineering: Creating derived features, handling categorical variables
Model Evaluation: Cross-validation, hyperparameter tuning
Big Data Handling: Processing and analyzing large datasets
Data Cleaning: Handling missing values, outlier detection and treatment
Project Structure
Our project follows these key steps:
Data Cleaning (
data_cleaning.py): Preprocesses the raw data, handling missing values and outliers.Initial Exploratory Data Analysis (
exploratory_data_analysis.py): Performs initial data visualization and statistical analysis to understand the dataset's characteristics.Feature Engineering (
feature_engineering.py): Creates new features and transforms existing ones to improve model performance.Feature-Focused EDA (
feature_exploratory_data_analysis.py): Analyzes the engineered features, providing insights into their relationships and potential impact on the target variable.Model Training (
refined_model.py): Trains the XGBoost model using the preprocessed and engineered features.Streamlit App (
streamlit_app.py): Provides a user-friendly interface for interacting with the trained model and visualizing results.Each script can be run independently, but they should be executed in the order listed above for the full data science pipeline.
Data
This project uses the Airbnb NYC dataset from July 05, 2024. Due to the large size of the files , they are not included directly in this repository. Instead, you can download them from the following links:
After downloading, place these files in the
data/ directory of the project before running the scripts.Project Steps and Key Decisions
1. Data Collection and Initial Exploration
We started with three main data files:
calendar.csv: Contains availability and pricing informationlistings.csv: Detailed information about each Airbnb listingreviews.csv: User reviews for the listingsKey Decision: We focused primarily on the
listings.csv file as it contained the most relevant information for price prediction.2. Data Cleaning and Preparation
Handled missing values Converted data types (e.g., dates, prices) to appropriate formats Removed extreme outliers to improve data quality
Key Decision: We chose to remove extreme price outliers (above 99th percentile) to prevent them from skewing our model.
3. Exploratory Data Analysis (EDA)
Price Distribution
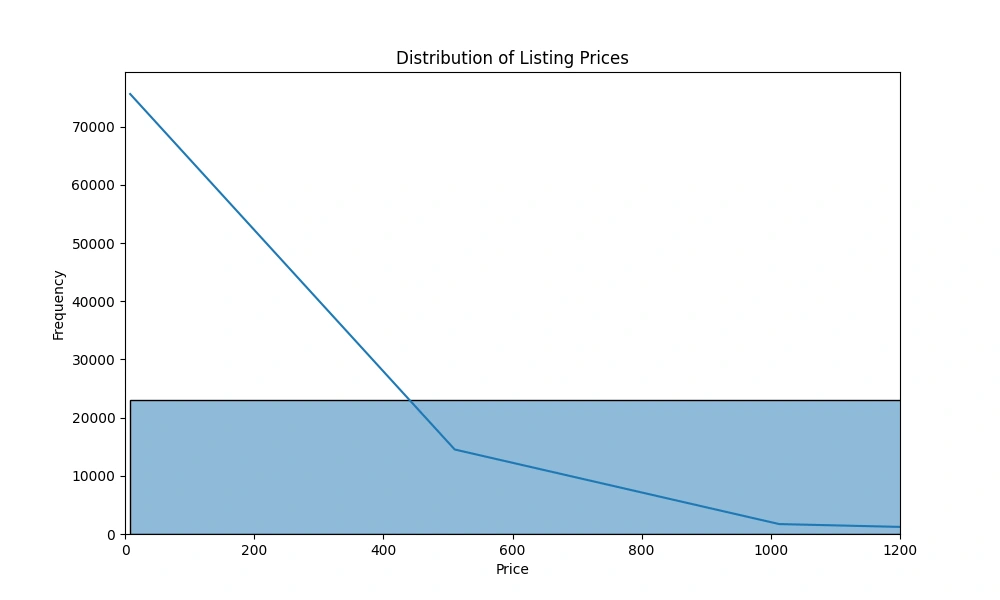
This histogram shows the distribution of Airbnb prices in NYC. We observed that:
Prices are heavily right-skewed
Most listings are concentrated in the lower price range
There are some very high-priced outliers
Key Decision: Given the skewed nature of prices, we decided to use a log transformation on the price variable to make it more normally distributed for our model.
###Price by Room Type###
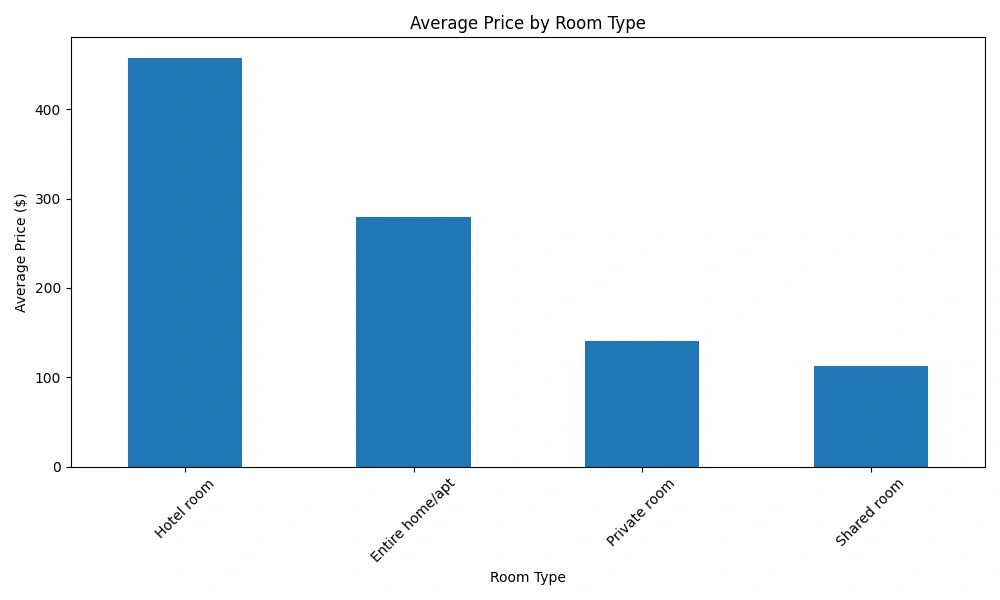
This box plot displays how prices vary across different room types. We found that:
Entire homes/apartments are generally more expensive
Shared rooms are the least expensive option
There's significant price overlap between private rooms and entire homes/apartments
Key Decision: Room type is clearly an important factor in determining price, so we made sure to include it as a key feature in our model.
Correlation Matrix
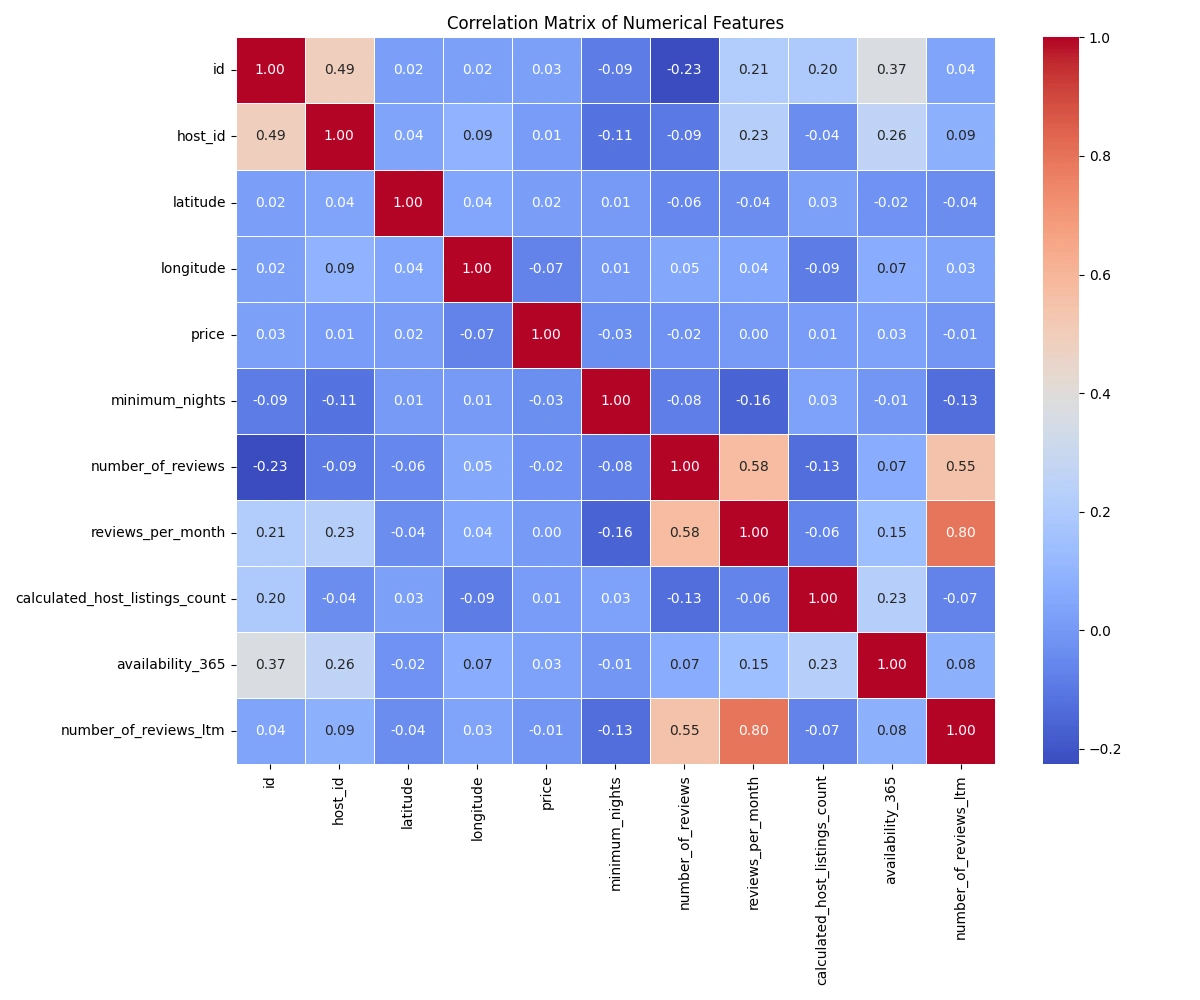
This heatmap shows the correlations between different numerical features. Notable observations:
'Number of reviews' and 'reviews per month' are highly correlated (as expected)
'Availability 365' (number of days available in a year) has a moderate negative correlation with price
Key Decision: Based on these correlations, we decided to engineer new features that could capture more complex relationships in the data.
4. Feature Engineering
We created several new features to capture more information:
*availability_rate: Percentage of days a listing is available *avg_price: Average price for each listing *price_category: Categorized prices into low, medium, high *days_since_last_review: To capture the recency of reviews *is_licensed: Whether the listing is licensed
Key Decision: We created the availability_rate feature because we noticed that availability had a relationship with price, but it wasn't perfectly linear. This new feature allowed our model to capture more nuanced patterns.
5. Model Development
We used XGBoost for our final model due to its strong performance on tabular data. Here's how we approached model development:
Split the data into training and testing sets
Created a pipeline that included:
Used RandomizedSearchCV to find the best hyperparameters
Final model performance:
R² Score: 0.8064 (The model explains about 80.64% of the variance in listing prices)
Mean Squared Error (MSE): 0.0726
Root Mean Squared Error (RMSE): 0.2694
Mean Absolute Percentage Error (MAPE): 15.35% (On average, our predictions are off by about 15.35%)
Key Decision: We chose XGBoost and fine-tuned its parameters because it consistently outperformed other algorithms we tried, including linear regression and random forests.
Interactive Web Application
We created a Streamlit web app that allows users to:
Input details about a potential Airbnb listing
View interactive data visualizations
Get a real-time price prediction based on the input
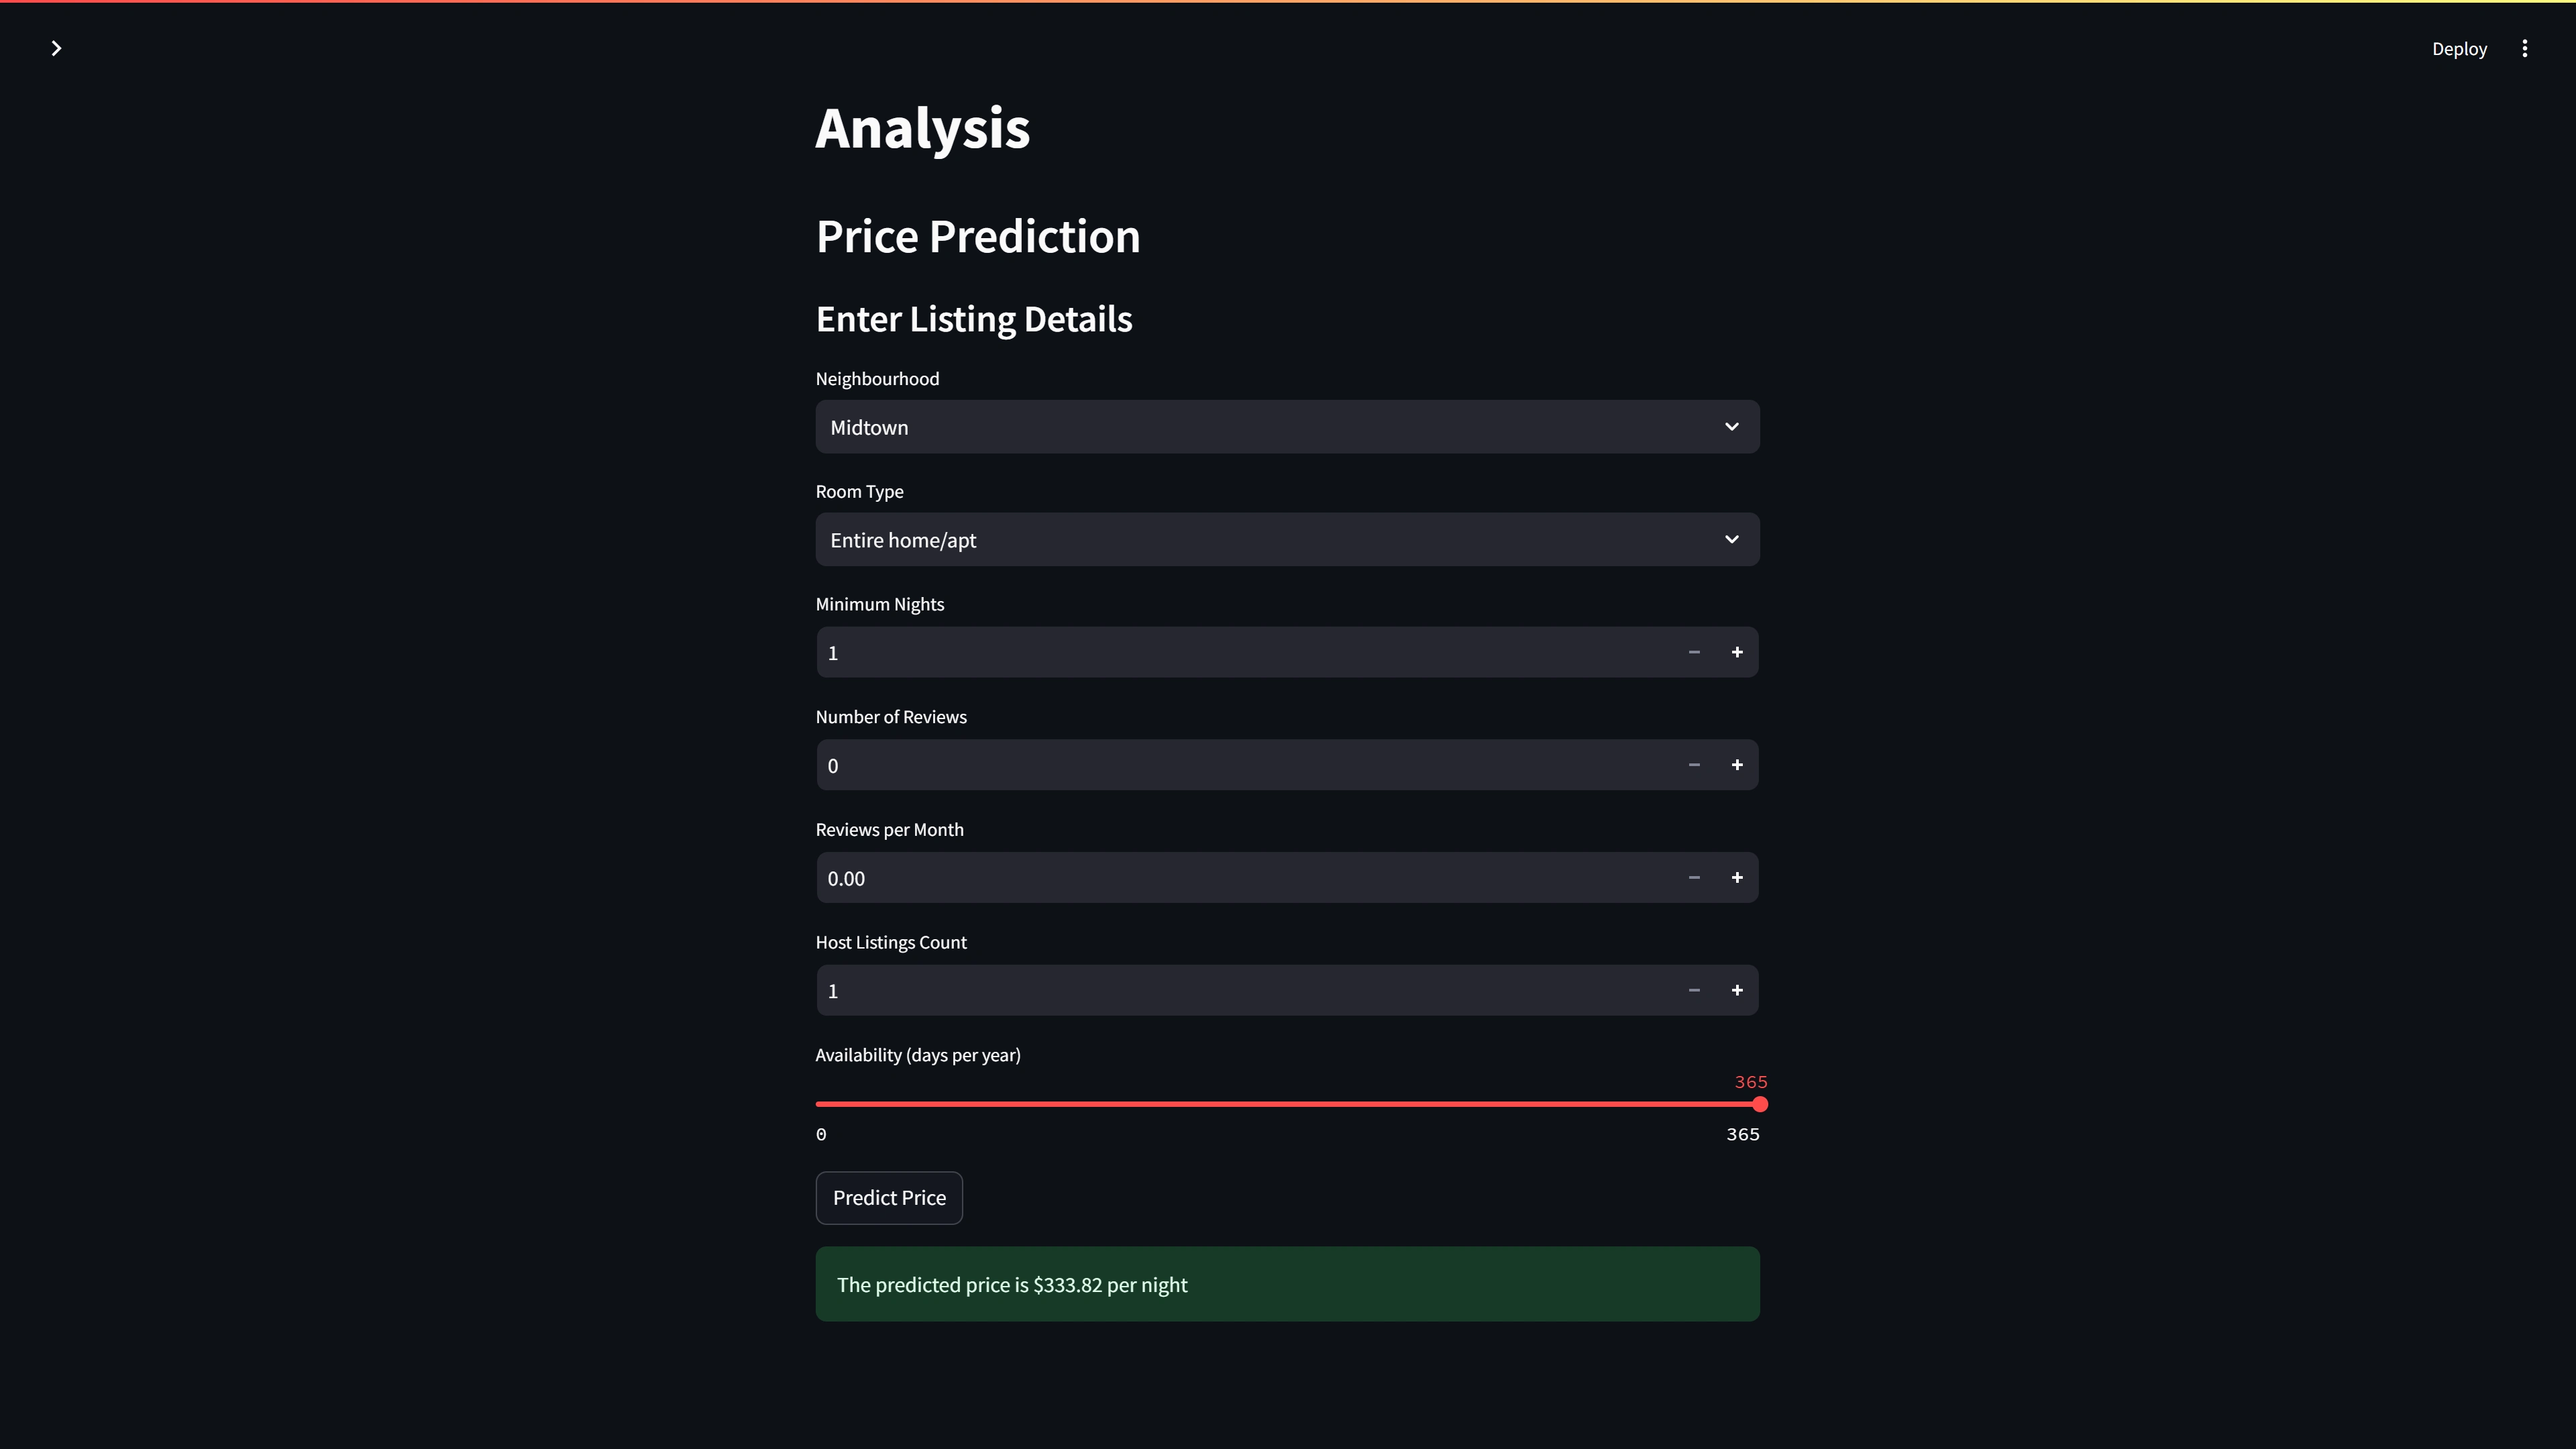
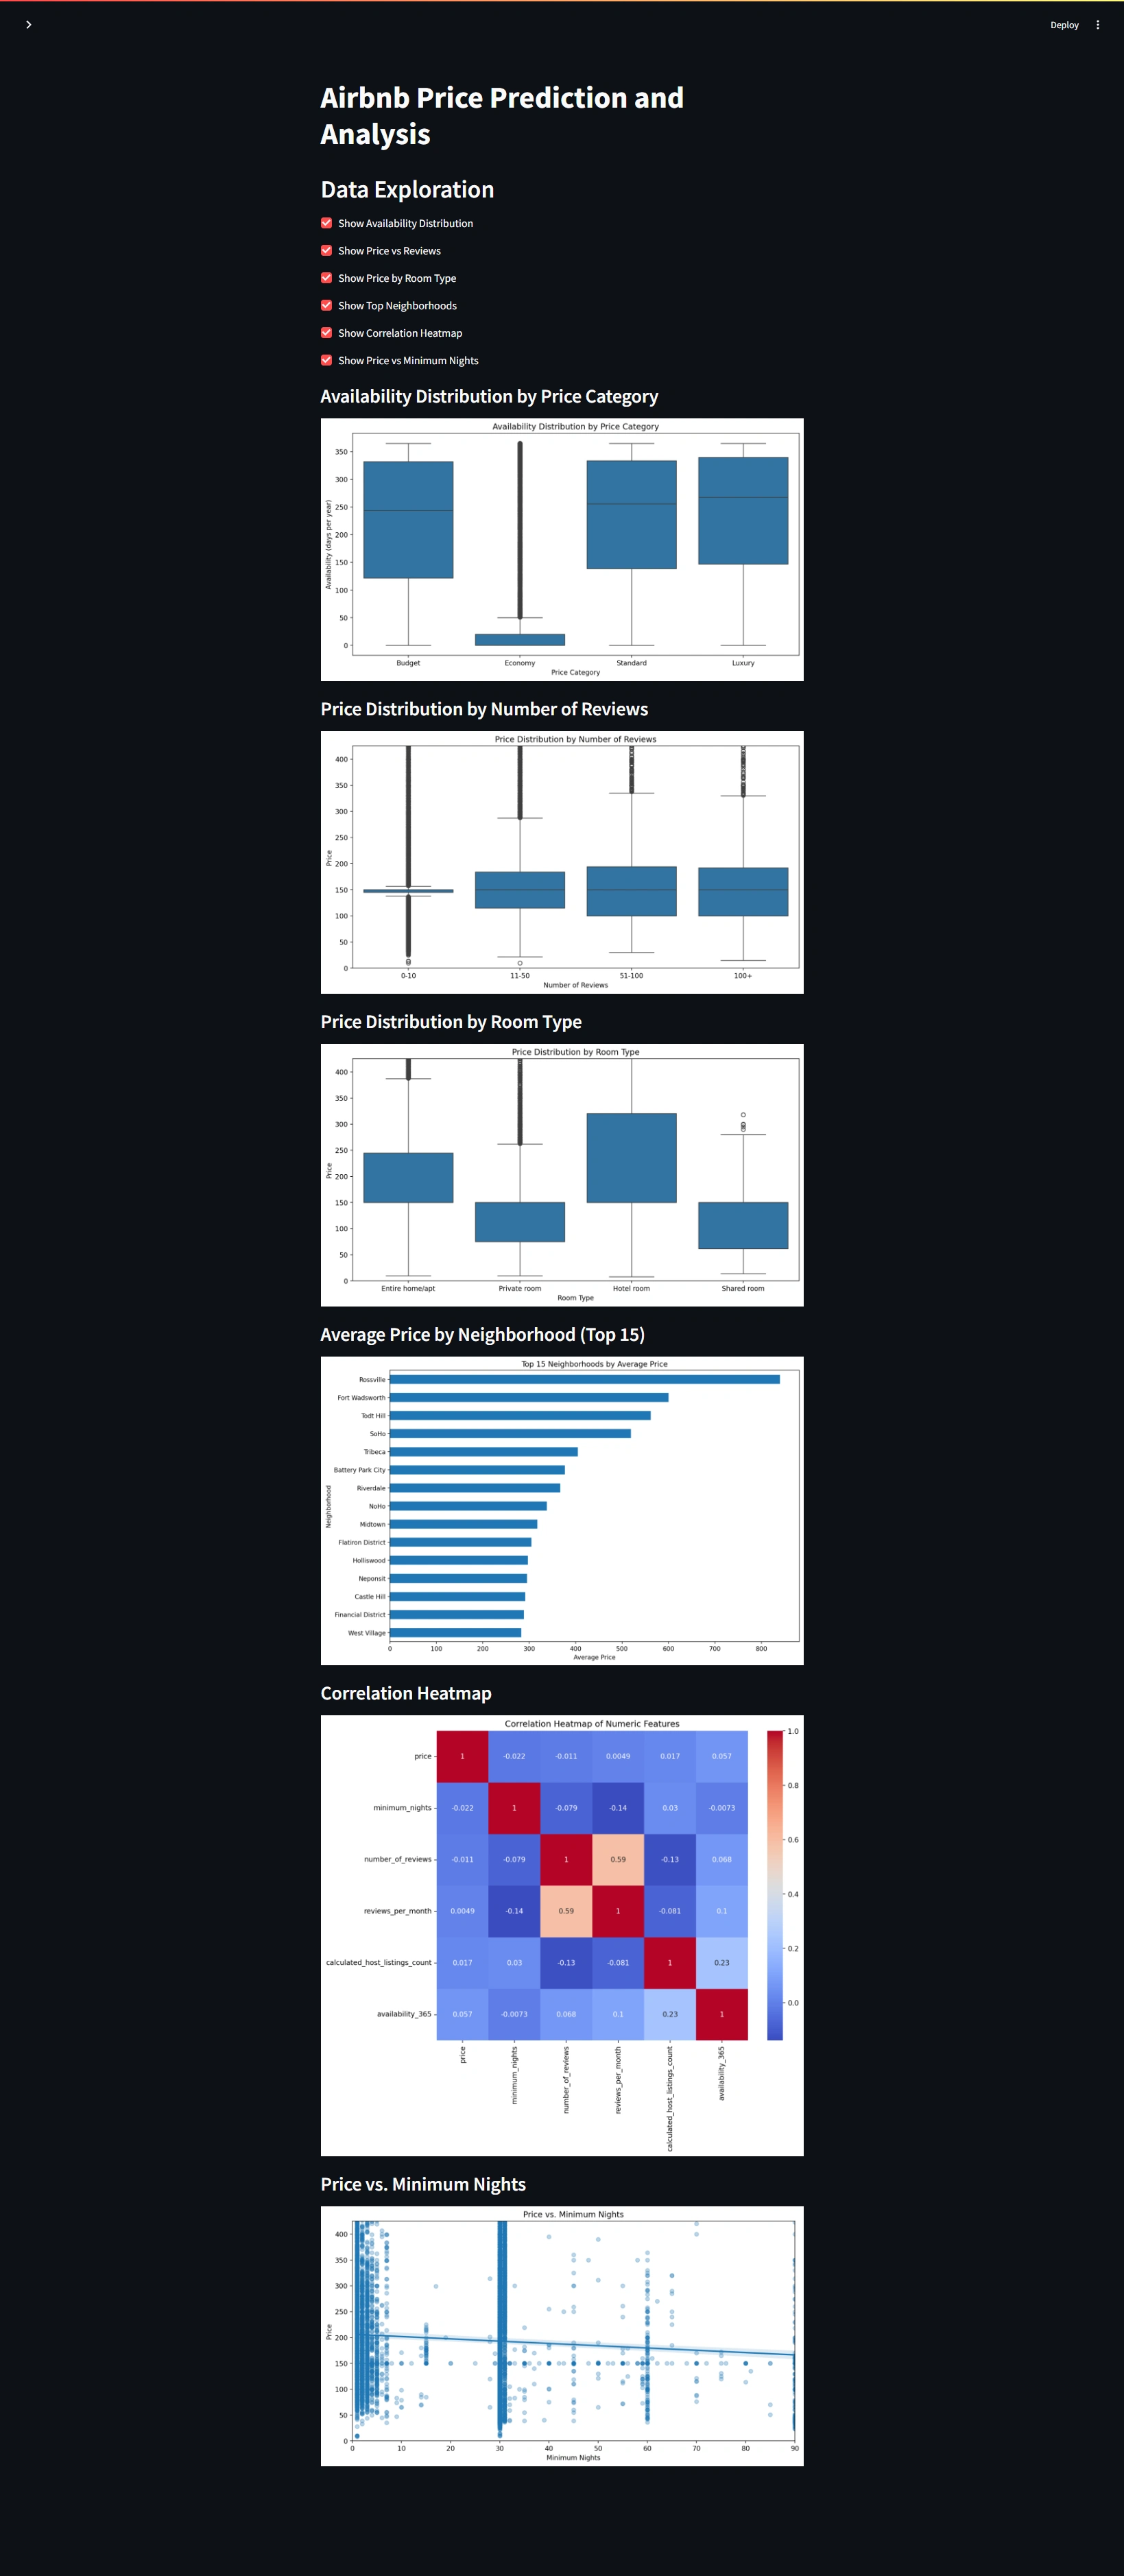
Key Decision: We chose Streamlit for its simplicity and ease of deployment, making our model accessible to non-technical users.
Challenges Faced
Data Quality Issues: The raw dataset contained missing values and outliers. We addressed this by implementing robust data cleaning procedures and carefully considering which data points to exclude to maintain data integrity without losing valuable information.
# Example of handling missing values
df['reviews_per_month'] = df['reviews_per_month'].fillna(0)
# Removing extreme price outliers
df = df[df['price'] <= df['price'].quantile(0.99)]
Feature Engineering: Creating meaningful features that capture the complexities of Airbnb pricing was challenging. We overcame this by combining domain knowledge with data-driven insights.
# Creating availability rate feature
df['availability_rate'] = df['availability_365'] / 365
# Creating price per night feature
df['price_per_night'] = df['price'] / df['minimum_nights'].clip(lower=1)
Model Optimization: Balancing model complexity with performance was tricky. We used RandomizedSearchCV to efficiently search the hyperparameter space and find the optimal model configuration.
# Hyperparameter tuning with RandomizedSearchCV
param_distributions = {
'model__n_estimators': [100, 200, 300],
'model__max_depth': [3, 4, 5, 6],
'model__learning_rate': [0.01, 0.1, 0.3]
}
random_search = RandomizedSearchCV(pipeline, param_distributions, n_iter=20, cv=5, random_state=42)
Interpreting Complex Models: XGBoost models can be challenging to interpret. We addressed this by using feature importance plots and SHAP (SHapley Additive exPlanations) values to understand the model's decision-making process.
Code Snippets
Here are some key code snippets that showcase important parts of our project:
Data Preprocessing:
def prepare_features(df):
df_selected = df[important_features + ['price']].copy()
df_selected['reviews_per_month'] = df_selected['reviews_per_month'].fillna(0)
df_selected['price_per_night'] = df_selected['avg_price'] / df_selected['minimum_nights'].clip(lower=1)
df_selected['is_superhost'] = (df_selected['calculated_host_listings_count'] > 1).astype(int)
df_selected['high_availability'] = (df_selected['availability_365'] > 180).astype(int)
return df_selected
Model Pipeline Creation:
pythonCopydef create_model_pipeline(numeric_features, categorical_features):
numeric_transformer = Pipeline(steps=[
('imputer', SimpleImputer(strategy='median')),
('scaler', RobustScaler())
])
categorical_transformer = Pipeline(steps=[
('imputer', SimpleImputer(strategy='constant', fill_value='Unknown')),
('onehot', OneHotEncoder(handle_unknown='ignore', sparse_output=False))
])
preprocessor = ColumnTransformer(
transformers=[
('num', numeric_transformer, numeric_features),
('cat', categorical_transformer, categorical_features)
])
model = xgb.XGBRegressor(random_state=42, n_jobs=-1)
pipeline = Pipeline([
('preprocessor', preprocessor),
('feature_selection', SelectKBest(f_regression, k='all')),
('model', model)
])
return pipeline
Streamlit App (Price Prediction Section):
if st.button('Predict Price'):
try:
user_input = user_input[model.feature_names_in_]
prediction = np.expm1(model.predict(user_input))
st.success(f'The predicted price is ${prediction[0]:.2f} per night')
except Exception as e:
st.error(f"An error occurred during prediction: {str(e)}")
Key Findings
Location (neighborhood) and room type are the strongest predictors of Airbnb prices in NYC
The number of reviews and review frequency have a notable impact on pricing
Availability throughout the year moderately affects pricing
There's a non-linear relationship between price and minimum nights stay
Future Improvements
Incorporate external data like proximity to attractions or public transport
Implement time-series analysis to capture seasonal price variations
Experiment with more advanced machine learning techniques, such as deep learning models
Create an automated pipeline to regularly update the model with new data
Running the Project
Clone the repository
Download the data files and place them in the
data/raw/ directory (see Data section)Install dependencies:
pip install -r requirements.txtRun data preprocessing:
python src/data_cleaning.pyPerform feature engineering:
python src/feature_engineering.pyTrain the model:
python src/refined_model.pyLaunch the Streamlit app:
streamlit run streamlit_app.pyGlossary
R² Score: A statistical measure that represents the proportion of the variance in the dependent variable (price) that is predictable from the independent variables. It ranges from 0 to 1, where 1 indicates perfect prediction.
MSE (Mean Squared Error): The average of the squared differences between predicted and actual values. Lower values indicate better model performance.
RMSE (Root Mean Squared Error): The square root of MSE, which provides a measure of the average deviation of predictions from actual values in the same unit as the target variable (price).
MAPE (Mean Absolute Percentage Error): The average percentage difference between predicted and actual values. It's often used because it's easy to interpret.
XGBoost: An optimized distributed gradient boosting library, designed to be highly efficient, flexible and portable.
Feature Engineering: The process of using domain knowledge to create new variables that make machine learning algorithms work better.
Hyperparameter Tuning: The process of finding the optimal set of hyperparameters for a machine learning model.
Contact Information
Walid Benzineb - benzinebwal@gmail.com
Like this project
Posted Aug 6, 2024
This project aims to predict Airbnb listing prices in New York City using data from July 25, 2024. The goal is to help new Airbnb hosts set their prices.


