Custom Business Dashboard Design for Efficiency


Custom Dashboard Design for Business Efficiency
Project Overview
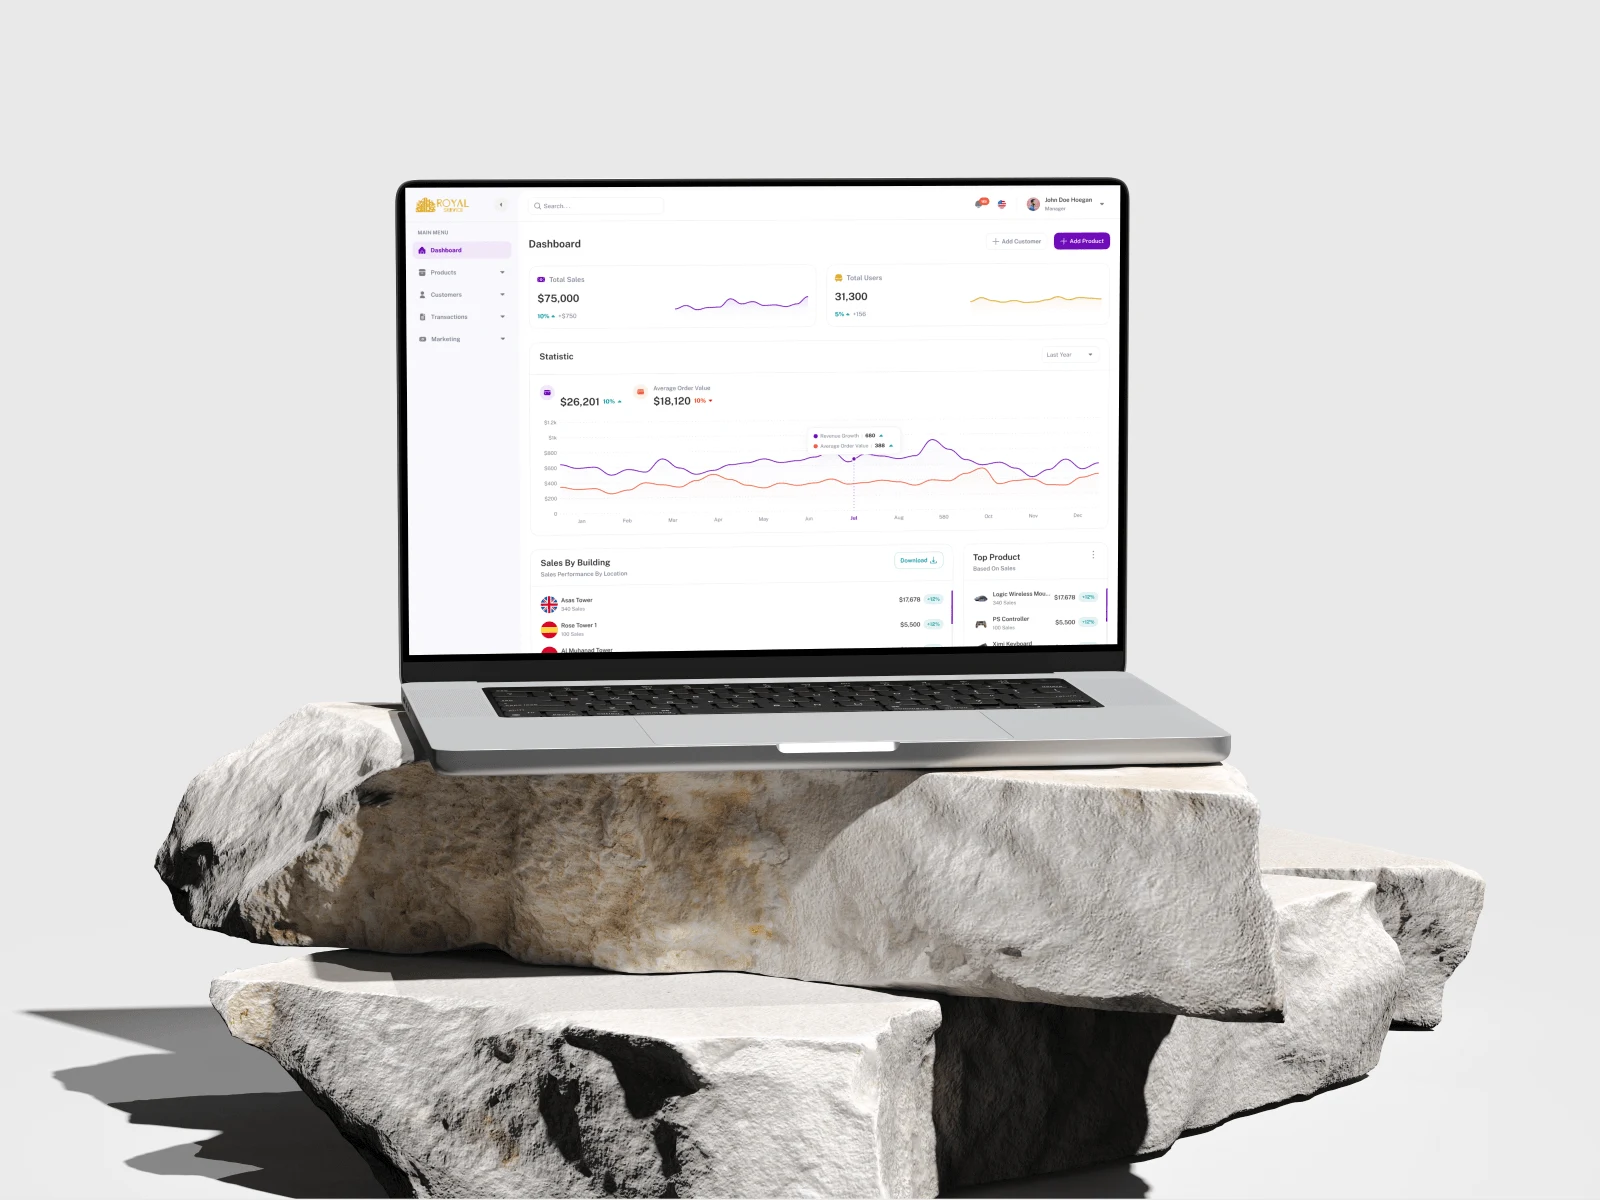
I successfully designed and developed a custom business dashboard solution that transformed how the client visualizes and interacts with their critical business data. The project delivered a comprehensive, interactive dashboard system that streamlined their decision-making process, increased operational efficiency, and provided real-time insights into key performance indicators (KPIs).
What Was Delivered
Strategic Dashboard Architecture: Created a tailored dashboard framework that organized complex business data into intuitive, actionable visualizations aligned with specific business objectives
Interactive Data Visualizations: Developed dynamic charts, graphs, and data displays that allowed users to filter, sort, and analyze business metrics in real time, facilitating faster and more informed decision-making
KPI Tracking System: Implemented a robust system for monitoring and visualizing key performance indicators, enabling the client to track progress toward strategic goals and quickly identify potential issues
User-Friendly Interface: Designed an intuitive dashboard interface that empowered users across the organization to access and understand complex data without specialized technical knowledge
Complete Documentation and Training: Provided comprehensive documentation and personalized training sessions to ensure the client could effectively use and maintain their dashboard system
Project Process
Discovery: Conducted in-depth analysis of the client's data structure, business processes, and reporting needs
Strategic Planning: Mapped user flows and created service blueprints to optimize dashboard functionality
Design and Development: Built interactive prototypes and iteratively refined the dashboard based on client feedback
Implementation: Integrated the dashboard with the client's existing data systems
Training and Handoff: Provided detailed training and support documentation
Business Impact
The dashboard solution delivered significant operational improvements:
Streamlined Processes: Automated data collection and visualization eliminated time-consuming manual reporting processes
Enhanced Decision-Making: Real-time access to critical business metrics enabled faster, data-driven decisions
Improved Data Management: Centralized data repository provided a single source of truth for all business metrics
Cost Savings: Reduced time spent on data analysis and report generation, allowing team members to focus on strategic initiatives
Scalability: Built with flexibility to accommodate business growth and evolving reporting needs
Technical Implementation
The project leveraged:
Advanced data modeling and visualization techniques
Interactive filtering and drill-down capabilities
Responsive design for access across devices
Secure data handling protocols
Integration with existing business systems
Project Duration
Completed within 5 weeks, from initial discovery to final delivery and training
Skills and Tools Utilized
Data Analysis and Modeling
UX/UI Design
Interactive Prototyping
Data Visualization
Business Process Optimization
Figma
Data modeling tools
Like this project
0
Posted Apr 12, 2025
Designed a custom business dashboard for improved data visualization and decision-making.
Likes
0
Views
0
Timeline
Nov 7, 2024 - Dec 23, 2024


Interactive Website Development with Framer

YARNN: AI-powered fashion marketplace
Subz: Ultimate Subscription Management App

Royal Service: Ultimate Car Wash Service App