
Telco Churn BI Dashboard
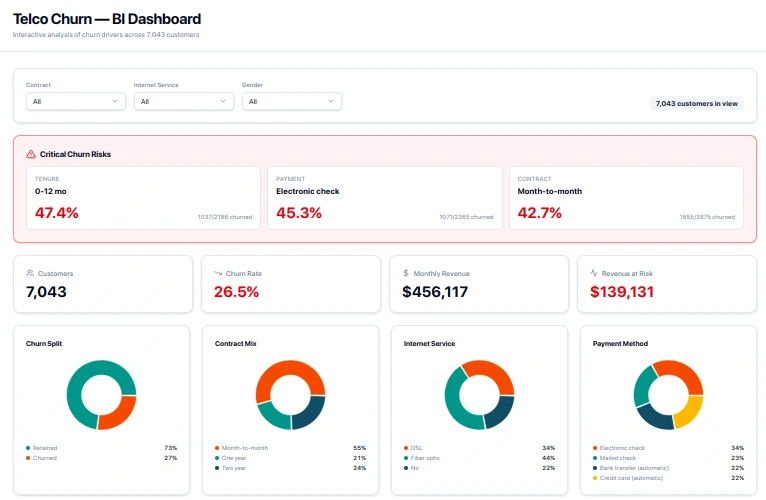
A fully interactive Business Intelligence dashboard built to analyze customer churn drivers across a telecom dataset of 7,043 customers. Designed for data teams, product managers, and business stakeholders who need clear, actionable insight into retention risk.
What's included:
KPI Cards — At-a-glance metrics: total customers, churn rate (26.5%), monthly revenue ($456K), and revenue at risk ($139K)
Critical Churn Risk Panel — Highlights the highest-risk segments by tenure, payment method, and contract type (e.g. 47.4% churn for 0–12 month customers)
Donut Charts — Visual breakdown of churn split, contract mix, internet service type, and payment method distribution
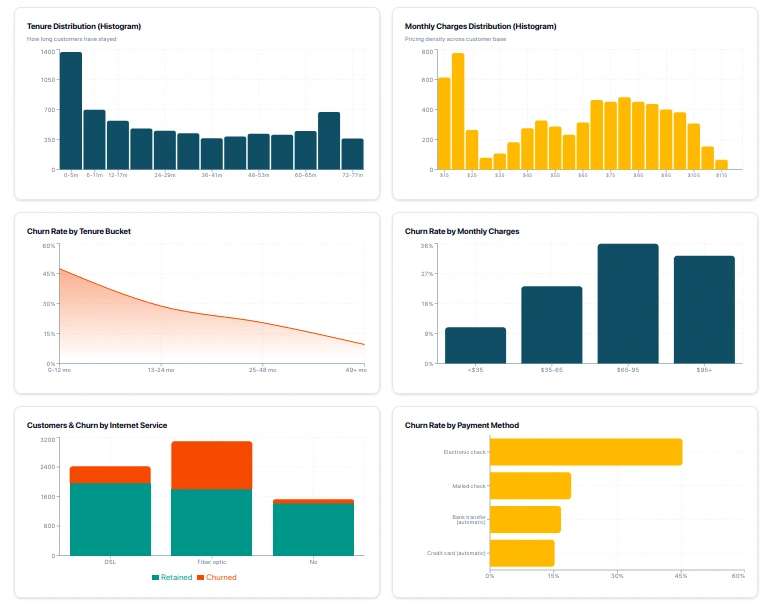
Histograms — Tenure distribution and monthly charges distribution across the full customer base
Churn Rate Trend Charts — Churn by tenure bucket, monthly charges range, internet service type, and payment method — making it easy to spot where customers are most likely to leave
Filter Bar — Segment the entire dashboard by contract type, internet service, and gender
Built for: Telecom analysts, growth teams, and anyone working on customer retention strategy. The design balances clarity with density — surfacing the most critical risk signals without overwhelming the viewer.
0 likes · 0 views · May 17, 2026
Telco Churn BI Dashboard A fully interactive Business Intelligence dashboard built to analyze customer churn drivers across a telecom dataset of 7,043 custom...


