
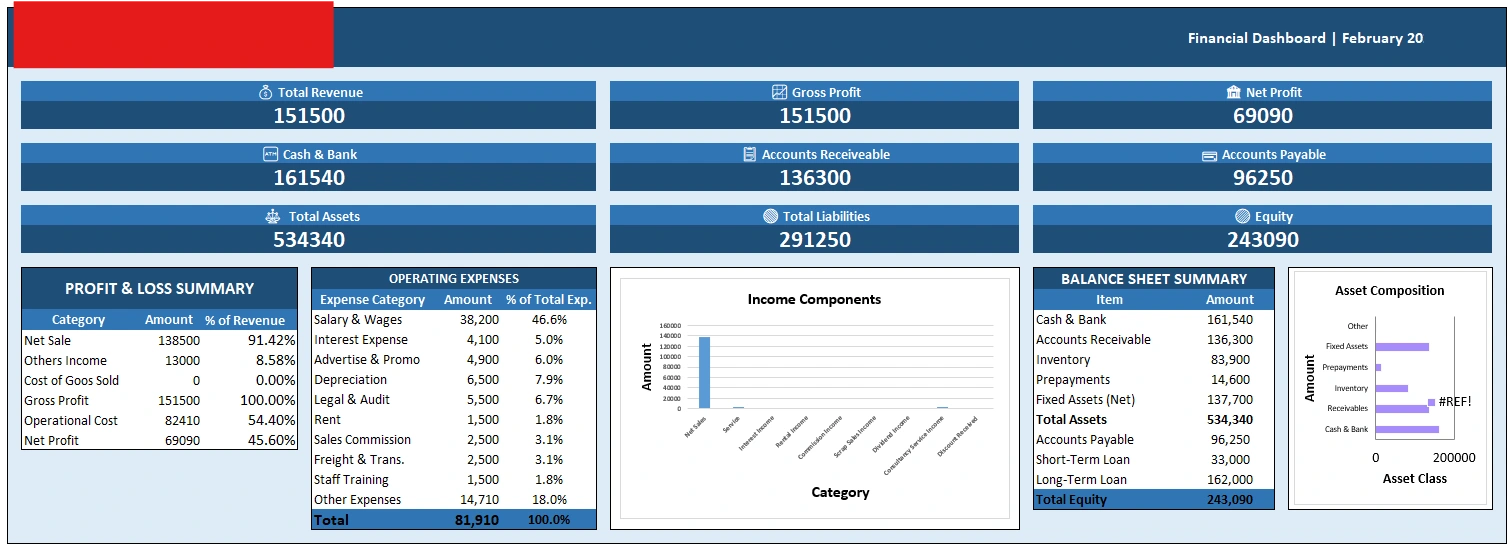
I designed an Excel financial dashboard that turns a business's accounting data into one page the owner can read in a minute. Instead of going through separate P&L and balance sheet reports, they see revenue, profit, cash, receivables, payables, and equity together.
What the dashboard includes:
Headline KPI cards: total revenue, gross profit, net profit, cash and bank, accounts receivable, accounts payable, total assets, total liabilities, and equity
Profit & Loss summary:
net sales, other income, cost of goods sold, gross profit, operating cost, and net profit, each shown as a percentage of revenue
Operating expense breakdown:
expenses by category (salaries, interest, marketing, depreciation, legal and audit, rent, commissions, freight, training) with each one's share of total expenses
Balance sheet summary:
cash, receivables, inventory, prepayments, fixed assets, payables, short-term and long-term loans, and equity
Charts: income components and asset composition, for quick visual comparison
Result:
The owner can see profitability, cost structure, and financial position at a glance. For example, they can tell that salaries make up nearly half of operating costs and that net profit is about 46% of revenue. It works for monthly reviews, lender conversations, and budgeting.
0 likes · 0 views · Sep 29, 2026
I designed an Excel financial dashboard that turns a business's accounting data into one page the owner can read in a minute. Instead of going through separa...
