Clinic scheduling dashboard — fictional sample

Adam Pope

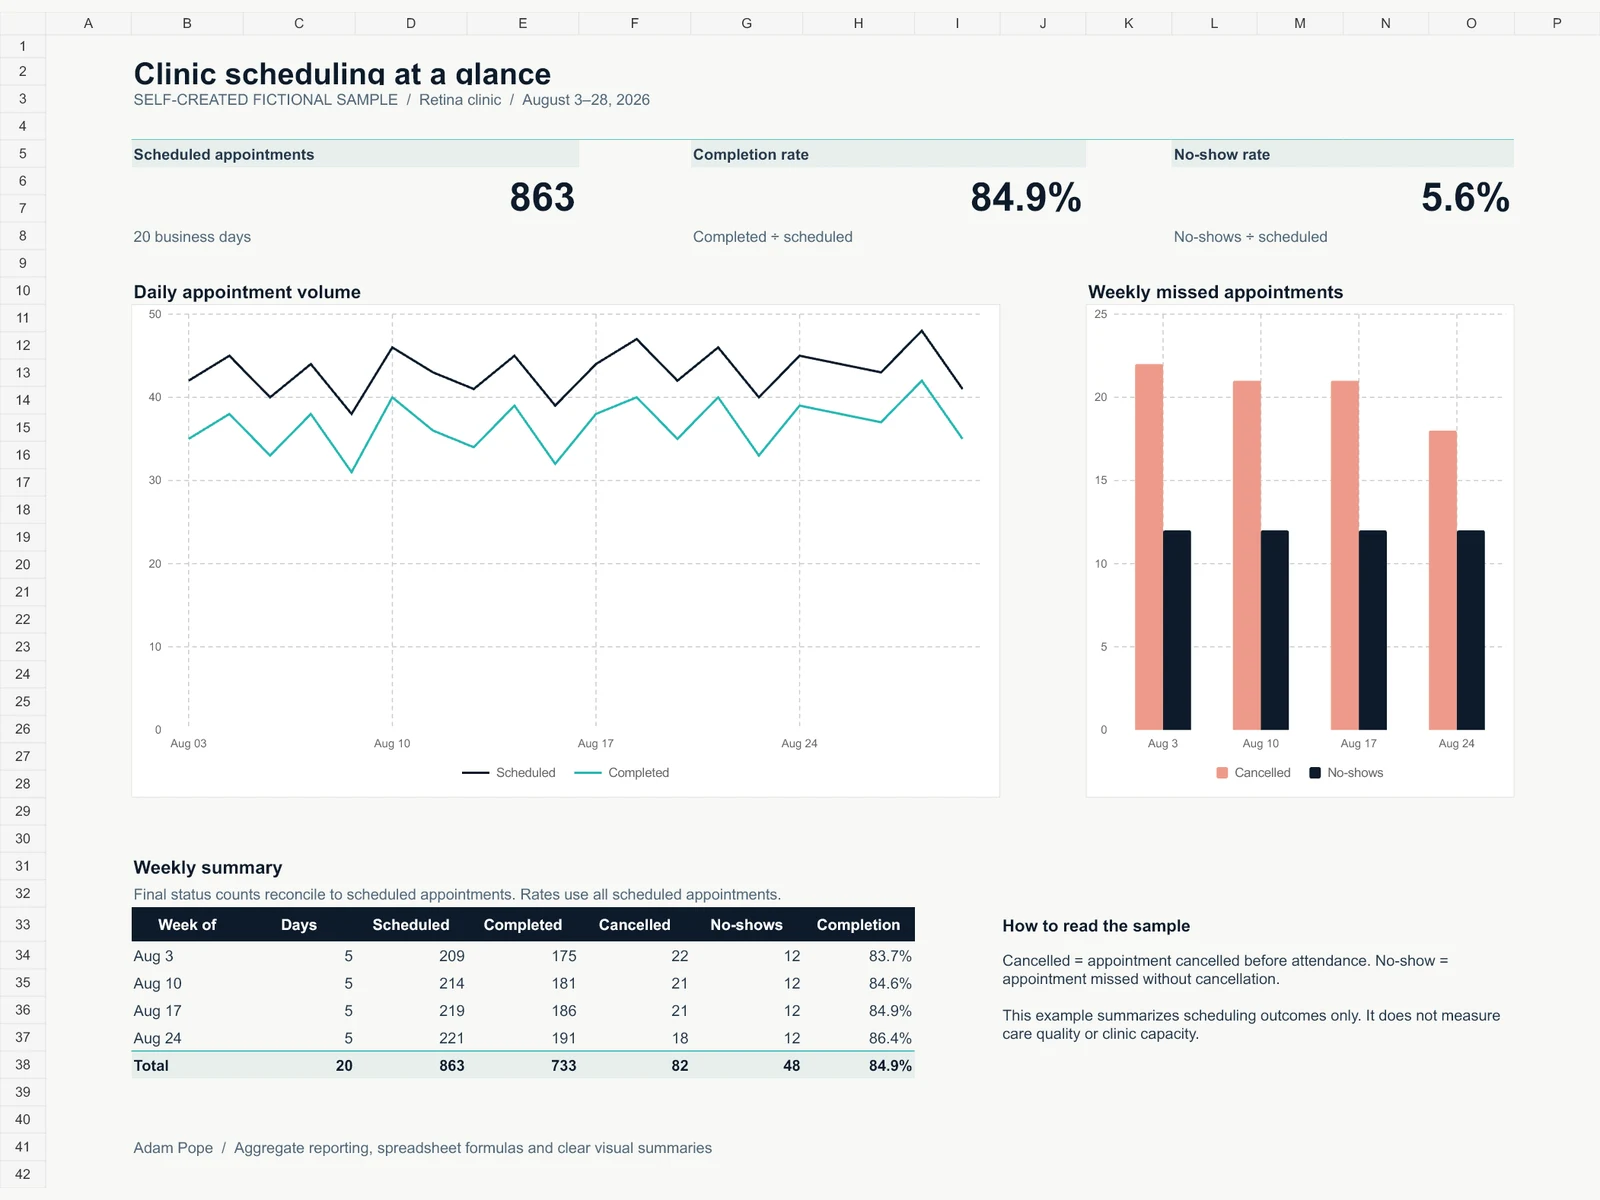
Twenty days of data, one clear scheduling overview
I created a fictional retina-clinic dataset and organized it into an editable workbook with a dashboard and daily source data. The example demonstrates spreadsheet organization, formulas and administrative reporting.
What the workbook includes
Daily appointment trends and weekly summaries.
Two linked, editable charts with defined completion and no-show rates.
Filterable source records, frozen headers and nonnegative whole-number validation.
Reconciliation checks that flag missing inputs instead of treating them as zero.
Checks and handover
All 863 scheduled appointments reconcile to 733 completed, 82 cancelled and 48 no-shows. Formula results were checked against the source, including missing-input and all-zero scenarios. The sample has a fixed 20-business-day window; extending it requires updating summary and chart ranges.
These are invented sample values, not client results or an improvement claim. No patient records or real clinic data are included.
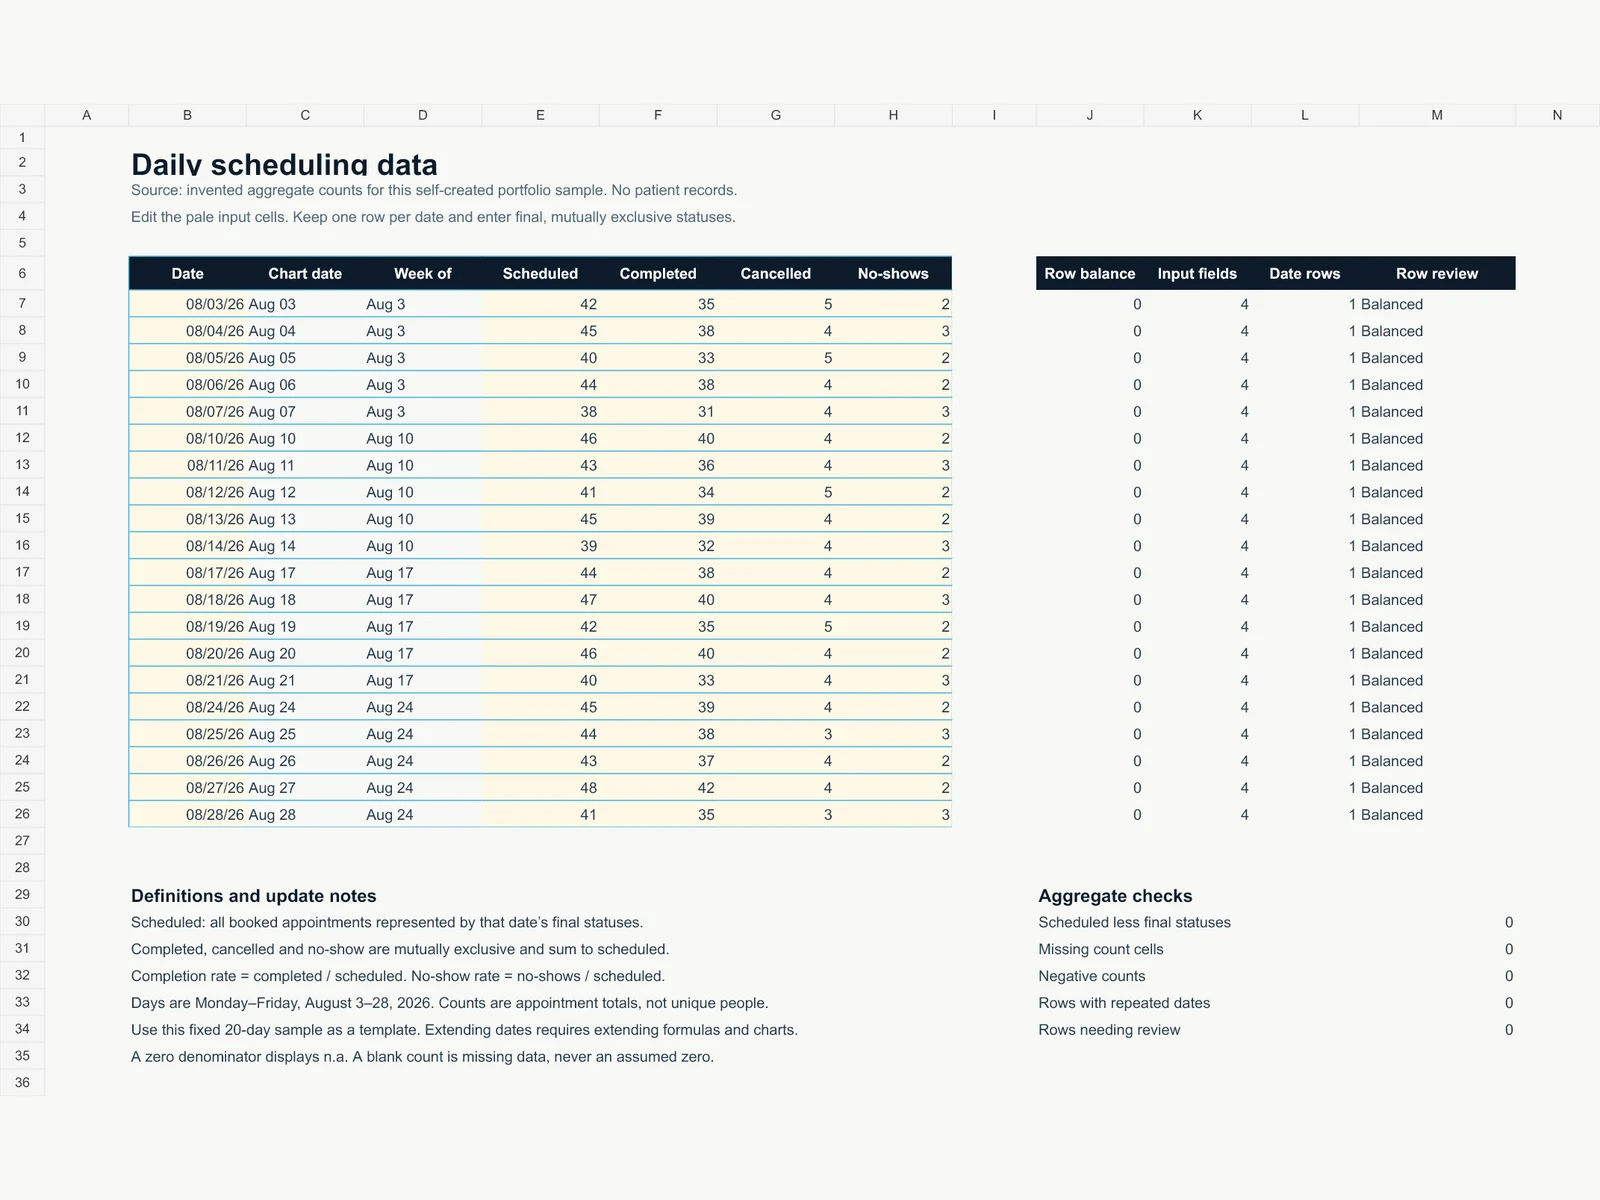
Actual Daily data sheet: fictional records, rate definitions and reconciliation checks.
fictional-clinic-scheduling.xlsx
Like this project
Posted Sep 7, 2026
20 days of fictional appointment data organized into an editable dashboard with linked charts, defined rates and reconciliation checks.
Likes
0
Views
2