
Problem:
Finance data was difficult to analyze across sales, profit, orders, discounts, countries, and customer segments.
Solution:
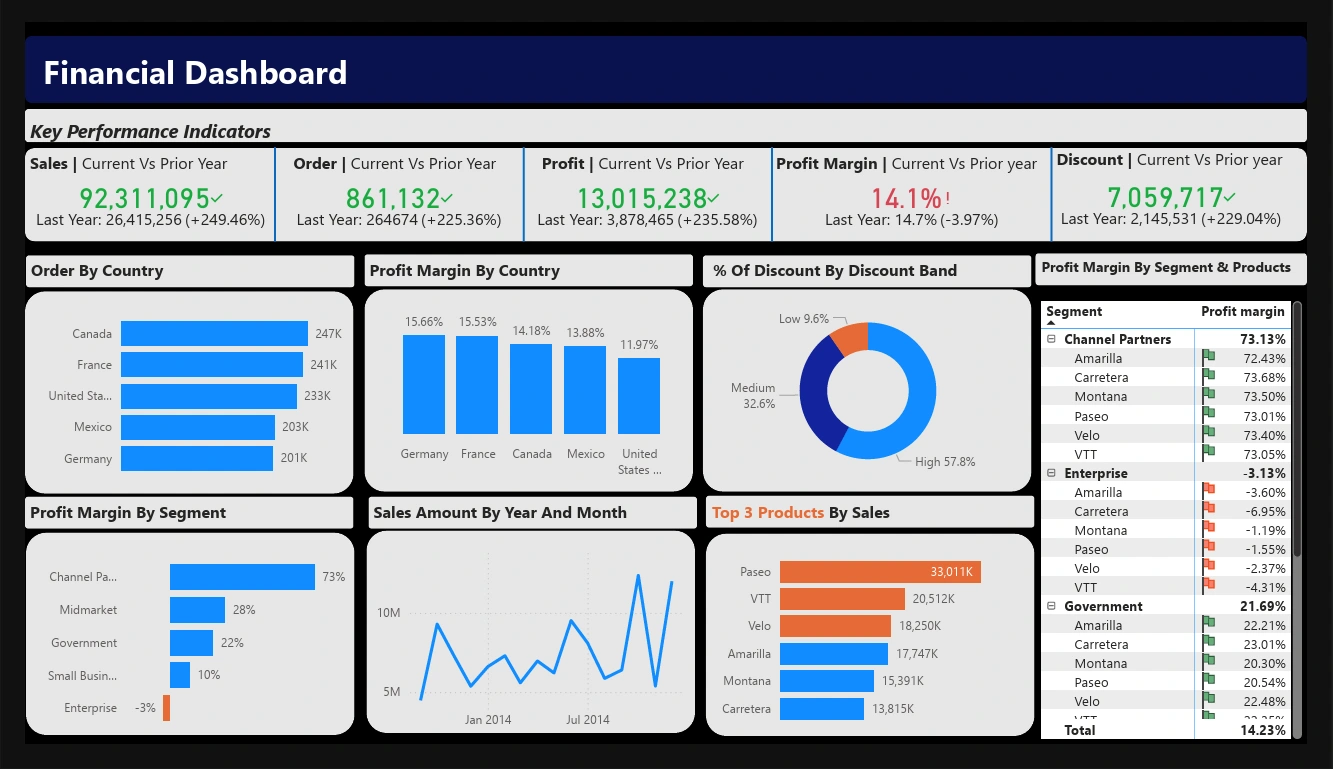
Created an interactive Power BI dashboard with KPI cards, sales trends, profit analysis, country performance, and segment-level insights.
Tools:
Power BI, Power Query, DAX, Excel, Data Modeling
Result:
Delivered a clear executive dashboard for tracking financial performance, identifying trends, and making faster business decisions.
0 likes · 0 views · Jun 25, 2026
Problem: Finance data was difficult to analyze across sales, profit, orders, discounts, countries, and customer segments. Solution: Created an interactive ...

