UK Used Cars Manufacturers and Model Report
Fatimat Thanni
UK Used Cars Manufacturers and Model Report
Introduction

This project is a Power BI Report that shows 100,000 UK used cars by manufacturers and model. The dataset contains the fuel type, price, tax, mileage and some other information about the model of the cars.
Problem Statement
What is the most common fuel type?
Is there a correlation between price and mileage?
How does the road task impact the price of the car?
Is there a trend of increasing or decreasing price and mileage over the years?
Skills Demonstrated
Data Analysis Expression (DAX)
Data Visualization
Data Analysis
Bookmark
Data Sourcing
The dataset was gotten from Kaggle. Click here to view
Data Dictionary
Manufacturer: Name of manufacturer
Model: Model of manufacturer
Year: Year of manufacture
Price: Price of car in Euro
Transmission: Type of gearbox
Mileage: distance used
FuelType: Engine fuel
Tax: Road tax
Mpg: miles per gallon
Engine size: size in liters.
Data Transformation
I imported the dataset to Power Query using the folders connector in Power BI
I created new columns:
a. Age of the car (current year – year of manufacture).
b. Price per Mileage (price divided by mileage).
I calculated Average Price using the AVERAGE function in DAX.
I also calculated Average price per model using DAX functions.
Modelling
No Data Modelling was done because the dataset was merged into one table after using the folders connector.
Analysis and Visualizations
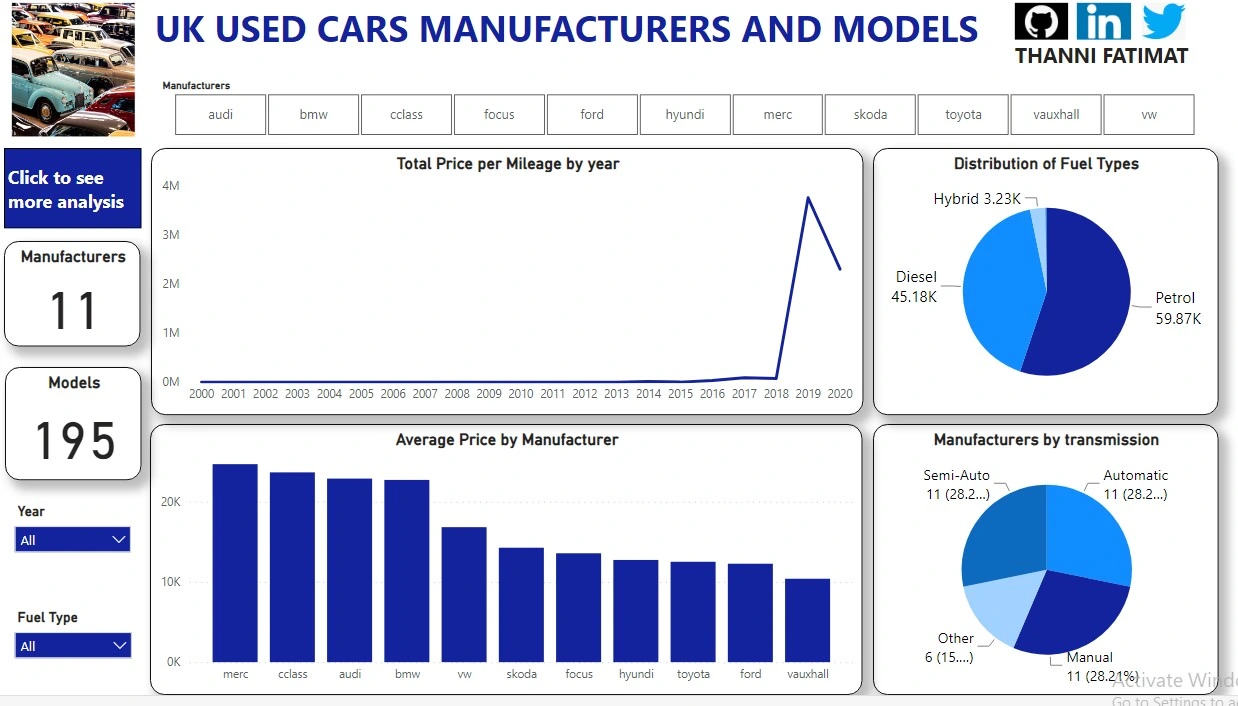
There are 11 manufacturers in total.
There are 195 models in total.
Petrol is the most common fuel type.
Mercedez manufacturers have the highest average price.
11 manufacturers use Automatic gearbox.
11 manufacturers use Manual gearbox.
11 manufacturers use Semi-automatic gearbox.
6 manufacturers use other types of gearboxes.
Total price per mileage increased over the years and reduced in 2020.
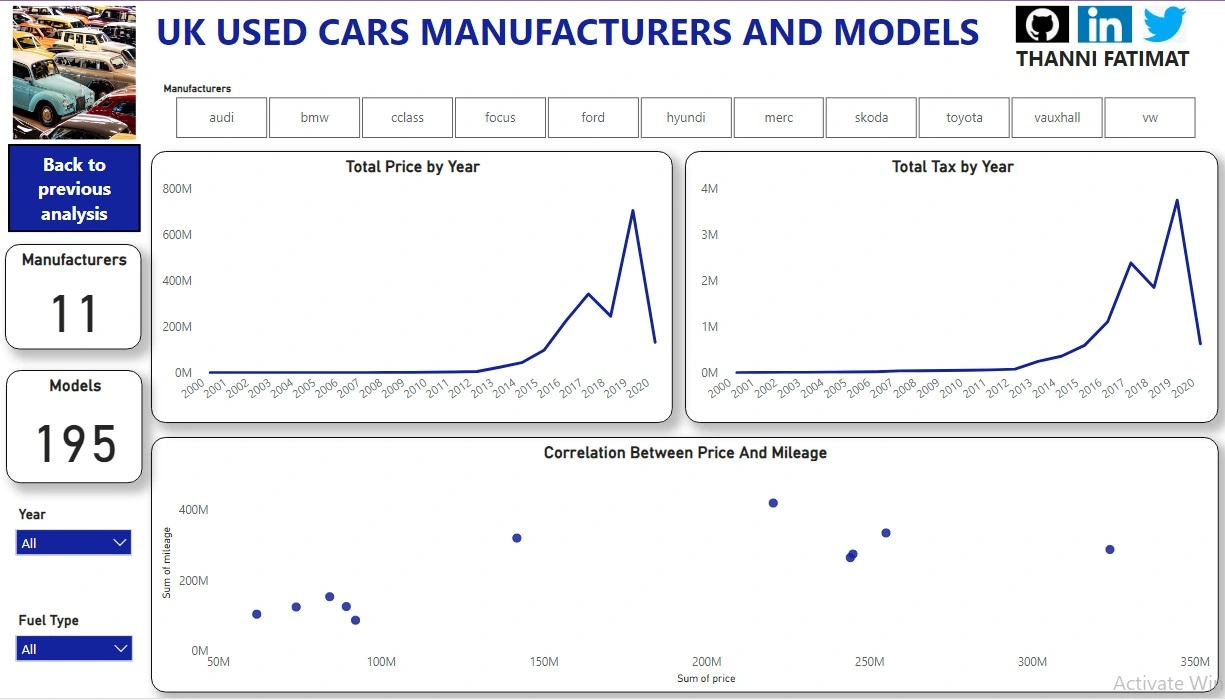
Total price increased across the years till 2017 and reduced in 2018 with another increase in 2019 and finally reduced in 2020.
Total tax has the same effect as total price.
There is no correlation between price and mileage.
Interact with the report here
Conclusions and Recommendations
Since there is no correlation between price and mileage, it means the price of car does not affect the distance used by the car.
Petrol should always be readily available since it is the most common fuel type used by the cars.
Like this project
Posted Mar 27, 2024
This project is a Power BI Report that shows 100,000 UK used cars by manufacturers and model. The dataset contains the fuel type, price, tax, mileage, e.t.c
Likes
0
Views
13