
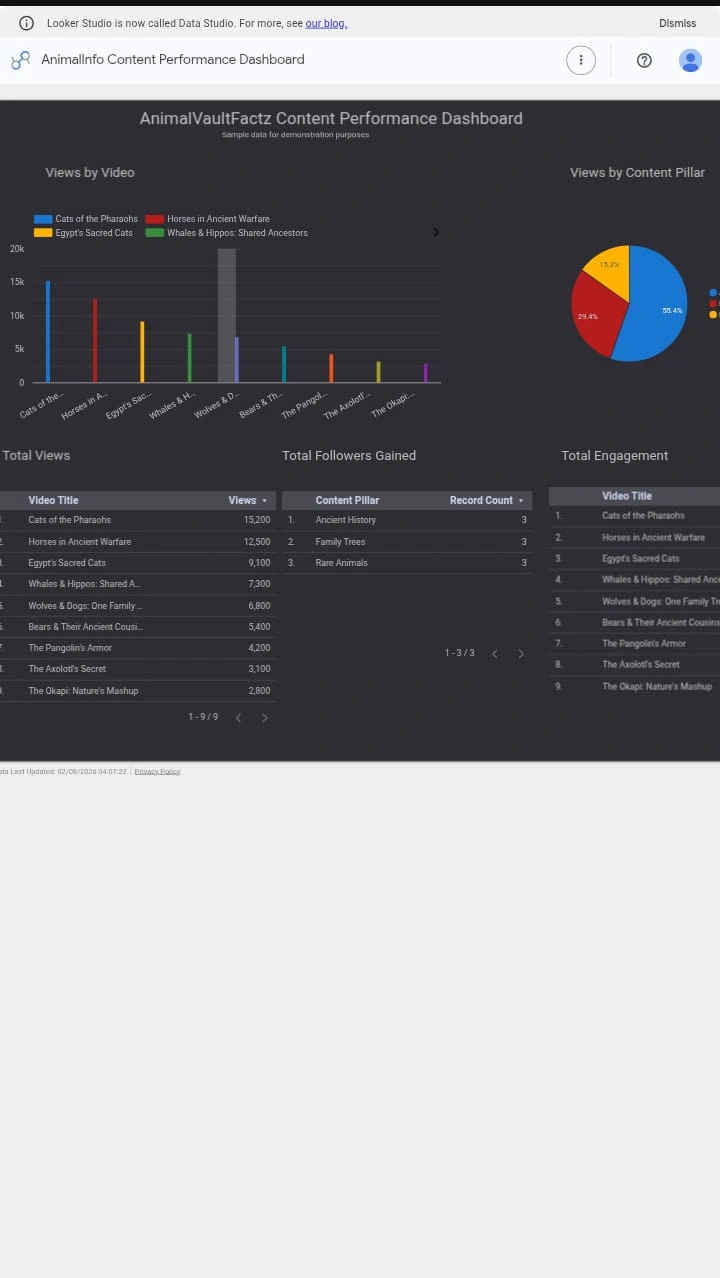
A content analytics dashboard built in Looker Studio, connected to Google Sheets, tracking views, engagement, and content-pillar performance at a glance for a short-form video brand.
The problem: raw platform analytics (TikTok, etc.) don't show performance broken down by content category — making it hard to see which content pillars are actually working without manually cross-referencing every post.
The build: at-a-glance scorecards for total views, total followers gained, and total engagement (likes + comments + shares), plus a breakdown of views by individual video and by content pillar (Rare Animals / Family Trees / Ancient History) — surfacing which content categories perform best.
Note: built using sample/demo data for demonstration purposes, not live account data. The dashboard structure, connections, and logic are fully functional and could be connected to real data at any time.
Result: a working, reusable reporting template — the kind of dashboard a content or marketing team would use to make decisions on what to produce more of.
0 likes · 0 views · Aug 2, 2026
A content analytics dashboard built in Looker Studio, connected to Google Sheets, tracking views, engagement, and content-pillar performance at a glance for ...

