Pizza Sales Dashboard
Tarun Kumar
Developed a multi-paged Pizza Sales Dashboard using Power BI and Utilized various graph types, such as bar charts, line charts, funnel charts, and donut charts to effectively visualize sales trends, product performance, and customer behavior.Identify key performance indicators (KPIs) and integrated them into the dashboard for quick insights into business performance. Conducted data cleaning and processing for a dataset containing 50,000 rows of pizza sales data to ensure accurate and reliable visualizations.On the 1st page of dashboard I created various KPIs and showed the daily trends, Monthly trends, Total Pizza sold by Pizza category, % of pizza sold by size and category. Used bar chart for daily trends of total Orders. Used line chart for monthly trend of total Orders. Used Donut chart for % of pizza sold by size and category. Used Funnel chart for Total Pizza sold by Pizza category.
Like this project
Posted Apr 1, 2024
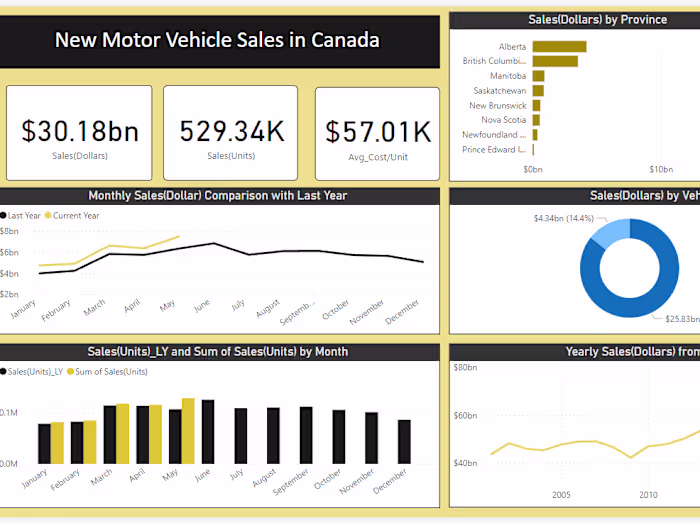
Made Dashboard using Sales Dataset to gain quick information through KPI's.
Likes
0
Views
7