
I built this independent reporting sample from fictional order and refund data. PostgreSQL deduplicates the feed and aggregates issued refunds before joining them to sales. The Excel dashboard covers 4,852 orders, with four filterable KPIs and two native PivotTables. A checks tab reconciles the workbook to SQL totals. The report flagged Marketplace for review after 19.4% of its Q4 orders received a refund, compared with about 5% in the other channels.
Retail Operations - Excel and SQL.xlsx
01_source_and_clean.sql
02_reporting.sql
03_reconcile.sql
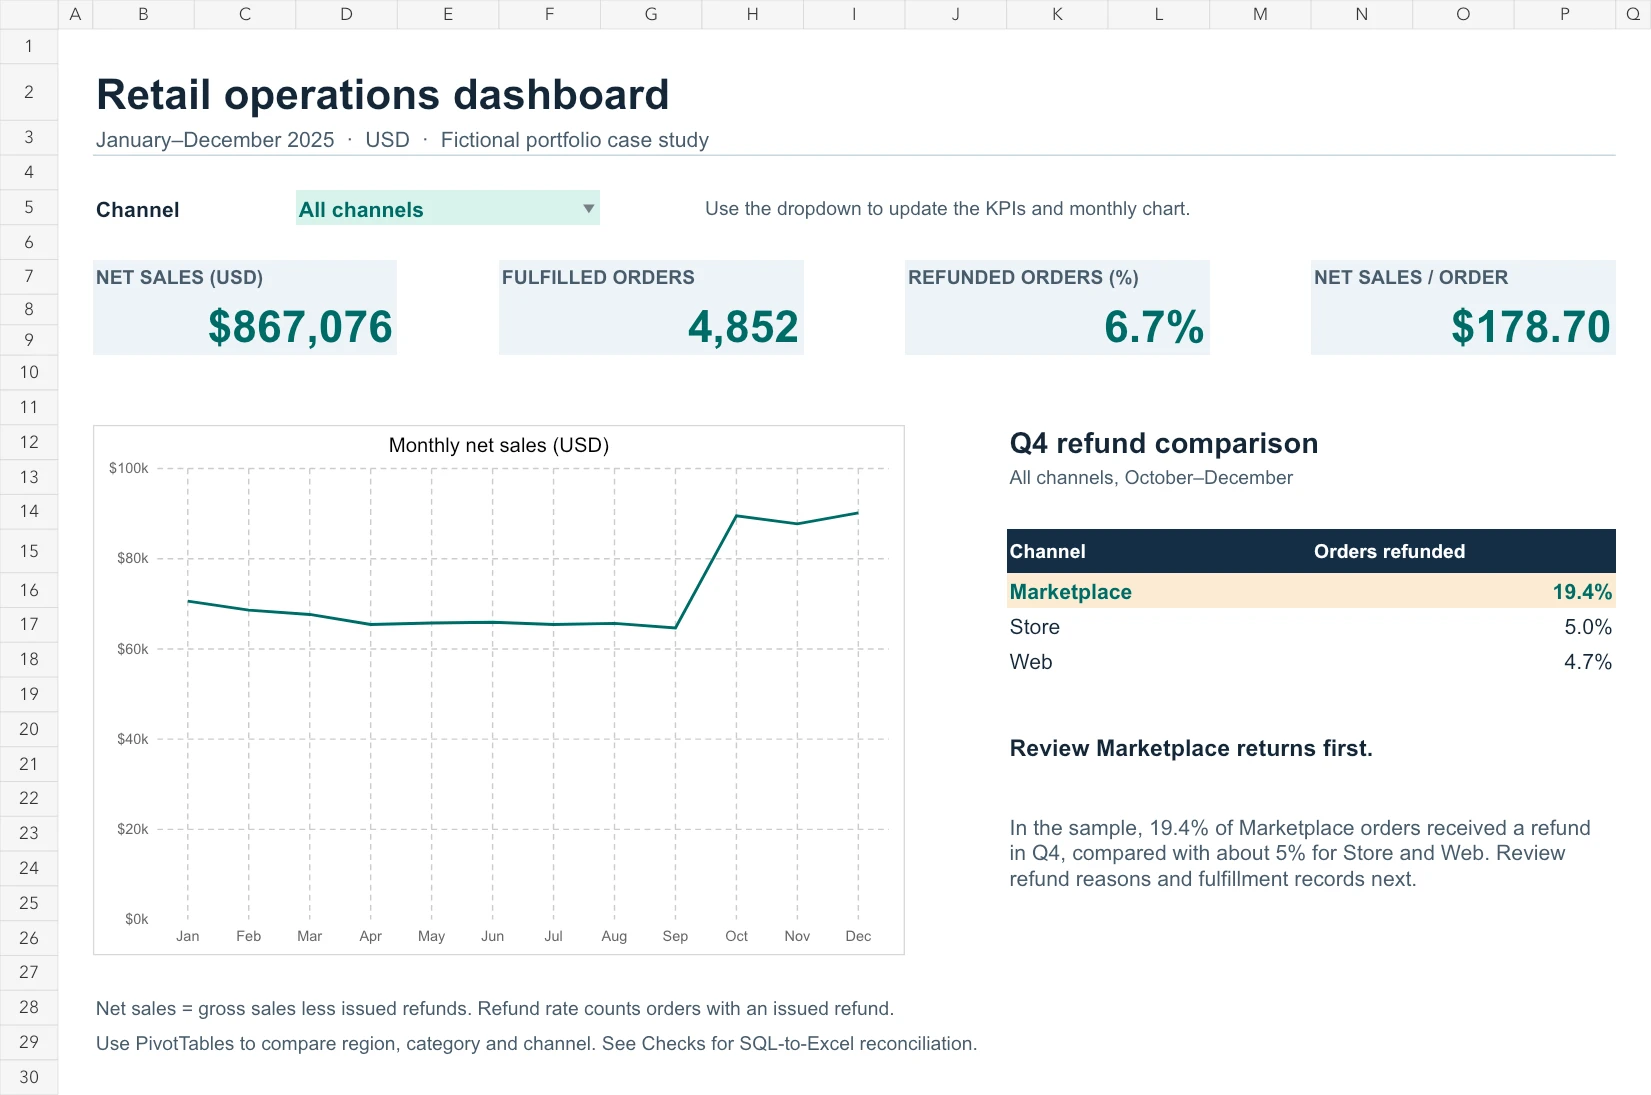
Filter net sales and fulfillment by channel. The Q4 comparison identifies where to investigate refunds.
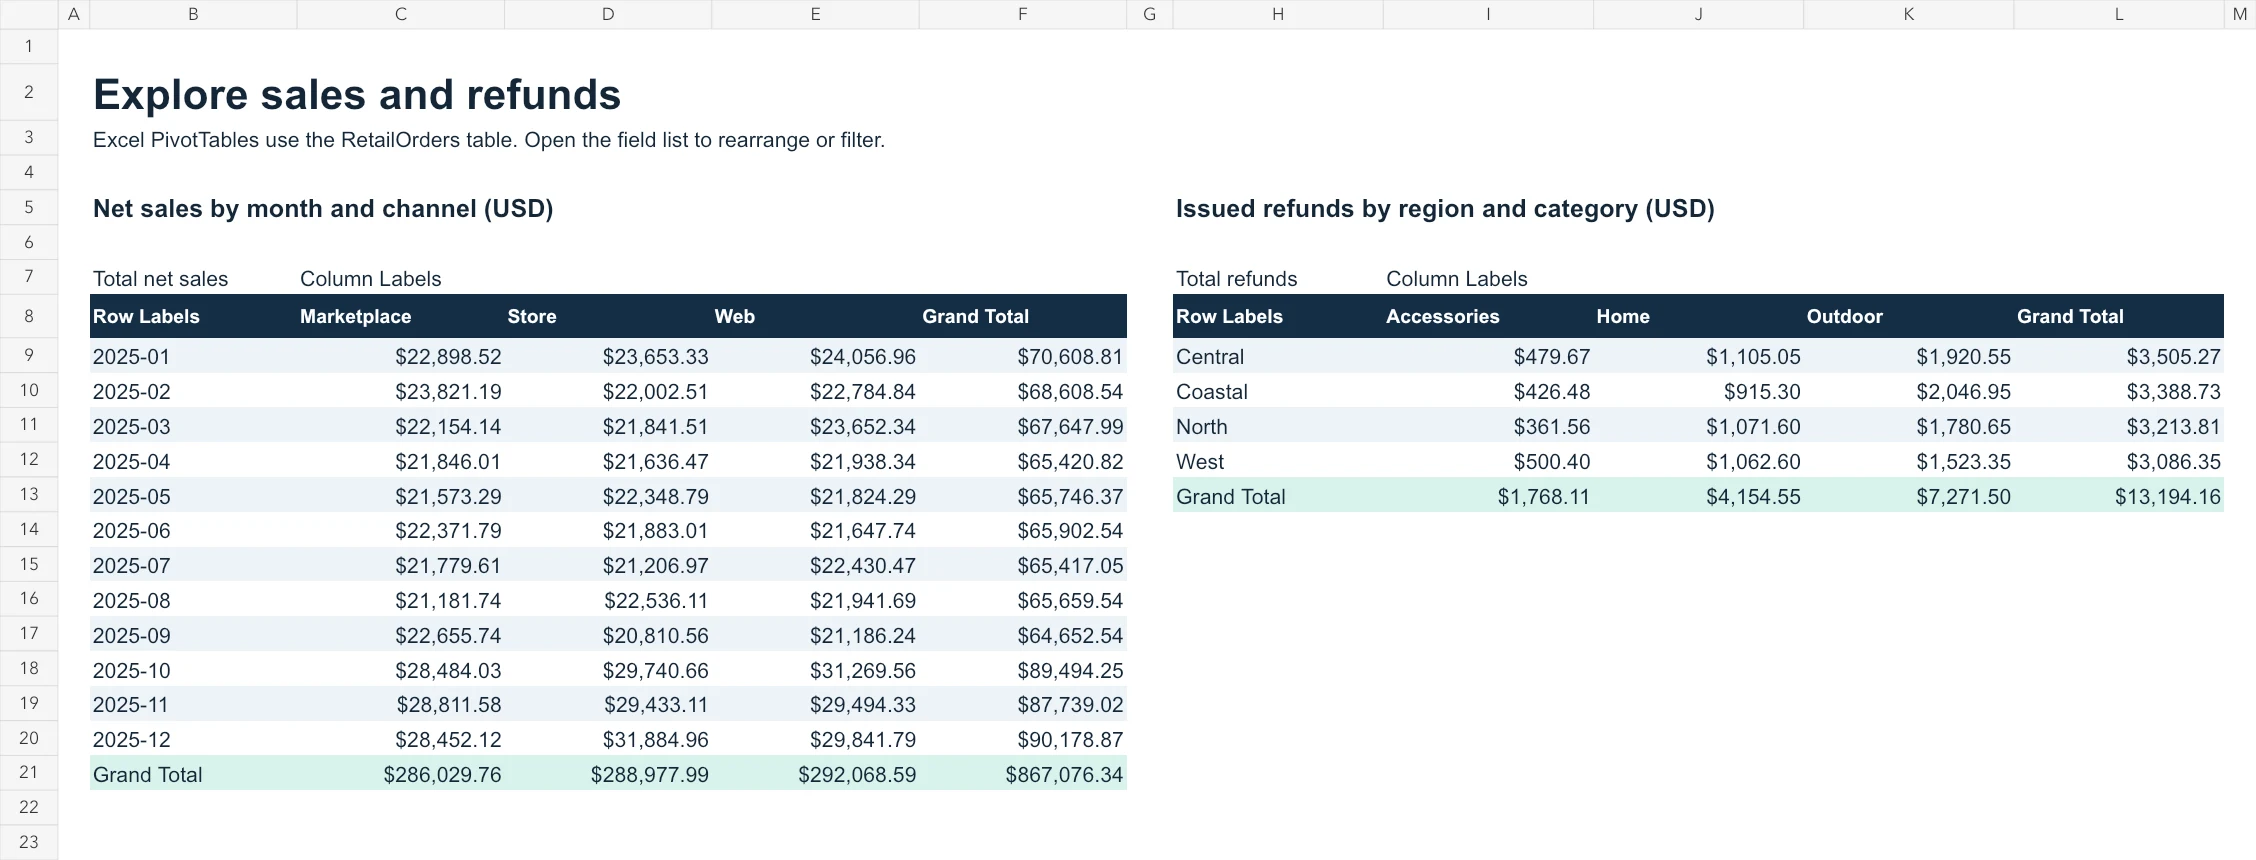
Native PivotTables compare net sales by month and channel, and issued refunds by region and category.
0 likes · 0 views · Nov 14, 2026
An Excel dashboard and PostgreSQL workflow for a fictional retailer, with two PivotTables and SQL reconciliation.

