TOTAL QUALITY MANAGEMENT PRACTICES AND CUSTOMER SATISFACTION
Brian Muchiri
IN INSTITUTIONS OF HIGHER LEARNING IN KENYA
(CASE OF SELECTED UNIVERSITIES IN NAIROBI COUNTY)
BY
WINNIE MUTHONI MUCHIRA
A RESEARCH PROJECT SUBMITTED TO THE SCHOOL OF BUSINESS
IN PARTIAL FULFILLMENT OF THE REQUIREMENTS FOR THE
AWARD OF THE DEGREE IN MASTER OF BUSINESS
ADMINISTRATION (STRATEGIC MANAGEMENT OPTION) OF
KENYATTA UNIVERSITY
ii
DECLARATION
I hereby declare that this research project is my original work and has not been presented for
award for a degree at this or any other university.
Signature ………………………… Date ……………………………….
WINNIE MUTHONI MUCHIRA
D53/OL/CTY/24678/2014
SUPERVISOR
This is to declare that this research project has been submitted for examination with my approval
as the university supervisor.
Signature ……………………… Date ……………………………….
MR. SHADRACK BETT
LECTURER, DEPARTMENT OF BUSINESS ADMINISTRATION
SCHOOL OF BUSINESS
KENYATTA UNIVERSITY
iii
TABLE OF CONTENTS
DECLARATION ............................................................................................................ ii
TABLE OF CONTENTS ............................................................................................... iii
LIST OF TABLES ......................................................................................................... vi
LIST OF FIGURES ...................................................................................................... vii
DEDICATION ............................................................................................................. viii
ACKNOWLEDGEMENTS............................................................................................ ix
ABSTRACT ................................................................................................................. xii
CHAPTER ONE: INTRODUCTION........................................................................... 1
1.1. Background of the study ........................................................................................... 1
1.1.1 The Concept of Total Quality Management ............................................................ 2
1.1.2. Customer satisfaction in institution of Higher Learning ......................................... 4
1.1.3. Institutions of higher learning in Kenya ................................................................. 6
1.2 Statement of the problem ........................................................................................... 7
1.3. Objective of the study ............................................................................................... 9
1.3.1. General Objective .................................................................................................. 9
1.3.2. Specific Objective ................................................................................................. 9
1.5. Significance of the Study ........................................................................................ 10
1.6 Scope of the Study................................................................................................... 11
1.7. Limitations of study................................................................................................ 11
CHAPTER TWO:LITERATURE REVIEW ............................................................. 12
2.0. Introduction ........................................................................................................... 12
2.1. Theoretical Literature Review ................................................................................ 12
2.1.1. Deming Theory ................................................................................................... 12
2.1.2. Kaizen Theory ..................................................................................................... 14
2.1.3. System Theory .................................................................................................... 15
2.1.4. Expectancy Disconfirmation Theory .................................................................... 16
2.2 Empirical Literature Review .................................................................................... 17
2.2.1. Customer Focus and its Effect on Customer Satisfaction ..................................... 17
2.2.2. Management commitment and its Effect on Customer Satisfaction ...................... 19
2.2.3. Continual Improvement and its Effect on Customer Satisfaction .......................... 21
2.2.4. System /Process Approach and its Effect on Customer Satisfaction ..................... 23
2.2.5. Customer Satisfaction .......................................................................................... 25
iv
2.3. Critical Review of Major issues .............................................................................. 27
2.4. Summary of the knowledge gaps ............................................................................ 28
2.5 Conceptual Framework ........................................................................................... 29
CHAPTER THREE: RESEARCH METHODOLOGY ............................................ 32
3.1. Introduction ............................................................................................................ 32
3.2. Research Design ..................................................................................................... 32
3.3. Location of the study .............................................................................................. 32
3.3.1. Target Population ................................................................................................ 33
3.3.2. Sampling and Sampling Procedure ...................................................................... 34
3.4. Data Sources and Collection Instruments ................................................................ 35
3.4.1. Pilot Survey ......................................................................................................... 35
3.4.2. Reliability of Research instruments ..................................................................... 36
3.4.3. Validity of Research instruments ......................................................................... 36
3.5. Data Analysis and Presentation .............................................................................. 37
3.5.1. Diagnostic Tests .................................................................................................. 38
3.6. Data Management and Ethical Consideration.......................................................... 39
CHAPTER FOUR:RESEARCH FINDINGS AND DISCUSSION ........................... 40
4.1 Introduction ............................................................................................................. 40
4.2 Response Rate ......................................................................................................... 40
4.3. Demographic Profile of the Respondents ................................................................ 41
4.3.1 Gender of Respondents ......................................................................................... 41
4.3.2 University of Study .............................................................................................. 41
4.3.3 Mode of Study ...................................................................................................... 42
4.4 Responses on Specific Variables ............................................................................ 43
4.4.1 Customer focus and Customer Satisfaction ........................................................... 43
4.4.2 Management Commitment and Customer Satisfaction .......................................... 44
4.4.3 Continuous Improvement and Customer Satisfaction ............................................ 46
4.4.4 System /Process Approach and Customer Satisfaction .......................................... 47
4.4.5 Dependent Variable: Customer Satisfaction .......................................................... 48
4.5 Diagnostic Tests ...................................................................................................... 49
4.5.1 Testing for Multicollinearity ................................................................................. 49
4.5.2 Testing for Heteroscedasticity .............................................................................. 50
4.5.3 Testing for Normality of Residuals ....................................................................... 51
4.6 Inferential Analysis ................................................................................................. 52
v
4.6.1 OLS Regression Analysis ..................................................................................... 52
4.6.2 Coefficient of Determination ................................................................................ 54
4.6.3 Analysis of Variance ............................................................................................ 54
4.6.4 Hypothesis Testing using the Multiple Regression Model ..................................... 55
CHAPTER FIVE:SUMMARY OF FINDINGS, CONCLUSION AND
RECOMMENDATIONS ............................................................................................ 57
5.1. Introduction ............................................................................................................ 57
5.2. Summary of Findings ............................................................................................. 57
5.2.1. Effect of Customer focus on customer satisfaction ............................................... 57
5.2.2. Effect of Management commitment on customer satisfaction............................... 58
5.2.3. Effect of Continuous Improvement on customer satisfaction................................ 58
5.2.4 Effect of system/Process approach on customer satisfaction ................................. 59
5.3. Conclusions ............................................................................................................ 59
5.3.1. Customer focus .................................................................................................... 59
5.3.2. Management commitment ................................................................................... 60
5.3.3. Continuous improvement ..................................................................................... 60
5.3.4. System/Process Approach .................................................................................... 60
5.4 Recommendation for Policy and Practice ................................................................ 61
5.5 Suggestions for further studies ................................................................................. 61
REFERENCES ............................................................................................................. 62
APPENDICES ............................................................................................................. 66
APPENDIX 1: RESEARCH QUESTIONNAIRE.......................................................... 66
APPENDIX II: INTROCUTION LETTER ................................................................... 71
vi
LIST OF TABLES
Table 3.1 Target Population .......................................... Error! Bookmark not defined.3
Table 3.2 Sample Size ................................................................................................... 34
Table 3.3 Reliability Analysis ......................................... Error! Bookmark not defined.
Table 4.1 Response Rate ............................................................................................... 40
Table 4.2 Gender of Respondents .................................... Error! Bookmark not defined.
Table 4.3 University of Study .......................................... Error! Bookmark not defined.
Table 4.4 Mode of Study ................................................. Error! Bookmark not defined.
Table 4.5. Customer focus and customer satisfaction ....... Error! Bookmark not defined.
Table 4.6. Management Commitment and customer satisfactionError! Bookmark not defined.
Table 4.7 Continuous improvement and customer satisfactionError! Bookmark not defined.
Table 4.8: System/ Process approach and Customer satisfactionError! Bookmark not defined.
Table 4.9. Customer Satisfaction ..................................... Error! Bookmark not defined.
Table 4.10 Testing for Multicollinearity .......................... Error! Bookmark not defined.
Table 4.11. Testing for Heteroscedasticity ....................... Error! Bookmark not defined.
Table 4.12 OLS Regression Analysis Coefficients........... Error! Bookmark not defined.
Table 4.13 Coefficient of Determination ......................... Error! Bookmark not defined.
Table 4.14 Analysis of Variance ...................................... Error! Bookmark not defined.
vii
LIST OF FIGURES
Figure 2.1. Plan – do-Check-Act Model .......................... Error! Bookmark not defined.
Figure 2.2. System/Process Approach Model .................. Error! Bookmark not defined.
Figure 2.3: Conceptual Framework ................................. Error! Bookmark not defined.
Figure 4.1. Testing for Normality of Residuals ............... Error! Bookmark not defined.
viii
DEDICATION
This research project is dedicated to my parents, my husband and children, friends for the
support they have given me in my pursuit for further education.
ix
ACKNOWLEDGEMENTS
I wish to express my sincere appreciation to Almighty God for being my guide in my academic
journey. I also wish to thank the management, administrative staff and lecturers at Kenyatta
University for their endless support and providing an environment for academic excellence.
Special thanks to my supervisor, Mr. Shadrack Bett for his invaluable advice and motivation
throughout the entire period of project writing.
Finally, I salute all my family and friends for their words of encouragement and for giving me
strength in the whole process of writing the research study.
x
ACRONYMS AND ABBREVIATIONS
CPI - Continuous Process improvement
CUE - Commission for University Education
PDCA – Plan-Do-Check- Act
TQM - Total Quality management
USIU - United States International University
xi
OPERATIONAL DEFINITION OF TERMS
Total Quality Management Management philosophy that seeks to integrate all
organizational functions to focus on meeting customer
needs and organizational objectives.
Customers’ External customers who provide income for the
organization through purchase of goods and services.
Customer satisfaction Result achieved when service provided responds to
customers’ needs and when the company meets or exceeds
customer’s expectation.
Customer Focus Extent to which an organization satisfies customer
requirements and their expectations.
Management commitment Concern shown by the management towards maintaining
and improving quality system in an organization.
Continuous Improvement Philosophy of continually seeking ways to improve the
operations.
System/Process Approach Application of a system of processes within an
organization, together with the identification and
interaction of these processes, and their management.
Higher Education Institutions Higher education institutions in the Kenya comprises of
public and private universities, polytechnics, institutes of
technology and teachers training institutes.
.
.
xii
ABSTRACT
Total Quality Management has been proposed to improve customer satisfaction and has received
considerable attention in the recent studies. Despite the recent effort on Total Quality
Management, little work has been done on the effect of TQM on Customer satisfaction in
institutions of higher learning in Kenya. This study sought to establish the effect of Total Quality
Management practices on Customer satisfaction in institutions of higher learning in Kenya. A
case of selected universities in Nairobi County. The general purpose of the study was to
investigate the effect of total quality management practices on customer satisfaction in
institutions of higher learning and the specific objective was to examine the effect of customer
focus, management commitment, continual improvement of products and services and
systems/process approach on customer satisfaction in institutions of higher learning in Kenya.
The findings were expected to be significant to all the stakeholders of higher learning
institutions. The target population comprised of the undergraduate students pursuing Bachelor of
Commerce in the Private and Public Universities. The scope of the study targeted selected
universities in Nairobi County with a focus of KCA University and University of Nairobi. The
theories that anchored the study included Deming Theory, Kaizen theory, System theory and
Expectation Disconfirmation theory. This study used a descriptive research design. The unit of
analysis in this study was registered Bachelor of Commerce degree students in University of
Nairobi and KCA University. The study was based on primary data. The data was collected
through a semi – structured questionnaires targeting full time and part time degree students in the
two universities. Content Validity Index was used to establish whether the questionnaire
measured what it was intended to measure. Test – Retest reliability was done where Cronbach’s
Alpha was used to measure reliability. The threshold for reliability was a Cronbach’s alpha that
was equal to or greater than 0.7 and the study instrument was found to be reliable. Both
descriptive and inferential statistics were used in analysis of data. The data was presented in
frequency tables and percentages. The coefficients of all the independent variables were positive
and statistically significant. The study found customer focus to take the lead as the most
significant variable for customer satisfaction (β = 0.677, p = 0.000). The system/process
approach was the least significant variable for the study (β = 0.049, p =0.013). The ANOVA F
test p value was less than 0.05 to indicate that the overall model was significance. The analysis
also indicated that the study variables were predictors of customer satisfaction. The study
concluded that all the four independent variables of the study should be considered in the
decision making of the institutions of higher learning with more emphasis on customer focus.
The study recommends that higher learning institutions should strive to focus on the
conformance to customer requirements and continuous improvement in order to gain customer
satisfaction.
1
CHAPTER ONE
INTRODUCTION
1.1. Background of the study
This chapter displays an outline of Total Quality management and customer satisfaction. It gives
authentic advancement of the higher education division in Kenya, outlines the research problem,
research objectives and the significance of the investigation.
Total Quality Management has been received as administration paradigm by organization
countrywide. Rawlins (2008) indicated that, TQM primary target is to change the general culture
of the organization by dispensing with the view that mistakes are inescapable and that
examination and firefighting are along these lines some portion of regular day to day existence.
TQM is a method for figuring out how to enhance adequacy and adaptability of an organization.
Total Quality Management suggests that organizations are fixated in meeting or surpassing client
desires, with the goal that their clients are delighted. With a specific end goal to win new
business and continue existing business, it is fundamental for organizations to comprehend their
client needs and desire (Besterfiled, 2003).
Customer satisfaction has been characterized as a person's sentiments of delight or dissatisfaction
coming about because of contrasting item's apparent performance in connection with his or her
desire (Kotler and Keller, 2006). Customer satisfaction has likewise been characterized as the
outcome accomplished when administration or item includes react to clients require and when
the organization meets or surpasses client's desire over the lifetime of an item or administration
(Juran, 1991). Bolton and Drew (1991) portrayed customer satisfaction as judgment influenced
2
in view of a particular administration to experience. The Higher education sector is one of the
biggest developing ventures in Kenya (Economic Survey 2012). Higher education foundations in
the Kenya includes open and private colleges, polytechnics and institutes of technology. Total
Quality Management Practices in Higher education area is of incredible significance for
guaranteeing upgraded customer satisfaction and retention.
1.1.1 The Concept of Total Quality Management
Total Quality Management is an administration reasoning that grasps all exercises that guarantee
adjustment to the clients' needs and accomplishment of the hierarchical goals in a productive and
powerful way by boosting the capability of all representatives in a proceeding with drive for
development. TQM is an upgrade to traditional way of doing business. It is a demonstrated
method for ensured survival in a focused market. TQM is the specialty of dealing with the entire
to accomplish perfection which turns out to be a piece of the business procedure (Besterfiled,
2003). Total Quality Management is tied in with making a culture that is persistently arranged
towards expanding customer satisfaction while limiting expense.
TQM as a reasoning depends on an arrangement of eight standards: duty of the best
administration; strengthening of worker; Continuous change of procedures, items and
administrations; Customer center and introduction; process and framework approach; genuine
way to deal with basic leadership; culture creation or culture change; common advantageous
provider relationship (Evans,2008). It is additionally a rationality in light of essential ideas, for
example, top administration duty, Customer center, worker association, Continuous Process
Improvement, Supplier organization and Performance measures. The principle segments of Total
Quality Management rationality as distinguished by Khan (2003) is total client center, worker
strengthening, proceeds with change and utilization of methodical administration. The TQM
3
theory enables the association to accomplish persistent increment of customer satisfaction at a
consistently bring down cost. It additionally helps in guaranteeing viability and proficiency by
urging organizations to design, plan items and create frameworks that convey items fit in with
the desires of the client, Khan (2003).
For any organization to be successful, each and every piece of it must work appropriately
together on the grounds that each individual and each action influence and are thusly influenced
by others. TQM is a methodology and an operationalized procedure that looks to coordinate all
the hierarchical capacities and goals in a concentration of addressing clients' needs (Kumar,
2008). TQM accentuates the part of inside and outer clients, providers and the contribution of
workers in a journey for persistent change (Chang, 2006). TQM enables firms to fulfill clients'
needs, acquire a high level of separation, reinforce mark picture and lessen costs by averting
abandons. Sudha (2013) led an examination on impact of TQM standards in establishments of
higher learning. He discovered that dedication of best administration, course conveyance,
civility, grounds offices and client input and change greaterly affected customer satisfaction.
In the 1980s, the TQM procedure was connected effectively in ventures in the US. Many firms,
for example, Xerox, IBM and Motorola could enhance their business positions by conquering
dangers from worldwide rivalry by utilizing the TQM procedure (Lozier and Teeter, 2006). The
achievement of these organizations and others in utilizing TQM to bring them out of emergency
energized numerous US advanced education foundations to embrace it. Numerous
establishments in the created nations started to actualize TQM in the 1990s and have been
effective. The basic condition of instruction as far as student's evaluations, subsidizing and
grumblings from business and guardians affected them to rehearse TQM. Through the TQM
4
endeavors, these establishments have profited in having enhanced student execution, better
administrations, lessened expenses and customer satisfaction (Kanji and Tambi, 2009).
1.1.2. Customer satisfaction in institution of Higher Learning
Clients of higher learning institutions are separated into inside and outer gatherings relying upon
whether they are situated inside or outside the organization. Inward clients work towards the
fulfillment of outside clients. The outer gatherings involve the organization's partners to be
specific existing and potential students, managers, government and industry. (Oakland, 2009).
Higher education foundations are starting to concentrate on meeting students desires as well as to
surpass their desires until the point when they are enchanted. In the current years, the fulfillment
among students as to the instructive administration offerings has turned out to be more critical
for instructive establishments (Molesworth, 2009). It is essential to track, keep up, and enhance
the instructive administration nature of the offered instructive units. Training establishments
must comprehend the angles that can be utilized to convey large amounts of customer
satisfaction.
The higher instructive framework is in a market arranged condition where surpassing the client
desire is the lead of survival over the long haul (Sahney and Banwet 2004). In South Africa, the
expansion in the dropout rate and low throughput rate at both open and private colleges is a
major worry among nearby nationals and has made enthusiasm to insightful analysts Malele
(2011); Letseka and Maile (2008). Their examination discovered that client mind affected client
maintenance and on customer satisfaction. Customer satisfaction is viewed as the establishment
for upgrading client reliability and expanding piece of the overall industry of an organization
(Nimako and Azuman, 2009).
5
Joseph Juran, Edward Deming and Philip Kotler have all demanded client center and
introduction for accomplishment of a business endeavor. Once the expressed and inferred needs
are satisfied, at that point a client is said to be fulfilled. Once fulfilled, the client will keep on
buying a similar item from a similar brand unless affected by an outer power. Outer power could
be better value, administration or innovation. Whatever the outer power, fulfilled client will
dependably oppose the changeover to another item. Proof of customer satisfaction is repurchase
or rehash business and also winding up positive attitude diplomats for the association
(Mukherjee, 2006). Clients that are fulfilled will increment in number by alluding others,
influence rehash and regular to buy.
Customer satisfaction is a state of mind like judgment following an item/benefit utilization or
various collaborations with the item offer (Lovelock and Wirtz, 2007). Fulfillment involves
looking at how an item performs against the normal execution (Kotler and Kevin, 2006). For
quality administration to be effective a cozy relationship should be kept up .with the clients.
Conformance to client needs in an association influences piece of the overall industry and
customer satisfaction. Research directed by Dimitriades (2006) demonstrate that fulfilled clients
have a tendency to be less value touchy, less impacted by contenders, and remain faithful longer.
It is of vital significance for association to give its clients quality items and administrations that
fit in with their prerequisites at a sensible cost. Because of the national and overall rivalry, it is
critical for associations' to guarantee that their clients are fulfilled. Customer satisfaction is the
key factor in the association mission, vision articulation and quality arrangement (Besterfield,
2003).
6
1.1.3. Institutions of higher learning in Kenya
Higher education institution in the Kenya contains public and private colleges, polytechnics,
institutes of technology. The first Kenya institution of higher learning set up in 1956 was Royal
Technical college. This establishment was later renamed Royal college of Nairobi at that point
moved up to University of East Africa. Every nation later centered around building up their own
public and private colleges and disbanded the college of East Africa (Ngome, 2006). Through an
act of parliament, the university college was later renamed University of Nairobi in 1970. The
act was additionally responsible for the conceptualization of Kenyatta University that became
independent in 1985, later Jomo Kenyatta University college of Agriculture was established
(Davis and Eisemon, 2003).
In Kenya, Private higher education can be traced to the colonial time frame when missionaries
built up schools and universities for their Converts. St. Paul's United Theological college (1955)
and Scott Theological College (1962) were the first private institutions of higher learning. In
1970, the United States International University (USIU) set up grounds in Nairobi. The
university offered degrees from the parent universities abroad. The government did not offer
accreditation to these private colleges and universities. However, in the 1990's the expanded
interest for university education drove the government to empower the foundation and
accreditation of private colleges (Onsongo, 2007).
Higher Education ministry was entrusted with registration of these private colleges. In 1985, a
Commission for Higher Education (CHE) was set up through the Higher Education Act
(Cap210b of 1986) with an order to co-ordinate the advancement of higher education,
accreditation of private colleges and post-secondary organizations. However, under Universities
Education Act, 2012, CHE's command was extended to incorporate both private and public
7
university and subsequently its name changed to Commission for University Education (CUE).
CUE duties include to accredit universities in Kenya; regulate university education in Kenya;
authorize and assess university programs in Kenya; and advance quality research and
development (Waweru, 2014). There are 18 Private authorize colleges in Kenya and 30 public
licensed colleges in Kenya (CUE, March 2017).
1.2 Statement of the problem
Institutions of higher learning must enhance their conformance to client needs efforts to ensure
customers' needs are met. This is by caring for the customers’ desires and ensuring that the
organization meets the client specifications. It is important because customers have expectations
from the institutions they patronize and if the desires are not met, they get disappointed and they
stop patronizing with the organization. Once the organization neglects to meet the desires of the
clients, it cannot hold him//her. Institutions must ensure that they conform to customers’
requirements to gain client faithfulness, referrals and retention. Mrig (2012), led an examination
in United States on 79 institutions of higher learning on customer care. The examination
discovered that the workers were more centered around fulfillment of tasks as opposed to
accomplishment of students centered results and did not have the time and better ways of how to
give better services to students. The study found interested parties in higher learning institutions
complaining about the customer care which had a direct influence on customer satisfaction.
Shandadnejad and Alroaia (2013) conducted a study on the impact of TQM in customer
satisfaction in higher learning organizations in Iran. The study concentrated on the five elements
of TQM in particular; tangibles, attitude, dependability, content and method of conveyance. The
discoveries of the investigation was that all the five elements had a great impact on customer
8
satisfaction. Sit, Ooi, Lin and Chong (2009), conveyed an exploration in Asia on Malaysia
service sector where they researched on the connection between TQM practices and customer
satisfaction. The investigation took a gander at six builds of TQM practices, for example,
Process Management, Strategic Planning, Customer Focus, and Human Resource center,
information and analysis. The study found a positive relationship of these builds with customer
satisfaction, Human Resource center and Information sharing leading the in the service sector.
Paneka (2013) also carried an exploration on the Total Quality Management and Customer
satisfaction in education institution in South Africa. The study sought to determine the viability
level of the Total Quality Management practices in Student services, infrastructure and
Instruction. The investigation found no connection between the quality of the practices of the
institutions and effectiveness level.
In Kenya, studies have been carried out on the relationship between quality and customer
satisfaction among university students in Kenya. Owino (2013) carried a study on the influence
of service quality on customer satisfaction among university students in Kenya. He found out
that service quality fundamentally impacted customer satisfaction in organizations of higher
learning. He discovered human element reliability greatly affected student satisfaction. Another
research conducted by Arango (2014) on effect perceived quality on customer satisfaction, found
the drivers of customer satisfaction among university students in Kenya to be perceived value,
product and service quality. Mate (2011) also conducted a research on the connection between
customer service strategies and customer satisfaction with an emphasis on service quality in the
media transmission industry.
Based on the study background on the relationship between TQM Practice and customer
satisfaction, knowledge gaps have been identified. Past research has taken a gander at the
9
connection between Total Quality Management and Customer satisfaction in institutions of
higher learning in Kenya. Key among them is that past research has been done on the impact of
TQM on customer satisfaction in light of the hypothetical system of Malcolm Baldrige National
Quality Awards (MBNQA) (Keng and Bishan, 2011; Prajogo and McDermoth, 2005; Terziovski,
2006). Indeed, even the most known service quality method, SERVQUAL has been found to
adjust the quality in the education context ( Owino, 2013; Arango 2014; Parasuraman, Berry and
Zeithaml, 1988; In'airat and Al-Kassem, 2014). This study therefore sought to establish the effect
of TQM practice and Customer satisfaction on the theoretical framework of Deming Prize
quality award model and European Foundation for Quality Management (EFQM) KM model.
The investigation tried to discover the connection between Total Quality Management Practices
and customer satisfaction in institutions of higher learning in Kenya.
1.3. Objective of the study
1.3.1. General Objective
The general purpose of the study was to investigate the effect of total quality management
practices on customer satisfaction among selected universities in Nairobi County, Kenya.
1.3.2. Specific Objective
The study aimed at achieving the following specific objectives;
1. To examine the effect of customer focus on customer satisfaction among selected universities
in Nairobi County, Kenya.
2. To determine the relationship between management commitment and customer satisfaction
among selected universities in Nairobi County, Kenya.
10
3. To assess the extent to which continual improvement of products and services affects
customer satisfaction among selected universities in Nairobi County, Kenya.
4. To find out how systems/process approach to quality affects customer satisfaction among
selected universities in Nairobi County, Kenya.
1.4. Research Hypothesis
H01: Customer focus has no significant effect on customer satisfaction among selected
universities in Nairobi County, Kenya.
H02: Management Commitment has no significant effect on customer satisfaction among
selected universities in Nairobi County, Kenya.
H03: Continuous improvement has no significant effect on customer satisfaction among
selected universities in Nairobi County, Kenya.
H04: System /Process Approach has no significant effect on customer satisfaction among
selected universities in Nairobi County, Kenya.
1.5. Significance of the Study
The discoveries are expected to be pivotal and critical to all the partners of higher learning
establishments. The directors and representatives are expected to know the significance of
customer satisfaction. The discoveries of this study will help with enhancing customer
satisfaction in the Higher learning establishments. It will be pertinent to administrators who
effectively want to execute TQM in their organizations since it will help them in making their
foundations ISO confirmed. The investigation will include to existing writing Total quality
administration and customer satisfaction.
11
1.6 Scope of the Study
The study concentrated on Total Quality management and customer satisfaction of higher
learning institutions in Kenya. In particular, the researcher considered Customer focus
management commitment and continuous improvement and System/Process approach as aspects
of quality management. Indicators of customer satisfaction included; eagerness to allude other
students to the university, willingness to attend the same university for furthering of education
and the willingness to be an active alumnus. The investigation concentrated on Bachelor of
Commerce students of KCA University and University of Nairobi. Given that higher learning
institutions work under similar standards and rules, the outcomes explained the effect of Total
Quality Management practices on Customer Satisfaction on other institutions of higher learning
in Kenya.
1.7. Limitations of study
Some of the limitations of the study were that the respondents were not accessible to respond to
the questionnaire while others were not willing to respond. To overcome this, the researcher
educated the respondents that the outcome was to be used for scholarly reason. The researcher
also guaranteed the respondents that their identity would remain anonymous. The researcher also
gave the respondents an introduction letter from the university to assure them that the research
was being conducted for academic purpose only. Another limitation was that some of the
reactions from the respondents were not valid to the study.
12
CHAPTER TWO
LITERATURE REVIEW
2.0. Introduction
This section looked at the previous researches done by various authors. The section covered
theoretical framework, empirical review, and conceptual framework and research gaps.
2.1. Theoretical Literature Review
This section looked into theories that relate to Total Quality Management practices and
Customer satisfaction.
2.1.1. Deming Theory
Deming (1986) characterizes quality as "fulfilling the client, not only to live up to his desires, but
rather to surpass them". Deming's theory consequently begins and completes with the clients.
The best TQM programs start by characterizing quality from the client's point of view (Arusu
and Paul, 2005). Customer satisfaction is accomplished when their desires are coordinated by
what is offered to them by the association. The Deming Theory is composed with the goal that
supervisors can take in however much as could be expected from each client collaboration and to
enhance the way toward conveying an incentive to every future client. Deming showed that
quality ought to be gone for satisfying present and future buyer needs.
Deming (1986) focused on the obligations of best administration to lead the pack in changing
procedures and frameworks. He stressed the significance of upgrade of representative abilities,
making of provider association, utilization of useful groups to distinguish and tackle quality
13
issue, recognizable proof and estimation of client necessities, investment of workers and quest
for consistent change. Deming approach concerns the formation of an association framework that
encourages participation and practices which thus prompts constant change of procedures, items
and administrations and also representative satisfaction both which are basic to customer
satisfaction and at last firm survival (Anderson, 2004). Ross (2002) demonstrated that quality
begins in the meeting room. Quality administration should direct the battle for quality.
Deming logic is given in his fourteen focuses as takes after; Management must make the
motivation behind the association; Top administration and everybody in the association must
learn on the new logic in the association; comprehend the reason for assessment; Stop granting
business in view of cost alone; administration must assume greater liability for issues by
currently finding and adjusting issues with the goal that quality and efficiency are consistently
and for all time enhanced; each worker must be situated to the association rationality of
responsibility regarding nonstop upgrades; instruct and establish initiative; Management must
empower open and compelling correspondence; Management must streamline cooperation to
accomplish the reason for the association; wipe out urgings for the workforce and numerical
standards for the work constrain; take out administration by destinations and furthermore
evacuate boundaries that burglarize individuals ride of workmanship and everybody ought to be
prepared as the association expects change to meet the evolving condition.
In studying the hypothesis, administration must acknowledge the essential duty regarding the
persistent change of the procedure. Administration must be committed, included and accessible if
the association is to prevail with regards to executing the new logic. This hypothesis is pertinent
14
to the investigation it portrays the significance of the customer focus and management
responsibility in guaranteeing that the association fits in with the client prerequisites. This theory
is relevant to the study it depicts the importance of the customer focus and management
commitment in ensuring that the organization conforms to the customer requirements.
2.1.2. Kaizen Theory
The Kaizen theory was developed by Masaaki Imai in 1985. The theory is a long term approach
to work that systematically seeks to achieve small and incremental changes in processes in order
to achieve more efficiency and quality. This Japanese hypothesis is centered around a rationality
revolved around continuous change in ventures, business procedures, and administration.
Nonstop changes allude to steady refinement and change of items, administrations and
hierarchical framework to yield enhanced an incentive to customers (Arusu and paul, 2005). It is
a theory that accept that each part of our lives should be continually made strides. It characterizes
administration part in constantly promising, and executing little enhancements including
everybody.
Total Quality Management is a procedure that requires persistent advance of approaches,
methodology and control composed by administration. Associations should attempt endeavors to
consistently alter all points of their operation. With a specific end goal to accomplish consistent
change, supervisors ought to guarantee enhanced competency levels. The kaizen technique for
consistent change is a Japanese administration idea meaning incremental change. Association
administrators and directors ought to guarantee that the procedure of ceaseless change is the step
by step incremental that make the procedure more proficient and successful. Add up to Quality
Management process endeavors consistent endeavors enhancements to all capacities in the
association that outcomes in expanded customer satisfaction and enjoyment for clients (Yousaf,
15
2006). The significance of the this hypothesis to the investigation is that Kaizen hypothesis
concentrates on the constant change of items and administrations with a specific end goal to
guarantee customer satisfaction.
2.1.3. System Theory
System theory was proposed by Von Bertalanffy in 1946. System theory concentrates on
interaction of components. Von Bertalanffy fosters systems thinking in all disciplines in order to
find general principles valid to all systems. Von Bertalanffy (1956) defined a system as an
interaction of complex components. Systems are either open or shut. Open systems involves
exchange of people and information. Closed systems do not have trades with the external
environment from the yield reactivates the framework. Social organization are open frameworks
due to their exchanges with the environment, An open framework connects with its environment
by way of inputs, throughputs, and outputs (Katz and Kahn 2003).
Quality managers should concentrate on the connection between system thinking and Total
Quality Management (Senge and Sterman, 2005). Organizations that focus on TQM endeavors
ought to accentuate on the relationship of the distinctive parts with a specific end goal to
accomplish the association objectives and destinations. Supervisors should center their endeavors
in guaranteeing every one of the workers think deliberately. With a specific end goal to ensure
the survival of the entire framework, directors need to design basic changes by planning new
plans, change and rethinking the authoritative structure (Mele and Colurcio, 2006). For an
organisation to promote sustainable and long lasting performance, this adaptive and proactive
conduct ought to be founded on system theory. This theory supports that system/process
approach to quality management provides information to the organization by connecting inputs
16
to output. Organization can utilize this hypothesis to affirm achievement or to flag that a
correction to the framework should be made.
2.1.4. Expectancy Disconfirmation Theory
Expectation is utilized to decide the customer satisfaction levels. A client experiences fulfillment
if the product or services complies with his/her necessities and unsatisfied if there is non-
conformance of the products and services (Edvardsson, 2005). At the point when the product or
service execution surpasses the client desire, the client becomes delighted. Gronroos (2007),
indicated that customer satisfaction is comparing perceived quality and perceived performance.
Disconfirmatory hypothesis, leading hypothesis in customer satisfaction, expresses that
fulfillment is because of satisfaction levels endless supply of a specific product or service
(Ekinci, 2004). Fulfillment is as a result of comparing actual performance of the product or
services against the set benchmarks. Mattila and O'Neill (2003) demonstrated that service
delivery influences the result of an experience. Regardless of the product features and price, a
mishandled client won't feel fulfilled since each client needs to feel valued.
Organizations uses input in order to measure a product performance. Input may be in type of
chance cost, cost of procurement, energy and time. At the point when the inputs matches the
yield got, at that point a client gets a positive disconfirmation. At the point when the client input
surpasses the yield, at that point the client is said to get a negative disconfirmation. At the point
when the yield surpasses the client input, the client is said to be highly fulfilled. Wang and Hing
(2008) indicated that information about an organization products and services helps in
guaranteeing customer satisfaction. Organization ought to ensure that they avail all the
information about products and services to their customers with a specific end goal to empower
them settle on rational choices and also for accomplishment of customer satisfaction. At the
17
point when the desires of the clients are not met, the clients stay unsatisfied. Organizations are
required to guarantee that the product performance meets product desires. This will enable the
organization to accomplish high levels of customer satisfaction. This theory supports the
dependent variable by indicating that customer satisfaction is of paramount importance to
customers that patronize in an organization.
2.2 Empirical Literature Review
This section looked at studies and other researches done by other authors in similar fields. The
section looked also at the objectives of the study.
2.2.1. Customer Focus and its Effect on Customer Satisfaction
Zhang (2008) defined customer focus as the fundamental building piece of Total Quality
Management. It is how much an organization ceaselessly meets client needs and desires. It
includes deciding client needs and meeting the requirements with a specific end goal to
accomplish customer satisfaction. Organizations must do it right the first time and every time for
customer satisfaction to be accomplished. Customer Focus emphases on recognizing the client
needs and prerequisites and fulfilling them to meet the organizational objectives. Client focus
and fulfillment are essential ideas of quality management. Numerous researchers characterize
quality as meeting client prerequisites and requirements until the point when they are fulfilled
(Ishikawa, 2007 and Kanji, 1990). Customer focus and fulfillment ought to be viewed as the
main thrust for the entire quality process.
In the present business environment, organizations are compelled to put customers as the main
focus for the organization. The management have understood that the survival of the
18
organization is reliant on addressing the client's needs and guaranteeing that the client is fulfilled.
Customer focus is one of the key target in an organization. There is need for management to
allocate resources to meet clients' necessities and eventually customer satisfaction. In deciding
quality, client is viewed as the king in the organization. Therefore, building the organization with
the clients needs in mind will enable the organization to have products and services that conform
to customers requirements (Deming, 1986).
Pekar (2005) showed that there are two types of clients. External clients give salary to the firm
through buy of products and services while inner clients (workers) fulfill the necessities of the
external clients. For firms to fulfill their external clients, they should treat the internal clients
with care and consideration (Conduit and Mavodo, 2007). Client orientation applies to various
aspects of the business from front line staff interaction with clients to top management staff
relation with clients. Kennedy and Lassk, (2008), indicated that client focus is organization
concern with past, present and future clients' needs, requirements and desires. Organization
ought to have a solid sense of responsibility regarding understanding and fulfilling the clients in
a proactive way for long term growth.
Pekar (2005) indicated that Managers must build up a state of mind that puts the client in each
choice made. This is on account of the client is the motivation behind why a business is in
presence. Without the clients, there are no necessities to meet and no activity to be finished. The
higher education sector must focus on their clients in order to stay competitive in the market
(Sahney and Banwet 2004). To completely comprehend the necessities of the clients and to meet
their prerequisites, firms must keep up a healthy relationship with its clients. The way to
19
effective quality management practice is to acquire information about their clients' needs and
requirements. Mallak and Lyth, (2003) showed that to be effectively centered around clients,
firms must guarantee that there are being receptive to their clients' needs. Every one of the
workers must be prepared and taught on significance of client responsiveness all through the
firms’ life. For firms to pick up a Customer centered culture, it should ceaselessly and always
guarantee that it is fitting in with prerequisites of its clients.
2.2.2. Management commitment and its Effect on Customer Satisfaction
Besterfield (2003) defined top management as the individual who directs an organization at the
highest level. Commitment can be defined as a state of attachment that explains the relationship
between an actor and an entity. The actor may be a single individual, a group of persons (e.g.
project team) or an organization. Unfortunately, commitment is not a substantial thing thus to
make it certain, one must have solid systems. Commitment is a great social value, everyone top
to bottom, wants to have this value (Yousaf, 2006). Management commitment is a continuous
and active demonstrations that everybody in the organization needs to meet client expectations.
Without strong management commitment, the organization will not have a successful quality
management system (Sanjay and Shaughnessy, 2008). Top Management must think of a quality
arrangement that demonstrates an organisation sense of duty regarding quality administration
rehearses. Quality policy indicates top management sense of duty regarding quality, clients'
prerequisites, organisation vision and mission, continual improvement of products and services
and to education and training (Oakland, 2003).
For survival of todays' higher learning foundations, it is vital to address the clients' issues and
prerequisites and to surpass their desires. Responsibility of top executives can help an
organization to accomplish the goal of customer satisfaction. The contribution of quality gurus
20
demonstrates that organizations initiative majorly affects premise of value products, services and
procedures. For any quality activity to be fruitful, management responsibility is required as it is
viewed as a backbone for effective implementation. Management must convey to the employees
on the significance of meeting customer requirements. Top administration must concentrate on
its workers through training, empowering and providing rewards with a specific end goal to give
quality service to the clients. Besterfield (2003) demonstrated that when administration are keen
on enhancing quality, workers will be furnished with all the essential assets.
Top Management must practice the rationality of Management by Wandering around (MBWA).
Administration ought to leave their workplace and visit the offices and plants inside the
organizations. They should guarantee that the groups decision is lined up with the quality
articulation of the firm. Management must give resources to train the workers. It is of
significance that the administration reward the workers who have ceaselessly demonstrated
quality endeavors. Client input is critical to the top management since it helps in quality decision
making. Management must fit in with the necessities and prerequisites of the internal and
external customers. They should have the capacity to breakdown barriers, drive fear out of the
firm, minimize resistance to change. Senge (2008) led an investigation on duty of top
management and changing the operational theory of the association. He discovered that
dedication of best administration is of great significance to the achievement of any change to
quality exertion.
21
When top management do not offer organizational suppport, the conduct of the workers is
probably not going to change. When top management is focused on the firm, then change will
likely be effectively actualized. Top management plays a key role in the continuous changes of
critical areas such as customer focus, product advancement and development (Hoffman and
Hagerty, 2004). For workers to progress up the corporate ladder they have to impress the top
managers. Commitment of top management to a given technique empowers the employees to
think of ways in which they can impress the senior administration. With the help of top
administration, workers at all levels will probably contribute time and push to the arranged
change program. Top management responsibility regarding the quality change makes the
execution of quality to be successful and that the firms adjusts to the client prerequisites (Spector
and Beer, 2004).
2.2.3. Continual Improvement and its Effect on Customer Satisfaction
Continual Improvement depends on a Japanese idea called Kaizen, which is a rationality of
consistently looking for approaches to enhance the operations. It includes recognizing
benchmark of the best practice and ingraining a feeling of worker responsibility for process.
Constant Process change (CPI) is an endless exertion of finding and eliminating the main causes
of problems in the organization. Continuous process improvement focuses on making things
better and strives for perfection (Arasi and Paul 2005). Nonstop change is an idea that perceives
that quality change is an endless procedure and there is need to persistently search for new
methodologies for quality change. This idea of ceaselessly enhancing procedures and products
empowers organizations to create quality products that prompt customer satisfaction. The
competition pressure and the changing tastes and preferences of the clients incites the
organizations to embrace proactive methodologies keeping in mind the end goal to retain and
22
gain market share. Organizations must consistently enhance their procedures to survive in an
aggressive market.
Firms that exercise consistent change always enhance their client benefit and organizational
performance. This helps in reinforcing the organization competitive position and ability to be
receptive to clients' needs. For consistent change to be practiced, an organization needs to
comprehend where it is and where it is going. Organizations has to know the basic execution
indicators that measure customer satisfaction. Consistent change can not happen inside an
organization unless employees are undertaken through training. Worker contribution assumes a
key part in constant change program. It is a rationality of a ceaseless change that does not reach
an end when the set target has been accomplished. Nonstop change is a procedure that
management needs to perceive that however much the firm enhances, the competitors will
likewise enhance their operations and clients will expect more from the firm. Kanji (2007)
demonstrated that the point of firms that desire to attempt this training ought to comprehend that
ceaseless change is an incremental change not a noteworthy leap forward.
Besterfield (2003) characterized Deming cycle as an intuitive four-step management strategy
utilized as a part of business for the control and ceaseless change of procedures and items.
Association needs to design the goals and procedures to address clients' issues and association
arrangements, execute the progressions, screen and measure the procedures and announcing
comes about lastly adjust enhance and change the procedures. The quality administration
framework depends on the Deming wheel of Plan-Do-Check-Act Khan (2003).

23
Figure 2.1. Plan – do-Check-Act Model
Source: (Janakiraman and Gopal, 2006)
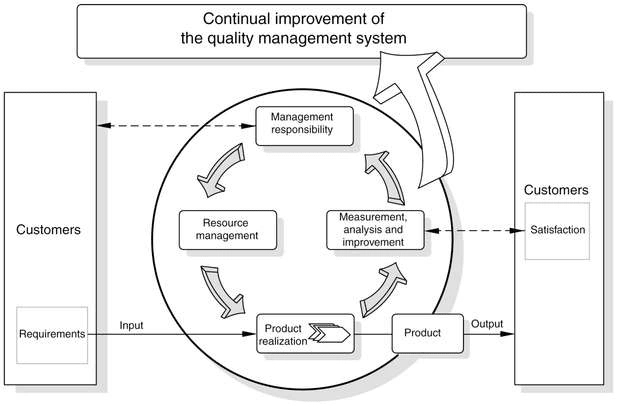
2.2.4. System /Process Approach and its Effect on Customer Satisfaction
System Approach is characterized as an arrangement of interrelated parts cooperating in
interrelated way to accomplish an arrangement of goals (Rue and Brays, 2008; Schermerhorn,
2005). System approach comprises of interdependent factors that include individuals, groups,
attitudes, motives, formal structure, interaction goal status and self-management (Robbins,
2008). Organization is seen as a system with parts, for example, employees, resources,
information and assets that form a complex framework. Firms accomplishes great things by
coordinating the commitments of individual to accomplish the common objectives
(Schermerhorn, 2005). Rue and Brays (2008) indicated that appropriation of PDCA Cycle as a
24
managerial function prompts the idea of process approach that partitions the whole business
operations as an interrelated linkage of procedures.
A process transforms input into value added output through managing the organizational
resources. Process approach rethinks the functions and organizational structure in various points
of view (Kanji and Tambi, 2009). Process Approach expresses that when activates and related
resources are managed as a process, the firm goal and objectives are accomplished all the more
effectively.
Process approach allows an organization to accomplish its objectives and goals viably and
through the effective utilization of resources. Robbins (2008) demonstrated that process
approach is an effective method for organizing and managing activities keeping in mind the end
goal to create value for the clients and other partners. One of the driving forces in the present
higher education sector is to meet the desires of the clients. Organization can adequately and
proficiently accomplish this by utilizing systematic and sound critical thinking approaches.
.
25
Figure 2.2. System/Process Approach Model
Source: (Kanji and Tambi, 2009)
2.2.5. Customer Satisfaction
Kotler (2006) defined customer satisfaction as the level of comparing a product perceived
performance in relation to customer expectations. Satisfaction is the difference between
perceived performance and expectations. Managers ought to guarantee they concentrate on the
requirements on the clients in their basic leadership. Client gives firms motivation to be in
business. Without customers, there is no activity to perform and no prerequisites to be met. Khan
(2003) indicated that for any organization to accomplish sustainable competitive advantage,
clients' ought to be pleased about the services given. An organization needs to concentrate on
offering some incentive to the clients in a more target way than the rivals keeping in mind the
26
end goal to hold and to allure new clients. At the point when the desires of the clients are met,
and surpassed, customer satisfaction is changed into customers delight.
It is of vital significance to guarantee that the firm’s clients are fulfilled and enchanted.
Enchanted clients influence rehash to buy and offer referrals to the organization. TQM advocates
managers and workers to be so client situated that they ceaselessly meet and surpass client
desires by finding better approaches to enhance their products, services and procedures.
Organizations ought to make a competitive environment that brings customer satisfaction. Kanji
(2007) showed that many organizations manage internal challenges and overlook the necessities
of the external clients. Higher learning organizations ought to request that their clients set client
fulfillments goals and measure their execution against the clients' desires Sahney and Banwet
(2004). Geysken (2009) discovered that customer satisfaction is essential in growing long haul
promoting objectives. Client disappointment ought not be overlooked by an association that
needs to construct a steadfast client base. Anderson and Fornell (2008) demonstrated that client
fulfillments gives an organisation favorable position of bringing down the cost of low quality.
Naumann (2007) pointed out that attention to customer satisfaction ought to be considered when
creating key plans for the business. At the point when the clients are fulfilled, the organisation
encounters market growth and development. Ingram and Chung (2007) detailed that receiving
TQM program moves moderately fulfilled clients of the organization to maximally fulfilled
clients. Dimiatriades (2006) revealed that it is lethal for business organization working in
exceedingly competitive business condition not to be client oriented. Organizations all through
the world are endeavoring to create products and services of superior value in order to
27
accomplish customer satisfaction. In an aggressive market, organizations that are client focused
and that deliver superior value to their clients will get by in the vicious business field. Fulfilled
clients have a tendency to be less impacted by contenders, less value delicate and remain faithful
longer.
2.3. Critical Review of Major issues
The study took a gander at the hypothetical system that assembled the empirical evidence on the
influence of Total Quality Management practices on customer satisfaction. The investigation
helped to enhance knowledge on Total Quality Management Practices especially in Kenya's
higher learning organizations with the emphasis on customer satisfaction. The study gave an
experimental examination where the primary goal was to research the idea of the TQM practice
and its relationship with clients fulfillment.
Through the review of TQM literature, four builds of TQM practices in particular customer focus
Management commitment, continuous improvement and process/system approach were selected
to represent the core of TQM practice in this study. This was on the grounds that they had been
very much acknowledged by Deming Prize quality award model and European Foundation for
Quality Management (EFQM) KM model. Different builds that could influence customer
satisfaction incorporated the hypothetical structure for Malcolm Baldrige National Quality
Award, for example, Leadership, Strategic Planning and Information investigation (Arumugam,
2009). The exploration sought to discover information that would assist experts in higher
learning institutions with corrective measures on the identified areas of concern. The
investigation brought the significance of total quality management practices on customer
satisfaction.
28
2.4. Summary of the knowledge gaps
Researcher Focus Findings Knowledge gap Addressing
knowledge gap in
the current study
Sit, Ooi, Lin
and Chong
(2001)
Relationship
between TQM
practice and
customer
satisfaction
Positive
correlation
between Human
Resource focus
and Information
sharing
The study
concentrated on
Malcolm Bridge
Awards constructs
only
The study looked at
the Deming Prize
quality award model
and European
Foundation for
Quality
Management
(EFQM) KM model.
Paneka (2003) TQM and
Customer
satisfaction
No relationship
between quality
of the practice
and level of
effectiveness
Focus on
institution
infrastructure and
student service
The study focused
on the principles of
TQM
Owino (2013) Service quality
and customer
satisfaction
Service quality
has significant
influence on the
Human element
reliability
Focused on
SEVQUAL
Focused is on TQM
principles
Arango (2014) Perceived value
and customer
satisfaction
Perceived quality
has an impact on
customer
satisfaction
The study used
convenience
sampling method
hence a
possibility of non-
representative
sample
Study used stratified
random sampling to
increase
representativeness
29
Sudha (2013) TQM and
customer
satisfaction in
institutions of
higher learning
Commitment of
top management,
course delivery,
customer
feedback and
campus facilities
have an impact on
customer
satisfaction
Used convenience
sampling
procedure.
Possibility of non-
representative
sample
Study used stratified
random sampling to
increase
representativeness
Shandadnejad
and Alroaia
(2013)
TQM and
customer
satisfaction
Significant
influence of the
five components
of TQM namely;
tangibles,
attitude,
reliability, content
and mode of
delivery on
customer
satisfaction
Need to identify
more constructs
of TQM
Study determined
the adequacy of
other constructs of
TQM
Source: Literature review, 2018
2.5 Conceptual Framework
This section presented the independent and dependent variables in a diagram to show the
relationship between the variables. The independent variables were the customer focus,
Employee empowerment, continuous improvement and System/Process approach while the
dependent variable was the customer satisfaction. The conceptual framework is presented in
Figure below.
30
Independent Variable Dependent Variable
Figure 2.3: Conceptual Framework
Source: Author (2018)
Customer Focus
Responsiveness to students
queries
Availability of the lecturers
for consultations
Resolution of students’
conflict
Conducive academic
environment for learning
Management commitment
Effective and timely
communication
Regular participation in
students meetings
Willingness to assist
students and respond to
queries
Continuous Improvement
Maintenance of error free
records
Improved teaching methods
Frequency of evaluation
Implementation of customer
feedback
Customer Satisfaction
Willingness to refer
others to the university
Willingness to attend the
same university to
further the education
Willingness to be an
active alumnus
System/Process Approach
Clarity in the student’s
operational processes
Informative new student
orientation process
Efficient registration system
31
The review was conducted to determine if there was any relationship of the four factors of
independent variable and customers’ satisfaction. It was expected that customer focus had a
positive correlation with customer satisfaction since it was the customers who determined
whether a company had conformed to their requirements (Sahney and Banwet, 2004).
Management commitment was expected to have a positive correlation to customer satisfaction
since the commitment of management in ensuring quality services was delivered to the
customers (Khan, 2003). Continuous improvement was also expected to have a positive
correlation to customer satisfaction because it ensured to have better products and services that
met the customers’ needs (Arasi & Paul, 2005). System and Process approach was also expected
to have a positive correlation because the desired result was achieved more efficiently when the
activities and related resources are managed as a process (Robbins, 2008).
32
CHAPTER THREE
RESEARCH METHODOLOGY
3.1. Introduction
This section identified the techniques and procedures to be adopted in conducting the study. It
explained the research design for the study, sampling and data collection procedures as well as
reliability and validity of the study. The section also explained how data was presented and
analyzed.
3.2. Research Design
Descriptive research design was chosen as it described the characteristics and association
between TQM practices and Customer satisfaction among selected universities in Nairobi
county, Kenya. Descriptive research design helped to demonstrate how the information was
gathered, measured and examined to accomplish the exploration goals (Cooper and Schindler
2006). It was also adopted to address the inquiries of when, what, who and how (Kuada, 2012).
The research design described the existing phenomena by asking individuals about their
perceptions, attitudes or values. Descriptive study helped to determine the relation of the
variables and allowed analysis of the data quantitatively (Mugenda and Mugenda, 2003).
3.3. Location of the study
The study was carried out in Nairobi county where the Main campuses for University of Nairobi
and KCA University were based.
33
3.3.1. Target Population
The target populace for the study comprised of respondents from University of Nairobi and KCA
University. Unit of observation was the enrolled Bachelor of Commerce degree students from the
two universities. Owino (2013) and Arango (2014) showed that the degree students are ideal
since they were prompt in encountering the organization service. University of Nairobi was
favored on the preface that it had the biggest number of students in the 2016/2017 academic
year. KCA University was favored in light of the fact that it was most proximate to the
researcher. Kombo and Trump (2006) demonstrated that sampling frame helped in selecting
individuals from target populace that was utilized in conducting the study. The sampling frame
was acquired from the university registrar in the two universities. The aggregate number of
students pursuing Bachelor of Commerce degree from the University of Nairobi and KCA
University was 4,124 and 1,419 respectively. Therefore, the aggregate populace size of students
pursuing degree in Bachelor of Commerce in both universities in the 2016/2017 academic year
was 5,543 students as indicated by the University Registrars records.
Table 3.1 Target Population
University Category Full time
students
Part Time
Students
Total Number of
students per Category
University of Nairobi 3108 1016 4124
KCA University 872 547 1419
Total 3980 1563 5543
Source: University Registrars’ office (2017)
34
3.3.2. Sampling and Sampling Procedure
Sampling is the process of selecting a number of individuals from the target population to form a
representative sample of the whole population (Mugenda and Mugenda, 2003). Sampling
guaranteed that the study conclusion was summed up to the entire populace. Stratified random
sampling procedure was used to group the students into public university students and private
university students. The students were then stratified into full time students and part time
students. The part time students included evening and weekend students. To help pick the
respondents year of study, the study applied stratification. With a specific end goal to keep away
from any biasness, the study applied systematic random sampling. The aggregate sample decided
the size of the strata sample. The representative sample was sufficiently large to limit sampling
error. Mugenda and Mugenda (2003) indicated that a good sample was between 10%-30% of the
available populace. In this study, 10 percent of the accessible population constituted the sample
size. These therefore formed a sample of 554 degree students as presented in Table 3.2 below.
Table 3.2 Sample Size
Category of Students Frequency from
both universities
Sampling
Ration
Sample Population
(10%)
University of Nairobi
(Full Time)
3108 0.10
311
University of Nairobi
(Part time)
1016 0.10 102
KCA University
(Full time)
872 0.10 87
KCA University
(Part time)
547 0.10 54
Total 5543 554
Source: Researcher (2018)
35
3.4. Data Sources and Collection Instruments
Kumar (2009) indicated that data collection methods were the approach that the researcher takes
to collect data that relates to the study. The researcher utilized primary data to conduct the study.
The primary data was gathered utilizing semi – structured questionnaires focusing on full time
and part time students in the two universities. Creswell (2003) demonstrated that questionnaires
were research tools that assemblesd information over a large sample. Questionnaires were
utilized to acquire information from the full time and part time students in the two universities.
The questionnaires were self-administered to the Bachelor of Commerce students in different
classes in each university. The students were asked to take fifteen minutes in filling in the
questionnaire after which the researcher collected the filled questionaire. This strategy for data
collection helped in increasing the response rate. It additionally extricated the required data from
the respondents and gave the researcher superior comprehension of the outcomes (Creswell,
2003). To enable the data collection procedures, the researcher sought for a introduction letter
from Kenyatta University and also sought permission to carry out the research from relevant
authorities at the University of Nairobi and KCA University.
3.4.1. Pilot Survey
Borg and Gall (2006) recommended research instrument pretesting to check on its reliability and
validity. A few questionnaires were administered at United States International University
(USIU) that were not to form study sample. USIU was preferred because it was most proximate
to the researcher. This was to check for questions clarity and enable modifications where
necessary to allow proficiency and viability of the gathered information. The questionnaires were
revisited for correction before issuing to the study respondents.
36
3.4.2. Reliability of Research instruments
An instruments level of reliability depends on its ability to produce same results when used
repeatedly (Babbie & Mouton, 2007). Reliability of the questionnaire was achieved by ensuring
that the questionnaire was clear, well defined and administered to the right sample population.
Reliability test was done on the instrument to measure the degree to which the questionnaire
yielded consistent results. Test – Retest reliability was done where Cronbach’s Alpha was used
to measure reliability. The criterion used is the Cronbach alpha of 0.7 and above (Cooper &
Schindler, 2008). As shown in table 3.3. below, all four independent variables had a Cronbach’s
alpha which exceeded this threshold and this assured the reliability of the data.
Table 3.3 Reliability Analysis
Variable Cronbach’s Alpha Acceptable?
Customer Focus 0.851 Yes
Management Commitment 0.874 Yes
Continuous Improvement 0.886 Yes
System/ Process approach 0.832 Yes
Source: Author (2018)
3.4.3. Validity of Research instruments
Validity is the accuracy and meaningfulness of inferences that are based on research results.
Since the study used descriptive research design approach, the findings can be generalized
throughout the institutions of higher learning in Kenya hence have external validity. The face
validity was that nature of an indicator that influenced it to appear a sensible measure of some
variables. Content validity index was used to establish whether the questionnaire measured what
it was intended to measure. The researcher ensured that the research instruments to be used
measured the variables intended to measure by asking questions appropriate to answer the
37
research questions. The researcher sought for expert opinion to find out if the questionnaire was
appropriate for the study. The chosen respondents were guided on the most proficient method to
fill in the questionnaire.
3.5. Data Analysis and Presentation
To facilitate statistical analysis of the data, the questionnaire was coded and entered in using
statistical packages for social sciences (SPSS). Multi Linear regression analysis helped in
depicting the connection between the dependent and independent variables. The model is as
shown below.
Y= β0+β1x1+β2x2+β3x3+β4x4+ℰ …………………………... equation (i)
Where:
Y= Customer Satisfaction
X1 = Customer focus
X2 = Management Commitment
X3=Continuous improvement of products and services
X4=Process/system approach
β0 = Constant
ℰ=Error term
β= Slope. They indicate the level of change in customer satisfaction for every one unit increase
of X1 , X2, X3, X4
38
ℰ= Error term. it shows the amount of variation between the estimated Y = customer satisfaction.
The lower the error, the better the estimates.
The researcher used inferential statistics techniques that allowed generalizations of the
populations from which the samples were drawn. Descriptive statistics that included a mean
score analysis, minimum, maximum, standard deviation and variance analysis were used to help
in describing and summarizing data for ease of interpretation. Results were presented in
frequency tables and percentages for ease of understanding.
3.5.1. Diagnostic Tests
Diagnostic tests provided the researcher with tools for assessing the quality and reliability of
regression estimates.
Multicollinearity test
Multicollinearity test was used to determine if a data set of two or more independent variables in
a multiple regression model were highly correlated (Matthew & Ross, 2014). Variance Inflations
Factors (VIF) was done to identify multi collinearity problem in the model from the study
variables. If any two variables have high correlation, usually r > 0.8, that showed an indication of
multicollinearity. One of the variables with the highest standard deviation in the descriptive was
to be dropped (William, 2008).
Normality of residual test
According to the Gauss Markov Theorem, for the coefficients of the regression analysis to be the
best linear unbiased estimators, the residuals must be normally distributed with a constant
39
variance and a mean of zero. P-P plot was done to test for normality of residuals. If the plot is
linear, this implies that the residuals follow a normal distribution.
Heteroscedasticity test
Heteroscedasticity test was used determine if all random variables in the sequence or vector had
the same finite variance (Creswell, 2013). Breusch – Pagan test was done to test for
heteroscedasticity. If there was heteroscedasticity, it was treated by fitting the model using
Robust Standard Errors.
3.6. Data Management and Ethical Consideration
Prior to field activities, the researcher acquired an introduction letter from Kenyatta University.
The researcher likewise looked for consent from the pertinent experts to carry out the study.
The respondents consent was sought and confidentiality was observed. The respondents were
made to understand that the information was for academic purpose only.
40
CHAPTER FOUR
RESEARCH FINDINGS AND DISCUSSION
4.1 Introduction
This chapter presents the results of the study based on the objectives and research questions
presented. It analyzes the responses of the study specific variables and estimates their
relationship. Inferential analysis is performed on specific variables. The chapter shows the
relationship of the study variables in the regression model. Finally, there is interpretation of the
analyzed results.
4.2 Response Rate
As indicated in Table 4.1, out of 554 questionnaires administered, 452 were correctly filled and
returned. This constitutes a response rate of 81.6%.
Table 4.1 Response Rate
Frequency Percent
Questionnaires Returned 452 81.6
Questionnaires Not Returned 102 18.4
Total 554 100.0
Source: Author (2018)
41
According Saunders et al., (2007), a response rate of 50% is adequate, a rate of 60% is good and
a response rate of 70% and over is very good. This therefore implies that the response rate in this
study was considered to be very good. This was because the questionnaires were administered in
person by the researcher who waited for respondents to fill in and collected immediately. This
ensured that the respondents were a good representative of the target population.
4.3. Demographic Profile of the Respondents
This section discussed the demographic profile of the respondents. It outlined the respondents’
gender, university of study, year of study, and mode of study.
4.3.1 Gender of Respondents
The results presented in Table 4.2 show that 54.2% of the respondents were male (245) and
45.8% (207) were female. This shows that in the two universities, there were more male students
than females.
Table 4.2 Gender of Respondents
Frequency Percent
Male 245 54.2
Female 207 45.8
Total 452 100.0
Source: Author (2018)
4.3.2 University of Study
From table 4.3, the study showed that 73.9% (408) of the respondents were University of Nairobi
students, while 26.1% (144) were KCA university students. This indicates that university of
Nairobi students had a higher representation, which is in line with the fact that it’s the larger of
42
the two institutions in terms of students’ population. This is also due to the fact that public
universities have the highest number of student population.
Table 4.3 University of Study
Frequency Percent
University of Nairobi 408 73.9
KCA University 144 26.1
Total 452 100.0
Source: Author (2018)
4.3.3 Mode of Study
From table 4.4, 315 of the respondents were attending on the full time mode of study; this was
represented by 69.7% of the total respondents, whereas those who attended weekend classes
were represented by, 20.1% of the total respondents. Part time students were represented by
10.1% of the total respondents. From the prognosis, fulltime students were the larger group in
both universities. This is in line with the fact that most students in universities prefer to
undertake their study through full time mode of study.
Table 4.4 Mode of Study
Frequency Percent
Part Time 46 10.1
Full Time 315 69.7
Weekend 91 20.1
Total 452 100.0
Source: Author (2018)
43
4.4 Responses on Specific Variables
This part summarizes the responses that were received in relation to each of the four independent
variables and on the dependent variable.
4.4.1 Customer focus and Customer Satisfaction
The researcher sought to find out the relationship between customer focus and customer
satisfaction. The findings are reported in table 4.5 below.
Table 4.5. Customer focus and customer satisfaction
Strongly
Disagree
Disagree Neutral Agree Strongly
Agree
Mean S.D
My university collects
extensive complaint
information from customers.
6.20% 11.10% 14.40% 44.20% 24.10% 3.69 1.14
My university has greater
concern for quality products
and services
6.40% 7.50% 19.20% 44.70% 22.10% 3.63 1.09
My university has concern for quick resolution for student
conflict
6.90% 9.70% 11.10% 41.80% 30.50% 3.79 1.18
Employees understand
customer needs and deliver products /service beyond
customer expectations
5.10% 7.30% 12.60% 43.60% 31.40% 3.89 1.09
The university regularly
solicits feedback from the customers to improve products
and services
8.80% 10.60% 18.10% 32.30% 30.10% 3.64 1.26
The employees have customer
best interest at heart
8.20% 14.40% 19.50% 36.90% 21.00% 3.48 1.21
Source: Author (2018)
It is evident from the table that on average, the respondents agreed that their university collected
extensive complaint information from customers (mean = 3.69). Moreover, there was widespread
consensus with the statement that the university had greater concern for quality products and
44
services (mean =3.63). With a mean of 3.79, the respondents additionally indicated an acceptable
degree of assent with the statement that their university has concern for quick resolution for
student conflict. The statement that employees understand customer needs and deliver products
/service beyond customer expectations also received popular support ((mean =3.89).
Furthermore, the respondents registered a considerable level of approval of the statement that the
university regularly solicited feedback from the customers to improve products and services
(mean = 3.64). Finally, the respondents mainly agreed with the statement that the employees
have customer best interest at heart (mean =3.48).
4.4.2 Management Commitment and Customer Satisfaction
The researcher appraised the relationship between management commitment and customer
satisfaction. The respondents mainly expressed either agreement or strong agreement with
respect to the questions that were posed under this variable. This is as per table 4.6 below:
45
Table 4.6. Management Commitment and customer satisfaction
Strongly
Disagree
Disagree Neutral Agree Strongly
Agree
Mean S.D
The university
communicates effectively
on any development
8.40% 17.00% 16.80
%
34.50
%
23.20% 3.47 1.25
The management of the
university have regular
meetings with the students
8.40% 13.70% 12.40
%
39.60
%
25.90% 3.61 1.24
There is a written quality
policy
8.20% 13.70% 20.10
%
34.50
%
23.50% 3.51 1.22
The Employees are quick
in making decisions
regarding student’s
queries.
7.50% 15.30% 16.80
%
37.80
%
22.60% 3.53 1.21
I believe the university
gives quality education
9.70% 11.10% 21.50
%
37.80
%
19.90% 3.47 1.21
Employees are committed
to delivering quality and
conforming to customer
requirements
13.50% 18.10% 35.20
%
16.40
%
16.80% 3.05 1.25
Management act on the
student’s evaluation
feedback to ensure
conformance to customer
requirements
9.10% 19.00% 26.30
%
25.40
%
20.10% 3.29 1.24
Source: Author (2018)
There was agreement that the university communicated effectively on any development (mean =
3.47), On average, the respondents also agreed with the statements that the management of the
university had regular meetings with the students (mean=3.61), there was a written quality policy
(mean = 3.51), employees are quick in making decisions regarding student’s queries (mean =
3.53), I believe the university gave quality education (mean =3.47), employees were committed
to delivering quality and conforming to customer requirements (mean =3.05), and management
act on the student’s evaluation feedback to ensure conformance to customer requirements (mean
=3.29).
46
4.4.3 Continuous Improvement and Customer Satisfaction
To investigate the relationship between continuous improvement and customer satisfaction, the
researcher collected data using the constructs in table 4.7 below:
Table 4.7 Continuous improvement and customer satisfaction
Strongly
Disagree
Disagree Neutral Agree Strongly
Agree
Mean S.D
The course curriculum is
continuously revised based on
market needs.
22.10% 22.10% 17.50% 23.90% 14.40% 2.86 1.38
The university registrar’s
office maintains error free
records
8.00% 17.90% 29.90% 28.30% 15.90% 3.26 1.16
The lecturers ensure that the
teaching methods are
continuously improved for
quality enhancement
13.30% 11.10% 26.50% 27.20% 21.90% 3.33 1.3
My academic results have no
errors
11.50% 16.40% 29.90% 27.00% 15.30% 3.18 1.21
The Quality assurance
departments conducts frequent
evaluations to help in
improvement of services
offered.
16.20% 9.30% 27.20% 25.90% 21.50% 3.27 1.34
The customer feedback
provided in the evaluations is
implemented in making future
decisions
4.20% 11.30% 28.50% 33.80% 22.10% 3.58 1.08
Source: Author (2018)
On average, the respondents either disagreed or were neutral on the statement that their course
curriculum was continuously revised based on market needs (mean =2.86). However, they
expressed support for the statements that the university registrar’s office maintained error free
records (mean =3.26), lecturers ensured that the teaching methods were continuously improved
for quality enhancement (mean =3.33), their academic results had no errors (mean =3.18), the
quality assurance departments conducted frequent evaluations to help in improvement of services
47
offered (mean =3.27), and that the customer feedback provided in the evaluations was
implemented in making future decisions (mean =3.58).
4.4.4 System /Process Approach and Customer Satisfaction
On the relationship between System /Process Approach and Customer Satisfaction, the
respondents’ responses to this variables’ constructs are as outlined in table 4.8 below:
Table 4.8: System/ Process approach and Customer satisfaction
Strongly
Disagree
Disagree Neutral Agree Strongly
Agree
Mean S.D
The process followed to
get admission to the
university is clear 18.6% 17.5% 25.2% 26.5% 12.2% 3.96 1.293
The process followed to
register as a student is
adequate 6.0% 11.5% 27.0% 42.0% 13.5% 3.46 1.053
The process followed for
making payment to the
university is convenient 7.5% 8.6% 16.8% 42.9% 24.1% 3.67 1.152
The system in use at the
university is effective and
efficient to the students 9.3% 10.2% 17.3% 37.8% 25.4% 3.59 1.230
I am well informed of the
examination procedures 6.9% 11.5% 21.9% 38.7% 21.0% 3.55 1.145
My university provides
extensive orientation of
new students 6.9% 12.6% 18.8% 40.0% 21.7% 3.57 1.159
Source: Author (2018)
48
The respondents strongly agreed with the statement that the process followed to get admission to
the university was clear (mean=3.96). Moreover, they also expressed concurrence, albeit with
varying degrees, with the statements that the process followed to register as a student was
adequate (mean=3.46), the process followed for making payment to the university was
convenient (mean=3.67), the system in use at the university is effective and efficient to the
students (mean=3.59), they are well informed of the examination procedures (mean=3.55), and
that the university provides extensive orientation of new students (mean=3.57).
4.4.5 Dependent Variable: Customer Satisfaction
Customer satisfaction was the dependent variable of this study. The responses that were received
from the respondents in relation to this variable are summarized in table 4.9 below:
Table 4.9. Customer Satisfaction
Strongly
Disagree
Disagree Neutral Agree Strongly
Agree
Mean S.D
I have experienced a
positive relation with the
university
2.20% 4.40% 11.30% 39.20% 42.90% 4.16 0.95
I am willing to be an
active alumnus of the
university
2.20% 9.10% 20.60% 52.40% 15.70% 3.7 0.92
I am satisfied with the
quality of service provided
by the administration staff
2.20% 4.40% 34.30% 34.30% 24.80% 3.75 0.95
I am willing to come back
for further studies in this
university.
4.60% 8.80% 23.70% 42.50% 20.40% 3.65 1.05
I am willing to
recommend this university
to someone else.
3.80% 6.60% 11.50% 46.00% 32.10% 3.96 1.02
Overall, I am satisfied by
this university
5.80% 8.20% 10.80% 42.50% 32.70% 3.88 1.13
Source: Author (2018)
49
There was a strongly consensus with the statement that they had experienced a positive relation
with the university (mean=4.16). They also strongly expressed their willingness to be active
alumni of the university (mean=3.70). Moreover, they said that they were satisfied with the
quality of service provided by the administration staff (mean=3.75) and they were willing to
come back for further studies in the university (mean=3.65). They also strongly indicated that
they were willing to recommend their university to someone else (mean=3.96). Finally, they
expressed a strongly level of satisfaction with their university (mean=3.88).
4.5 Diagnostic Tests
The researcher undertook diagnostic testing to ensure that the data conforms to the classic linear
regression assumptions. The researcher tested the data for multicollinearity, heteroscedasticity,
and normality of residuals. Results of this analysis are discussed below.
4.5.1 Testing for Multicollinearity
According to Keith (2006), multicollinearity arises when two or more independent variables that
are jointly used to estimate a regression model have a strong linear relationship. The researcher
tested for multicollinearity using the variance inflation factors. If the variance inflation factor for
any variable exceeds 5, this is an indicator of the existence of multicollinearity and therefore the
problem should be remedied before any further analysis is undertaken.
Table 4.10 Testing for Multicollinearity
Variable VIF 1/VIF
C_Focus
C_improvement
P_SApproach
M_Commitment
1.32 0.758979
1.31 0.762660
1.02 0.982116
1.01 0.991061
Mean VIF 1.16
Source: Author (2018)
50
As per table 4.10 above, all the Variance Inflation Factors were less than 5. As such, the
deduction is that there was no multicollinearity in the data and hence it was fit for analysis.
4.5.2 Testing for Heteroscedasticity
The researcher tested the data for heteroscedasticity using the Breusch Pagan test.
Heteroscedasticity is present when the variance of the error terms is not constant, and it a major
problem since it tends to inflate the standard errors. This increases the probability of committing
a type two error in hypothesis testing, i.e. failing to reject a false hypothesis. If the p value of the
Breusch Pagan test is greater than 5%, this is an indicator of the presence of heteroscedasticity.
Table 4.11. Testing for Heteroscedasticity
Breusch- Pagan /Cook-Weisberg test for heteroskedasticity
Ho: Constant variance
Variables: fitted values of C_ Satisfaction
Chi2 (1) = 2.00
Prob > chi2 = 0.1573
Source: Author (2018)
As evident in table 4.11, the null hypothesis of constant variance should not be rejected since the
p value was greater than 5%. As such, the conclusion was that there was no heteroscedasticity in
the dataset.
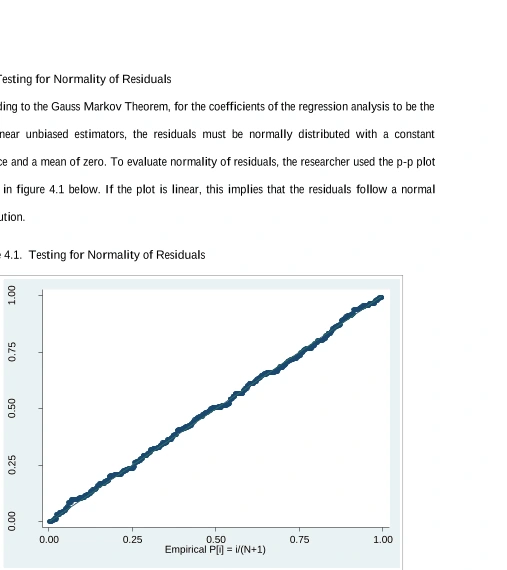
51
4.5.3 Testing for Normality of Residuals
According to the Gauss Markov Theorem, for the coefficients of the regression analysis to be the
best linear unbiased estimators, the residuals must be normally distributed with a constant
variance and a mean of zero. To evaluate normality of residuals, the researcher used the p-p plot
shown in figure 4.1 below. If the plot is linear, this implies that the residuals follow a normal
distribution.
Figure 4.1. Testing for Normality of Residuals
Source: Author (2018)
According to the P-P plot, the residuals are normally distributed since the plot is approximately
linear.
52
4.6 Inferential Analysis
To compute the strength between dependent variable and the independent variables the researcher
conducted several forms of inferential analysis on the study data. In particular, the researcher
conducted a multiple regression analysis, an Analysis of Variance (ANOVA), and evaluated the
study’s coefficient of determination.
4.6.1 OLS Regression Analysis
The research undertook a multivariate ordinary least squares regression analysis in order to
quantify the relationship between the independent variables and the dependent variable. The
results of this analysis are shown in table 4.12 below.
Table 4.12 OLS Regression Analysis Coefficients
Model Unstandardized
Coefficients
Standardized
Coefficients
T Sig.
B Std. Error Beta
1
(Constant) .337 .078 4.328 .000
Customer Focus .677 .017 .843 40.820 .000
Management
Commitment
.051 .021 .043 2.395 .017
Continuous
Improvement
.130 .019 .140 6.814 .000
System /Process
Approach
.049 .020 .045 2.486 .013
a. Dependent Variable: Customer Satisfaction
Source: Author (2018)
53
The regression analysis table showed that all the independent variables had a positive and
significant impact on the dependent variable. These results can be summarized in the following
model:
Y = 0.337 + 0.677X1 + 0.051X2+0.130X3+ 0.049X4…………………...............……...(ii)
Where:
Y = Customer Satisfaction
0.337 = Constant
X1 = Customer Focus
0.677= Coefficient of X1
X2= Management Commitment
0.051= Coefficient of X2
X3= Continuous Improvement
0.130 = Coefficient of X3
X4= System /Process Approach
0.049 = Coefficient of X4
According to the regression equation, the level of customer satisfaction was 0.337 in the absence
of the effect of all the independent variables. The findings also imply that a unit increase in
customer focus led to a 0.677 increase in customer satisfaction; a unit increase in management
commitment led to a 0.051 increase in customer satisfaction; a unit increase in continuous
improvement led to a 0.130 increase in customer satisfaction; and a unit increase in System
/Process Approach led to a 0.049 increase in customer satisfaction. It can be noticed that all four
54
independent variables had a positive and significant effect on the dependent variable, with
customer focus having the highest effect and system /process approach the least effect.
4.6.2 Coefficient of Determination
The coefficient of determination was used to evaluate the explanatory power of variance in the
independent variables on variance in the dependent variable. The data analysis yielded a
coefficient of determination of 85.5%, which illustrates an acceptable goodness of fit. This
implied that 85.5% of variability in customer satisfaction can be attributed to variability in
customer focus, management commitment, continuous improvement and system /process
approach.
Table 4.13 Coefficient of Determination
Model R R Square Adjusted R Square Std. Error of the Estimate
1 .925 a .855 .854 .33310
a. Predictors: (Constant), System /Process Approach, Management Commitment,
Continuous Improvement, Customer Focus
Source: Author (2018)
4.6.3 Analysis of Variance
The study used the ANOVA F test to evaluate the significance of the overall model. The result of
this analysis, as shown in table 4.14 below, indicated that the overall model was significant since
the p value was less than 5%. As such, system /process approach, management commitment,
continuous improvement, and customer focus are jointly deemed as significant predictors of
customer satisfaction.
55
Table 4.14 Analysis of Variance
Model Sum of
Squares
df Mean Square F Sig.
1
Regression 293.481 4 73.370 661.264 .000 b
Residual 49.597 447 .111
Total 343.077 451
a. Dependent Variable: Customer Satisfaction
b. Predictors: (Constant), System /Process Approach, Management Commitment,
Continuous Improvement, Customer Focus
Source: Author (2018)
4.6.4 Hypothesis Testing using the Multiple Regression Model
Going by the results outlined in the regression table, we can see that the coefficients of all
independent variables were positive and statistically significant. The conclusion therefore was to
reject all null hypotheses and conclude that the four independent variables had a significant
effect on customer satisfaction as discussed below:
H01: Customer focus has no significant effect on customer satisfaction in institutions of higher
learning in Kenya.
The results of regression analysis showed that customer focus had a positive and significant
effect on customer satisfaction in institutions of higher learning in Kenya (β = 0.677, p = 0.000).
As such, the hypothesis that customer focus had no significant effect on customer satisfaction in
institutions of higher learning in Kenya was rejected.
56
H02: Management Commitment has no significant effect on customer satisfaction in institutions
of higher learning in Kenya.
The results rejected the hypothesis that management commitment had no significant effect on
customer satisfaction in institutions of higher learning in Kenya. Contrary to this hypothesis,
management commitment was found to have a positive and significant effect on customer
satisfaction in institutions of higher learning in Kenya (β = 0.051, p =0.017).
H03: Continuous improvement has no significant effect on customer satisfaction in institutions of
higher learning in Kenya.
The hypothesis that continuous improvement has no significant effect on customer satisfaction in
institutions of higher learning in Kenya was also rejected, since the effect of continuous
improvement on customer satisfaction in institutions of higher learning in Kenya was positive
and significant (β = 0.130, p = 0.000).
H04: System /Process Approach has no significant effect on customer satisfaction in institutions
of higher learning in Kenya.
Analysis showed that the effect of system /process approach on customer satisfaction in
institutions of higher learning in Kenya was positive and significant (β = 0.049, p =0.013). As
such, the hypothesis that system /process approach had no significant effect on customer
satisfaction in institutions of higher learning in Kenya was consecutively rejected.
57
CHAPTER FIVE
SUMMARY OF FINDINGS, CONCLUSION AND RECOMMENDATIONS
5.1. Introduction
This chapter presented the summary of research findings from the data analyzed. It also gave a
detailed conclusion on the study variables and recommendations.
5.2. Summary of Findings
5.2.1. Effect of Customer focus on customer satisfaction
From the regression analysis, the study found customer focus taking the lead as the most
influential variable for customer satisfaction. The regression indicated that a unit increase in
customer focus led to 0.677 increase in customer satisfaction. The correlation analysis also
pointed out a positive relationship between the two. This is supported by (Ishikawa, 1985 and
Kanji, 1990) who indicated that customer focus and satisfaction is regarded as the driving force
for the whole quality process. Deming (1986) also indicated that the survival of organization is
dependent on meeting the customers’ needs and ensuring that the customer is satisfied. The
descriptive statistics demonstrated that there was consensus on the respondents agreeing on the
significance of having quick resolution for conflict. This is supported with the highest mean of
3.79 of the respondents’ responses. It is consistent with Mallack and Lyth (2003) who indicated
that organization must be responsive to customers’ needs and requirements.
58
5.2.2. Effect of Management commitment on customer satisfaction
The study found management commitment to have significant effect on the customer
satisfaction. From the regression analysis, this is the third most significant variable. A unit
increase in management commitment, led to 0.051 increase in customer satisfaction. The
descriptive analysis indicated the significance of management commitment in enhancing
effective communication and regular meetings with customers. This statement is supported by
having the highest mean of 3.61 of the responses. The respondents also agreed on the
significance of quality policy in an organization that is committed to ensure customer
satisfaction. In overall, the respondents agreed that management commitment influences
customer satisfaction. This is supported by (Oakland, 2003) who stated that Quality policy shows
that top management is committed to quality services and fulfilment of customer needs. It is also
consistent with Besterfield (2003) who indicated that top management commitment to quality
improvement makes the implementation of quality efforts to be successful.
5.2.3. Effect of Continuous Improvement on customer satisfaction
The study found continuous improvement to have a significant effect on the customer
satisfaction. This is the second most significant variable as per the regression analysis. The
regression analysis indicated that a unit increase in continuous improvement led to a 0.130
increase in customer satisfaction. The descriptive statistics indicated that the respondents agreed
that organizations used customer feedback in making future decisions. This is supported with a
highest mean of 3.58 of the responses. The respondents also agreed that the delivery of service is
continually improved for quality enhancement. The respondents agreed on the significance of
continual improvement of the curriculum based on the market needs. This is consistent with
Arasi and Paul (2005) who indicated that firms that practice continual improvement constantly
59
improve their customer service and internal performance. Organizations must continually
improve their processes to be able to survive in a competitive market. This also agrees with
Yousaf (2006) who found out that continual improvement efforts lead to increased customer
satisfaction and delight.
5.2.4 Effect of system/Process approach on customer satisfaction
From the regression analysis, the study found system/process approach to have a significant
effect on customer satisfaction. This is the fourth most significant variable from the regression
output. The regression model showed that a unit increase in system/process approach led to a
0.049 increase in customer satisfaction. The correlation analysis also points to a positive relation
between the two. The descriptive statistics showed that the process followed to get admission in
the university was clear. This is supported with the highest mean of 3.96 of the responses. The
respondents also agreed that the students were taken through orientation in to the university
processes. This is supported by Robbins (2008) who indicated that process approach is a
powerful way of organizing and managing activities in order to create value for the customers
and other stake holders. It is consistent with Senge and Sterman (2005) who stated that
organizations that focus on TQM efforts should emphasize on the relationship of the different
parts in order to achieve the organization goals and objectives.
5.3. Conclusions
5.3.1. Customer focus
The study concluded that customer focus was the most significant variable for customer
satisfaction. The study concluded that the most significant aspect of customer focus were having
60
quick resolution for customer conflict, management great concern for quality products and
services, understanding customers’ needs and requirements and collecting customer complaints.
The study concluded that organizations need to have quick solutions to customer conflicts.
Having customers’ best interest at heart and soliciting feedback were fundamental in ensuring
customer satisfaction.
5.3.2. Management commitment
The study concluded that regular meetings with students, ability for employees to make quick
decisions, and effective communication to clients were the most significant aspect of
management commitment. The study also concluded that quality policy statement was key in
ensuring customer fulfillment.
5.3.3. Continuous improvement
The study concluded that the key aspects of continual improvement were use of customer
feedback in decision making and maintaining error free records. Other fundamental aspects for
continual improvement are continuous improvement of teaching methods and conducting
frequent evaluation of services for quality enhancement.
5.3.4. System/Process Approach
The study concludes that system/process approach was the least significant variable for customer
satisfaction. Specifically, these aspects emerged to have the most significant aspect; clear
admission procedure, adequate and convenient process for registering for units, making payment
and student orientation in to the system. The study further concludes that efficient and effective
examination system was fundamental in ensuring customer satisfaction.
61
5.4 Recommendation for Policy and Practice
From the findings of this research, the following are the recommendations;
Higher learning institutions should strive to focus on the customers’ requirements and needs in
order to gain customer satisfaction. They should conduct market research so as to be aware of the
customers’ requirements.
Management of higher learning institutions should participate and be committed in the day to
day running of the organization. Management should endeavor to conform to customers’ needs
and requirements and also empower their employees.
For organization to remain competitive, they should ensure they continually improve their
products, services and processes. Management should use the solicited customer feedback to
help in making future decisions that enhances quality improvement.
The other variable of interest from this research is process/system approach. Management should
ensure their organization processes and system are effective and efficient. Orientation of new
students to the system is important for customer’s fulfillment and satisfaction.
5.5 Suggestions for further studies
The study recommends further studies be done on customer satisfaction in the higher education
institutions. Other constructs or determinants for Total Quality Management could be examined
such as employee empowerment, management by fact and culture. Future studies could also be
done to include a large number of higher learning institutions.
62
REFERENCES
Arango. V. 2014. Effect Of Perceived Value On Customer Satisfaction In Kenya: Comparative
Analysis Of Public And Private University Students.
Arusu B. S. and Paul J. p. (2005) Total Quality Management, 2 nd
edition. Scitech Publications
India Chennai.
Ayup, Kartinah, &Chung, then Hsio (2010). Empowerment: Hotel Employees’ Perspective.
Journal of Industrial Engineering and Management, pp 561-575
Babbie, E & Mouton, J., (2007).The practical of social research. South African Edition, Cape
Town.
Bulgarella C.C. (2005) Employee Satisfaction and Customer satisfaction. Is there a relationship.
Guide star Research White paper
Capra, F. 2007. The web of life. New York: Doubleday-Anchor Book.
Cooper, D.R., & schindler, P.S. (2008). Business research methods. 1oth Edition; McGraw-Hill
International Edition; Singapore (ISBN: 978-007-12633-7)
Degner, L. (2005). Knowledge translation in palliative care: Can theory help? Canadian Journal
of Nursing Research, 37(2), 105-113.
Deming, W.E. (1986), Out of the Crisis, Massachussetts Institute of Technology, Centre for
Advanced Engineering Study, MIT Press, Cambridge, MA.
Dimitriades, A.S. (2006), “Customer Satisfaction, Loyalty and Commitment in service
organization: Some evidence from Greece”, Management Research News, Vol. 29 No. 12, pp
782 – 800.
63
Edvardsson. (2005) GURU’S VIEW, Service quality: beyond cognitive assessment Service
Sweden. Managing Service Quality, 15 (2), pp. 127-131q
Gronroos, C.,(2007) The Perceived Quality Concept: a mistake? Managing Service Quality
11(3), pp. 150-152.
Hasan, A. F., et al. (2008). Service Quality and Student Satisfaction: A Case Study at Private
Higher Education Institutions. International Business Research, 1(3), 163-175.
Hoffman, R.C. and Hagerty, H. (2004), “Top management influence on innovation: effects of
executive characteristics and social culture”, Journal of Management, Vol. 19 No. 3, pp. 549-74
Ishikawa, K. (1985), What is Total Quality Control? The Japanese Way, Prentice Hall,
Englewood Cliffs, NJ.
Jamshed K. Khan, (2003),”Impact of total Quality Management on Productivity”, The TQM
Magazine, Vol. 15 Iss 6. Pp 374 – 380.
Juan Jose Tari (2005), Components of Successful TQM, The TQM Magazine, Vol 17, Issue 2,
PP 182-194.
Juran, J.M. and Gryna, F.M. (1993), Quality Planning and Analysis, 3rd ed., McGraw-Hill, New
York, NY.
Katz, D., Kahn, R.L. 2003. The Social Psychology of Organizations, II ed. New York: Wiley
Keng and Boom (2011), “ Are TQM practices supporting customer satisfaction and service
quality?” Journal of service Marketing, Vol 25, Issue 6: Pp 410 -419.
Kennedy, K.N., Lassk, F.G. and Goolsby, J.R. (2008), “Customer mind-set of employees
throughout the organisation”, Journal of the Academy of Marketing Science, Vol. 30 No. 2, pp.
159-71.
64
Kuada, J. (2012). Research Methodology: A Project Guide for University Students.
Frederiksberg : Samfundslitteratur.
Kotler P.(2006). Marketing Management; managing service quality 12 th edition. NY: Prentice
Hall. Lin J.S.C., & Wu, C.Y (2011) 21(5) 535-551
Lovelock CH, Wirtz J (2007). Services marketing: People, Technology, strategy, 6th ed.,
Upper Saddle River, N.J.: Pearson/Prentice Hall.
Mallak, L.L., Lyth, D.M., Olson, S.D., Ulshafer, S.M. and Sardone, F.J. (2003), “Culture, the
builtenvironment and healthcare organisational performance”, Managing Service Quality,Vol. 13
No. 1, pp. 27-38.
Mugenda M.O. & Mugenda, G. A. (2003)Research Methods. Quantitative and Qualitative
Approach: Nairobi. Laba Graphics Services.
Mele, C., Colurcio, M. 2006. The evolving path of TQM: towards business excellence and
stakeholder value. International Journal of Quality and Reliability Management. 23(5).
Menon, Sanjay T (2007). Employee Empowerment : An Integrative Psychological Approach.
International Association for Applied Psychology.
Mukonyo, F. M. (2014),”Effect of Total Quality Management implementation performance in
Micro Finance Institutions in Kenya. A case of K-REP Development Agency (KDA), Masters
Project, Kenyatta University Library.
Nimako S. J. and Azuma F. K. (2009) ‘An Assessment and Analysis of Customer Satisfaction
with Service Delivery of Mobile Telecommunication Networks Within Ghana'.
Nafula F. (2012), “Effects of Implementation of Total Quality Management on Organizational
Performance. A case of Post Bank., Masters Project, Kenyatta University Library.
Oakland, J. S, (2003), TQM texts with cases; Butterworth Heinemann, 3 rd
Ed. Amsterdam,
Boston.
65
Orsini Joyce, (2013) The Essential Deming: “Leadership Principles from the Father of
Quality.”McGraw Hill, New York, 2013, pp. 325
Senge, P.M., Sterman, J. 2005. System Thinking and Organizational Learning: acting locally and
thinking globally in the organization. Working Paper n.03.009. Cambridge: MIT.
Senge, P.M. (1990), “The leader’s new work: building learning organizations”, Sloan
ManagementReview, Vol. 32 No. 1, pp. 7-23.
Sanjay L. Ahire, K.C. O’Shaughnessy, (2008) "The role of top management commitment in
quality management: an empirical analysis of the auto parts industry", International Journal of
Quality Science, Vol. 3 Issue: 1, pp.5-37.
Sit, Ooi, Lin and Chong, (2009), “TQM and customer satisfaction in Malaysia Service sector,
Industrial Management and Data Systems, Vol. 109 Iss 7pp 957 -975
Sudha (2013), “TQM in institutions of Higher Learning’’, International journal of social science
and interdisciplinary Research, Vol. 2 (6) June 2013.
Wang Y. and Hing-Po L. (2008.) Service quality, customer satisfaction and behaviour intentions:
Evidence from China’s telecommunication industry, 4(6), 50-60.
Waweru, S. N. (2013) The role of Private Universities in Meeting the demand of higher
Education in Kenya. International Journal of Education and Research Vol. 1 No. 12 December
2013
Von Bertalanffy, L. (1956). General System Theory, in Emery, F.E. (eds.). General System,
Yearbook of the Society for the Advancement of General System Theory.
Yousaf, N. (2006) Top management commitment for TQM – A process model. Pakistan’s 10 th
international convention on quality improvement. Nov 27 -28, 2006.
66
APPENDICES
APPENDIX 1: RESEARCH QUESTIONNAIRE
I am a student at Kenyatta University pursuing MBA in Strategic Management. For successful
completion of my course, I am required to conduct a research. My research topic is “Total
Quality Management Practices and Customer Satisfaction in Institutions of Higher Learning in
Kenya (Case of Selected Universities in Nairobi County)”. Please fill in the below questionnaire.
The information collected will be confidential and used for academic purposes only.
Section A: General information
1. Please indicate your gender? Use a (√)
Male ( ) Female ( )
2. Your University of study?
KCA University University of Nairobi
3. Please indicate your Mode of study
Full time Part time weekend
SECTION B: CUSTOMER SATISFACTION
To what extent do you agree or disagree with the following statements
67
CUSTOMER SATISFACTION 1 2 3 4 5
Strongly
Disagree
Disagree Neutral Agree Strongly
Agree
4 I have experienced a positive relation
with the university
5 I am willing to be an active alumnus of
the university
6 I am satisfied with the quality of service
provided by the administration staff.
7 I am willing to come back for further
studies in this university.
8 I am willing to recommend this
university to someone else.
9 Overall, I am satisfied by this university
SECTION C: CUSTOMER FOCUS
To what extent do you agree or disagree with the following statements
CUSTOMER FOCUS 1 2 3 4 5
Strongly
Disagree
Disagree Neut
ral
Agree Strongly
Agree
1 My university collects extensive complaint
information from customers.
2 My university has greater concern for quality
products and services
3 My university has concern for quick resolution
for student conflict
4 Employees understand customer needs and
deliver products /service beyond customer
expectations
5 The university regularly solicits feedback from
the customers to improve products and services
6 The employees have customer best interest at
heart
68
SECTION D: MANAGEMENT COMMITMENT
To what extent do you agree or disagree with the following statements
Management commitment 1 2 3 4 5
Strongly
Disagree
Disagree Neutral Agree Strongly
Agree
1 The university communicates effectively on
any development
2 The management of the university have
regular meetings with the students
3 There is a written quality policy
4 The Employees are quick in making
decisions regarding student’s queries.
5 I believe the university gives quality
education
6 Employees are committed to delivering
quality and conforming to customer
requirements
7 Management act on the student’s
evaluation feedback to ensure conformance
to customer requirements
69
SECTION E: CONTINUOUS IMPROVEMENT OF PRODUCTS AND SERVICES
To what extent do you agree or disagree with the following statements
CONTINUOUS IMPROVEMENT 1 2 3 4 5
Strongly
Disagree
Disagree Neutral Agree Strongly
Agree
1 The course curriculum is continuously
revised based on market needs.
2 The records in the university registrar’s
office are properly maintained.
3 The university provides me with quality
education
4 The lecturers ensure that the teaching
methods are continuously improved for
quality enhancement
5 My academic results have no errors
6 The Quality assurance departments conducts
frequent evaluations to help in improvement
of services offered.
7 The customer feedback provided in the
evaluations is implemented in making future
decisions
70
SECTION F: SYSTEM/PROCESS APPROACH
To what extent do you agree or disagree with the following statements
SYSTEM/PROCESS APPROACH 1 2 3 4 5
Strongly
Disagree
Disagree Neutral Agree Strongly
Agree
1 There is clear process for making an admission in
the university
2 The registration process to be a student is
adequate
3
The university payment process is convenient
4 The system in use at the university is effective
and efficient to the students
5 Examination procedures are clearly outlined
6 My university provides extensive orientation of
new students
Thank you for the cooperation
71
APPENDIX II: INTROCUTION LETTER
Like this project
Posted Jan 24, 2024
A RESEARCH PROJECT LINKED TO BUSINESS
Likes
0
Views
65