Weather Analysis PowerBI Report
Angelo Rosso
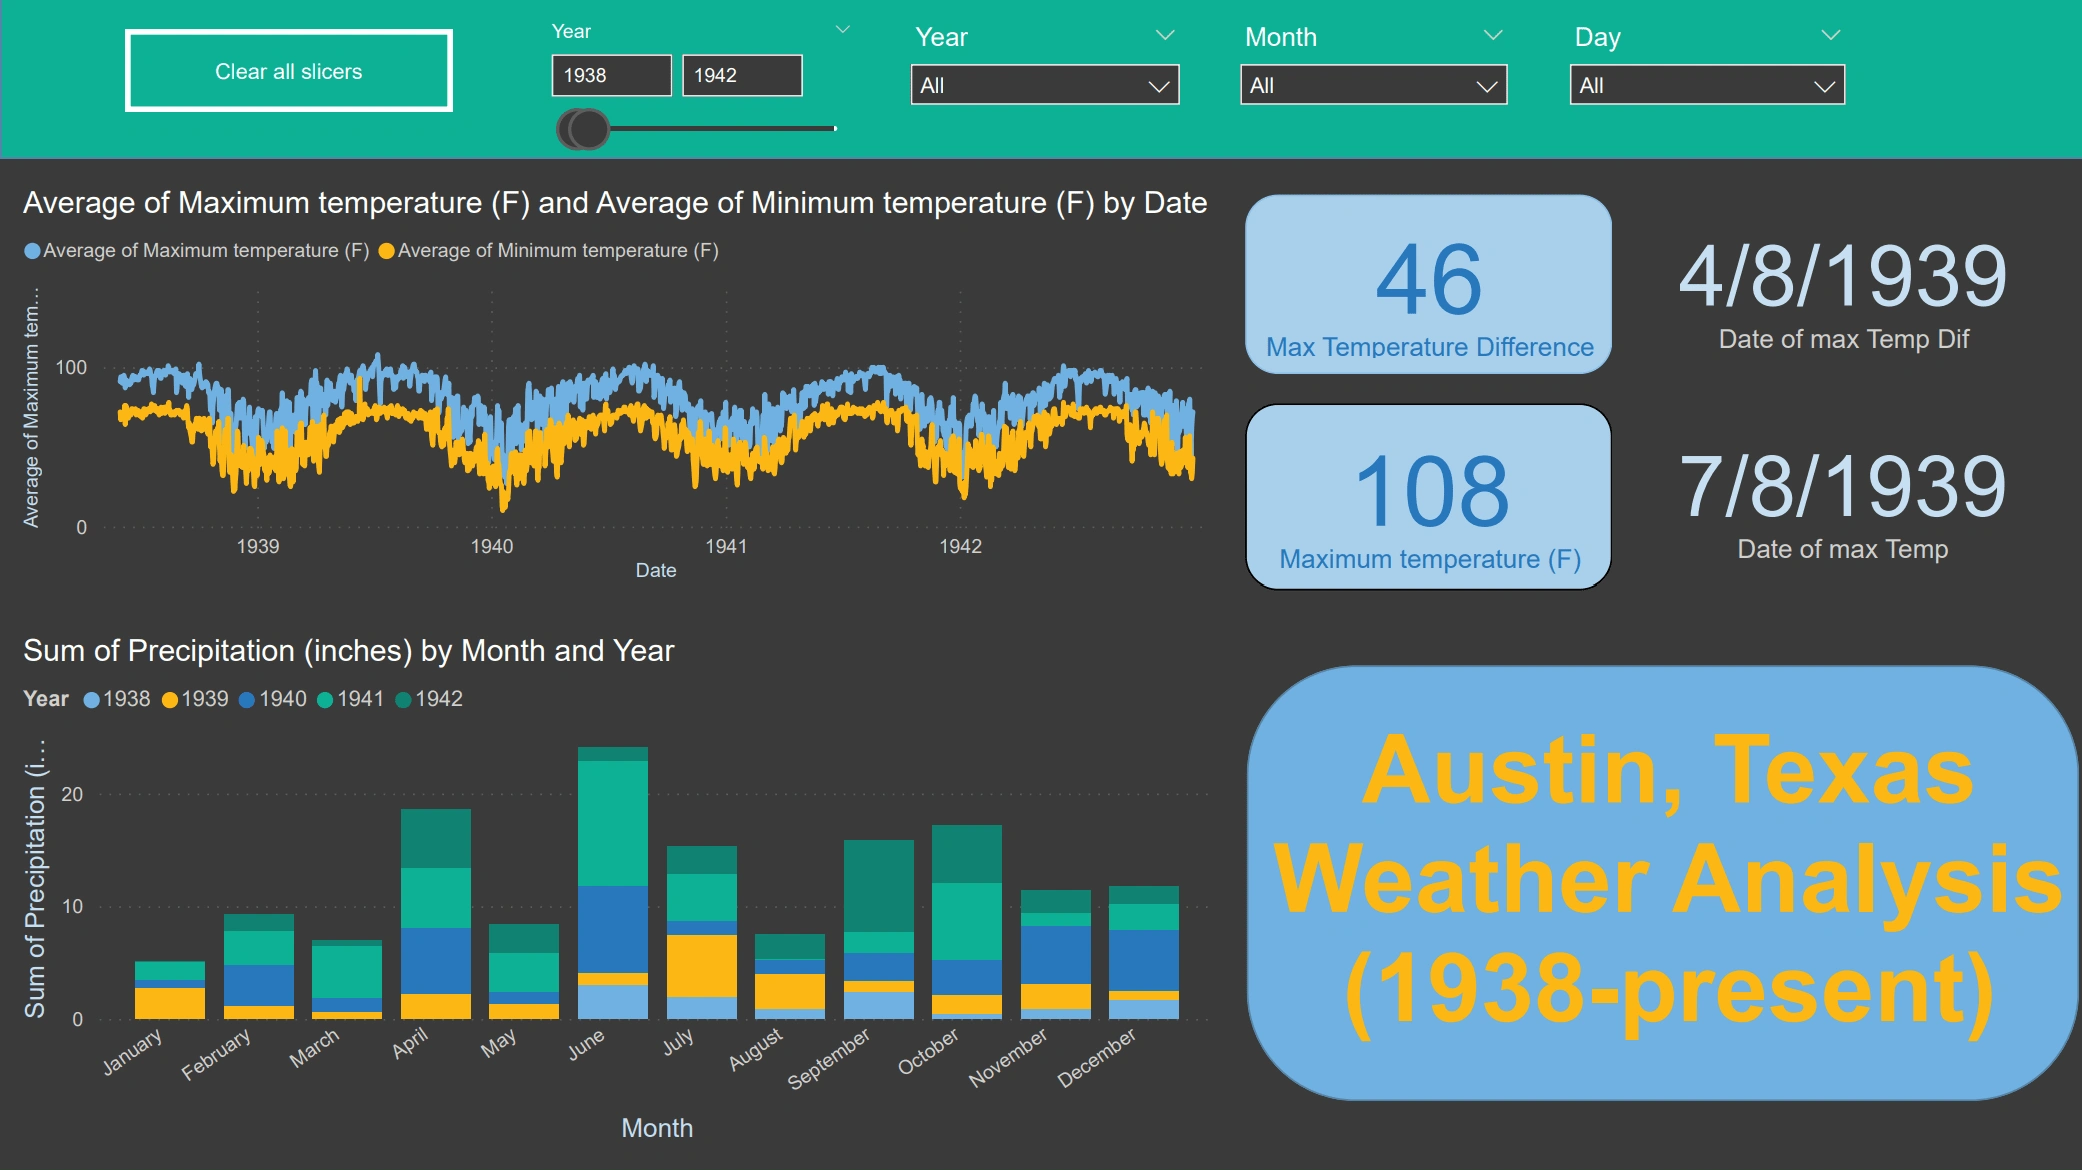
I completed a fully interactive dashboard to analyze the temperature and rainfall in Austin, Texas. The project included collecting data, preprocessing, loading it into power BI, and creating the report.
Like this project
Posted Mar 14, 2024
I completed a fully interactive dashboard using PowerBI to analyze the temperature and rainfall in Austin, Texas.
Likes
0
Views
9