Analyzing Bond Market Spreads and Bond ETFs
Bennett Preston
Confidence Cracks or Buying Opportunities? Decoding the 2025 U.S Bond Market
U.S Bonds are one of the most analyzed markets in the world for their direct application to determining the U.S and global economic health. Any changes to this market not only affect the certain bond ETFs that are discussed in this article, but also the broad stock market allowing this article to provide valuable information on how to align one’s portfolio during this time of ambiguity.
For this article, we will look at the 5–10 Year Treasury Yield Curves (GS5, GS10 on FRED) and the bond ETFs listed below:
iShares 7–10 Year Treasury Bond ETF (IEF)
iShares 20+ Year Treasury Bond ETF (TLT)
iShares 1–3 Year Treasury Bond ETF (SHY)
iShares TIPS Bond ETF (TIP)
In this analysis, basis points (bps) are frequently used. To avoid any confusion, the conversion ratio for bps to pct is shown below:
1 basis point = 0.01%
10 basis points = 0.10%
100 basis points = 1.00%
General Overview of U.S Bonds
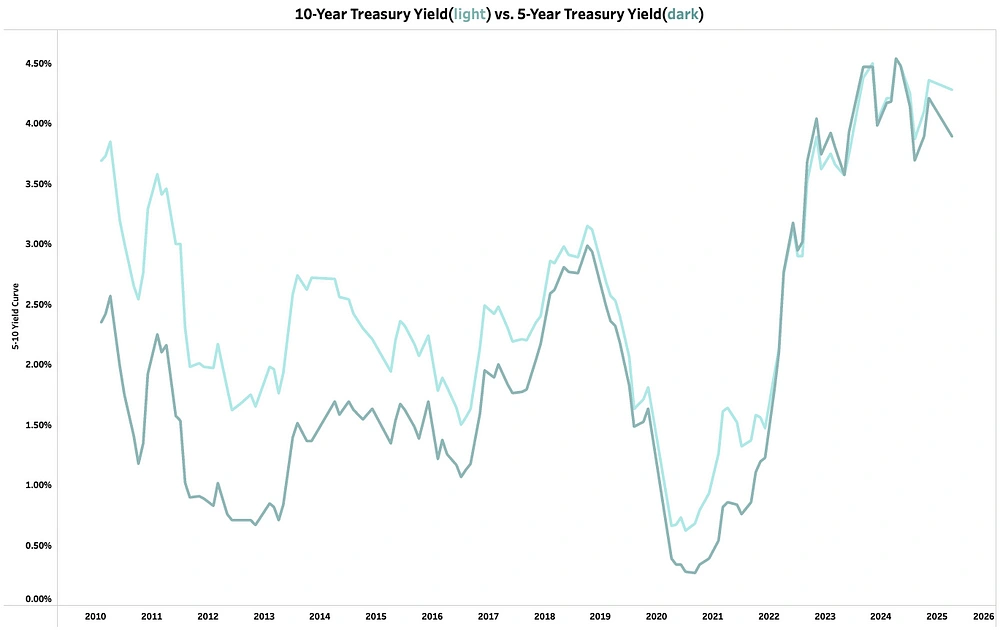
The 5–10 year Treasury yield curve is one of the most closely watched indicators of U.S. economic health due to its historical accuracy in signaling shifts in economic cycles.
A normal (upward-sloping) yield curve: where the 10-year yield is higher than the 5-year, reflects stable economic conditions and positive future expectations.
A flat yield curve: where the 10-year and 5-year yields are roughly equal, suggests growing uncertainty and a “wait-and-see” market.
An inverted yield curve: where the 10-year yield falls below the 5-year, often signals weakened economic conditions and has historically preceded recessions.
Looking at the chart above, we see that the 5–10Y Treasury yield spread has historically declined by a median of -1,830 basis points YoY. Since 2015, the spread has remained consistently below its 15-year average of 56bps, with only brief breaks above, notably in 2021, likely due to post-COVID reflationary optimism and aggressive fiscal stimulus.
Prior to 2017, the average spread was a relatively strong 97bps, even through macro disruptions such as the Eurozone Debt Crisis (2011) and the Oil Price Collapse (2014). However, since 2021, excluding early COVID volatility, the spread has averaged just 13bps, despite rising absolute yields in both the 5-year and 10-year bonds. This suggests mixed market expectations, where investors are pricing in higher-for-longer policy rates, but muted long-term growth prospects.
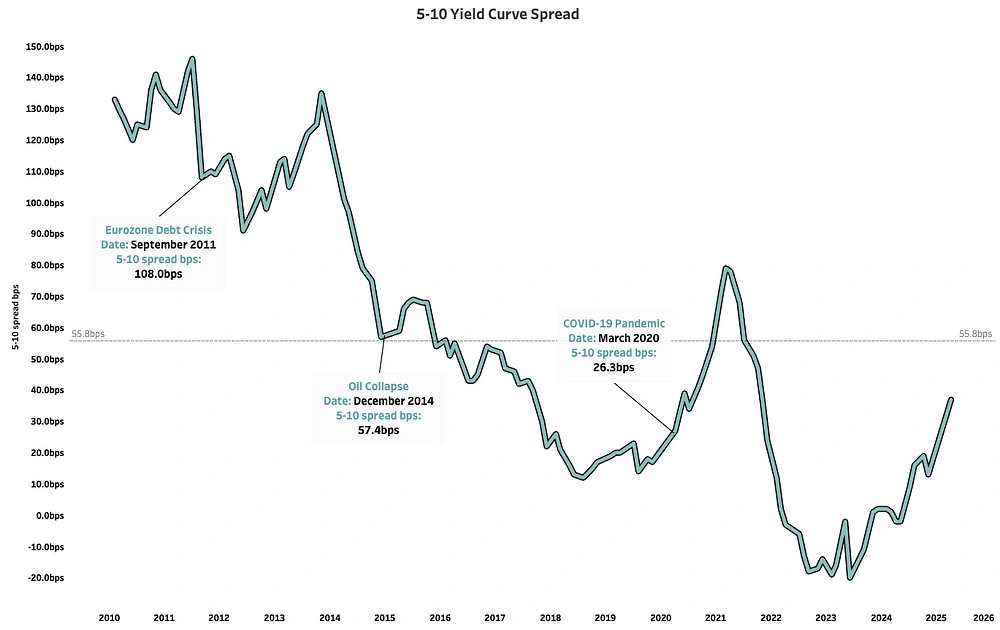
Although the yield curve returned to a more normal (positive) slope after its inversion in April 2022, recent macro uncertainty, including trade tensions and volatile inflation data, complicates the outlook. This flattening may reflect expectations of future rate cuts, but Fed Chair Powell and several analysts have signaled caution, emphasizing that near-term rate adjustments remain unlikely until inflation volatility subsides.
Bond ETF Market Overview
For this analysis we will focus on 4 important bond ETFs:
iShares 7–10 Year Treasury Bond ETF (IEF): This ETF tracks U.S Treasury bonds with maturities between 7 and 10 years. It typically performs well in moderate economic environments with stable interest rates and lower inflation expectations, and is sensitive to medium-term rate changes and unexpected monetary policy shifts.

IEF strikes a strategic balance in the Treasury market, offering lower volatility than long-duration bonds like TLT while providing more yield than short-term instruments such as SHY. With quarterly returns ranging between -10% and +10%, IEF appeals to investors seeking moderate duration exposure.
Historically, IEF has performed well during transitional market periods. It peaked ~6% during the 2011 Eurozone Debt Crisis as investors sought safety and yields fell amid Fed QE. In 2019 and 2020, IEF again outperformed, first as the Fed halted its tightening cycle, then during COVID market turmoil, when its intermediate duration offered a “safe middle ground.”
Notably, IEF dropped ~6% during the 2013 “Taper Tantrum”, as markets abruptly repriced interest rate expectations. A larger decline (~10%) followed in 2022, when the Fed’s aggressive rate hikes to combat inflation triggered a violent sell-off in intermediate Treasuries as yields surged.
iShares 20+ Year Treasury Bond ETF (TLT): This tracks long-term U.S Treasury bonds with maturities of 20 years or more. It’s highly sensitive to interest rate changes, and performs well in risk-off environments, economic slowdowns, or during rate cuts. It tends to suffer in inflationary or rising rate conditions.
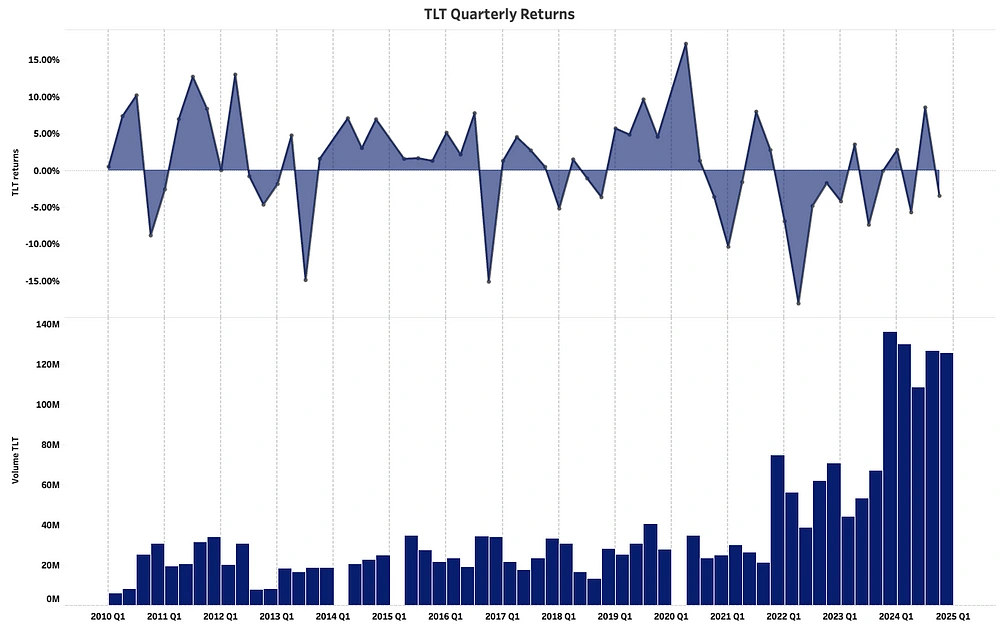
Historically TLT shows the most price volatility, with peaks ~12% and troughs ~-20%. Notable peaks in 2011 (Eurozone Debt Crisis) and 2020 (COVID-19 Pandemic) showcase TLT’s use in “risk-off” environments, where investors are expecting future markets to cool down.
TLT’s significant downturns in 2013, 2016, and 2022 each reflected violent repricing of long-term rate expectations, driven by abrupt shifts in monetary or fiscal policy. In mid-2013, the “Taper Tantrum” triggered a ~13% plunge as Fed Chair Bernanke’s surprise warning of QE reduction sparked a mass exodus from duration risk, with the 30-year yield surging 110 bps in months. Late 2016’s “Trump Reflation Trade” saw another ~10% drop as markets priced in fiscal stimulus and growth, rotating capital from defensive TLT into equities and short-duration bonds. The 2022 collapse, TLT’s worst year on record (-30%), stemmed from the Fed’s inflation war, where aggressive hikes pushed real yields positive and crushed long bonds.
iShares 1–3 Year Treasury Bond ETF (SHY): This tracks short-term U.S Treasury bonds with maturities between 1 and 3 years. Its less sensitive to interest rate changes, and acts as a defensive, low volatility holding during times of uncertainty or when investors expect higher short-term rates.
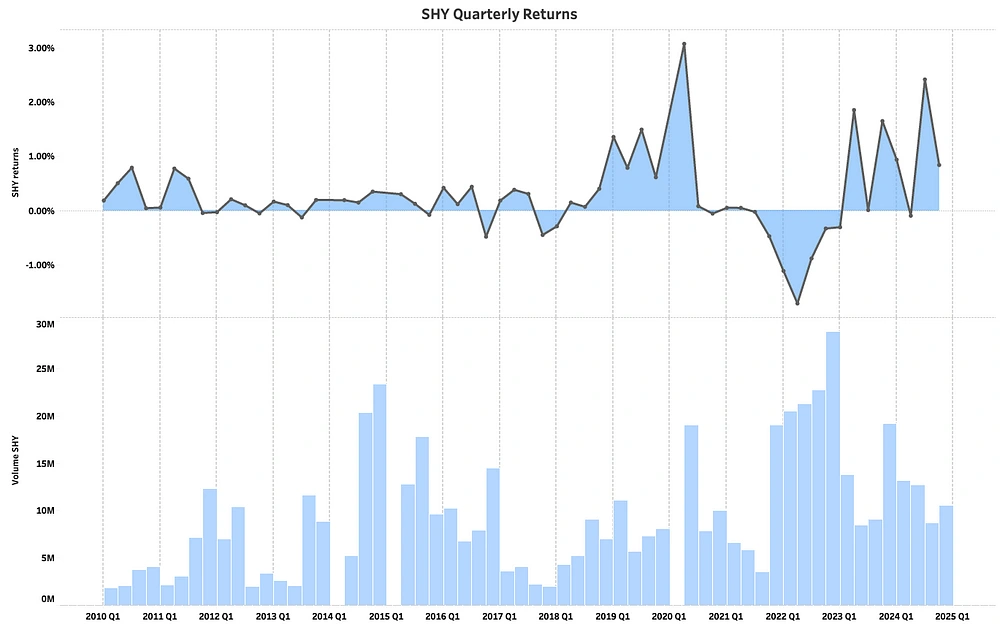
Historically, SHY has delivered stable but modest returns ranging from +3% to -1%, acting as a “safe haven” as seen in crises such as the Eurozone Debt Crisis (2011) and the COVID-19 Pandemic (2020), without the price swings seen in ETFs like TLT.
In 2019, we see SHY returns starting rise likely due to the Fed cutting rates three times during this period due to trade-war fears between U.S and China and slowing global growth. Investors started to pile into this low risk asset amid equity market uncertainty. The peak in 2020 was due to the Fed cutting rates to 0–0.25% and launched an emergency QE program. With investors fearing market uncertainty, investors flocked to SHY to prioritize capital preservation over yield returns.
Conversely in 2022 we see SHY drop to a 15-year historic low, this was due to both the Fed started aggressively raising rates going from 0.25% to 4.5% in year end, and a correction in the market due to the peak returns in 2020.
iShares TIPS Bond ETF (TIP): This tracks Treasury Inflation-Protected Securities (TIPS), which adjust with the CPI to preserve purchasing power. It performs well in rising inflation environments, and offers protection against real value erosion due to inflation expectations.
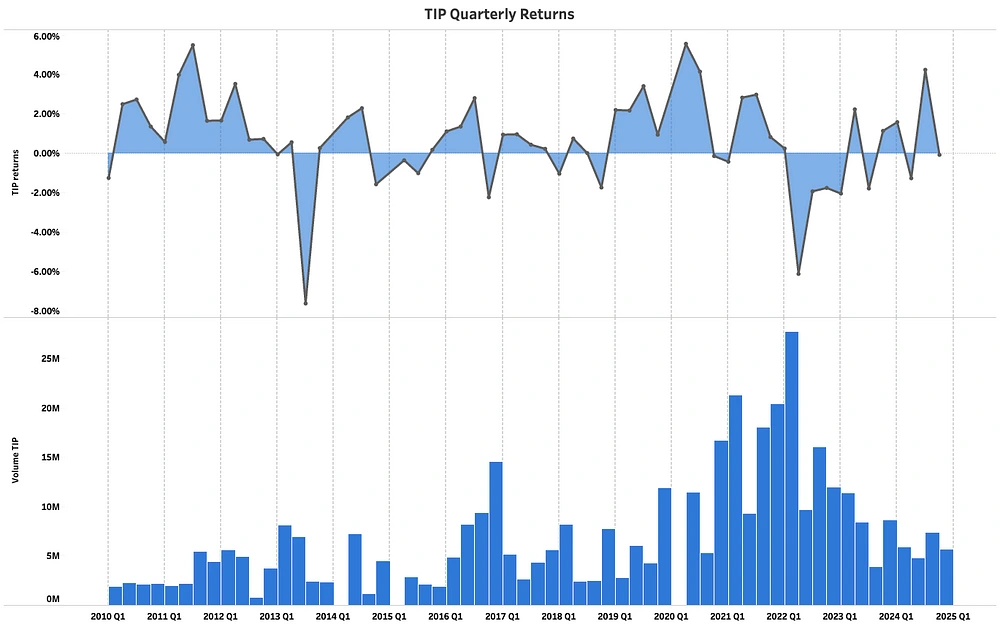
TIP has historically been a hedge against rising inflation and shows moderate volatility, but much less than long-term treasuries like TLT ranging from ~5% to ~-6%.
A notable peak in 2011 was observed due to the Eurozone Crisis where investors piled into TIPS as a double hedge against both Eurozone contagion and potential QE-induced inflation. Another peak occurred between 2019 and 2020 where Fed rate cuts and COVID stimulus ignited inflation fears even before CPI surged. This caused TIP to rally as investors preemptively bought protection against the money printing consequences.
We notice a sharp decline in 2013 again due to the “Taper Tantrum” as inflation expectations were crushed. Another noticeable trough was in 2022 due to the “Fed’s Inflation War” where they aggressively hiked rates, pushing real yields positive making TIPS less attractive.
Bond Yields and ETFs Correlation
Looking at each bond instrument by itself can only tell half of the picture and leaves out crucial insights on current and future market expectations. This next analysis looks at bond ETF returns and normalized market share in each 5–10Y bond spread regime.
5–10Y Bond Spread Regimes
“Normal”: 5–10Y bond spread is > 50bps
“Flat”: 5–10Y bond spread is ≥0bps and ≤50bps
“Inverted”: 5–10Y bond spread is < 0bps
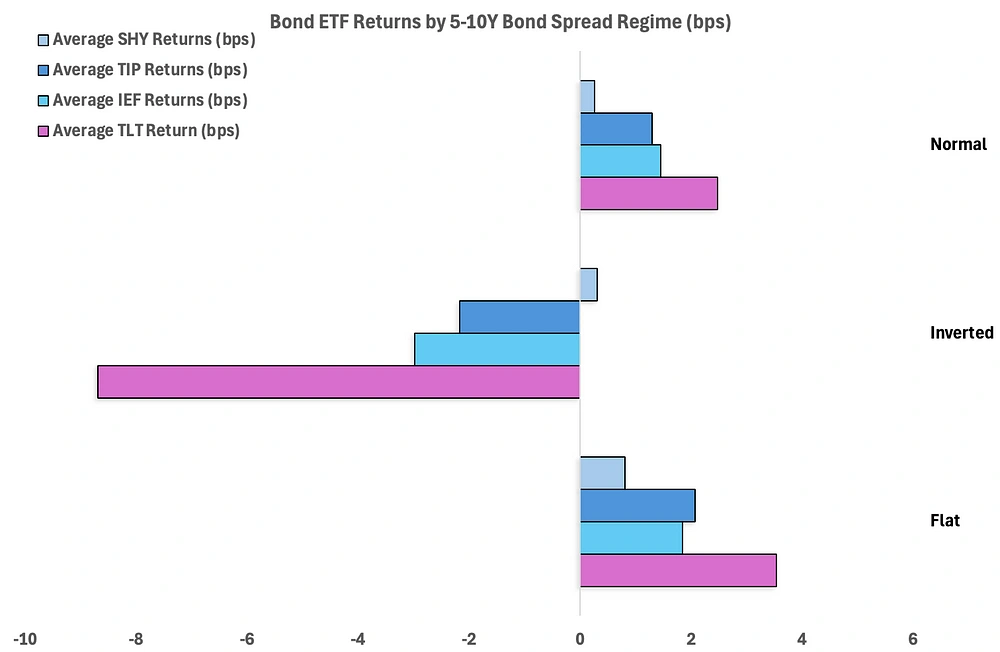
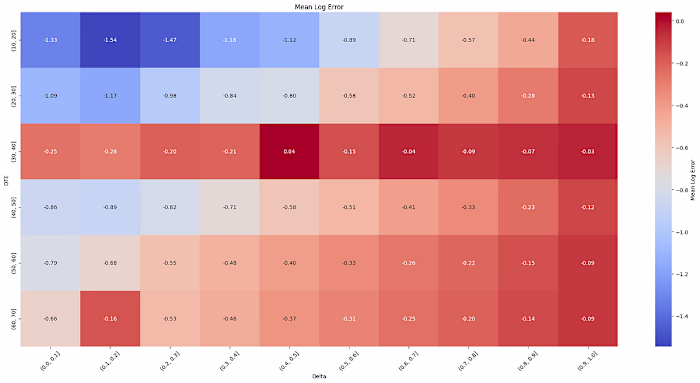
Normal Market Analysis:
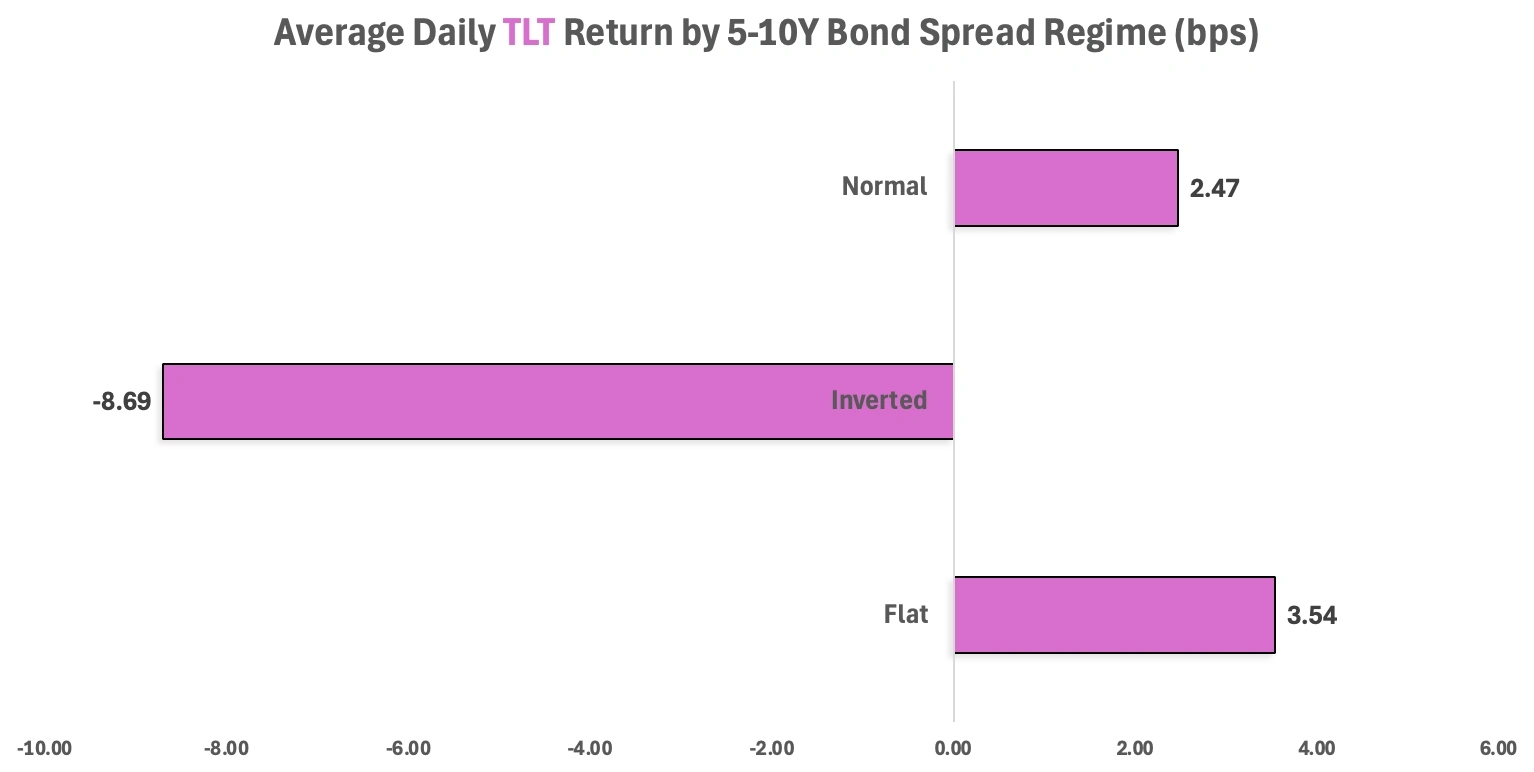
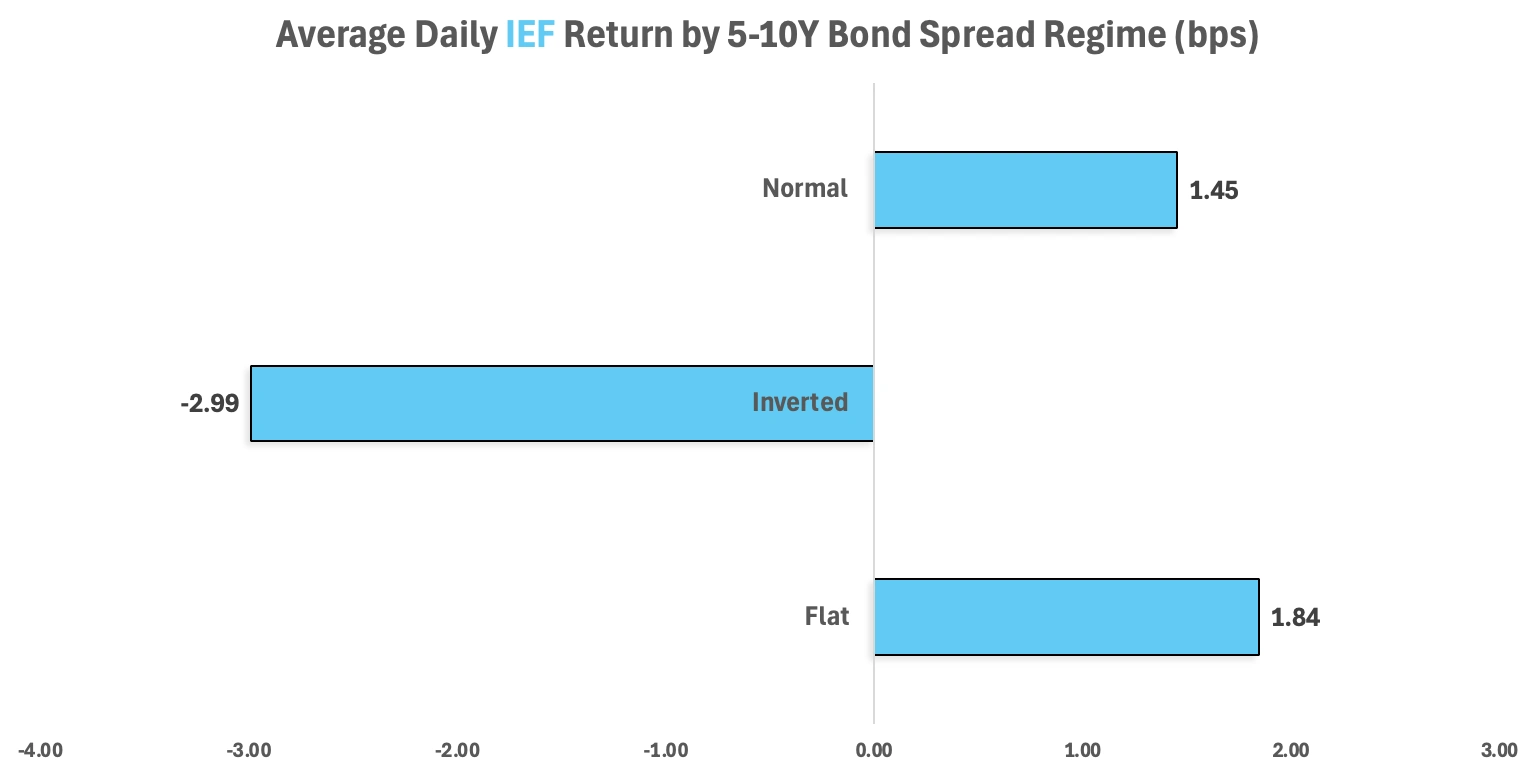
During normal market regimes, all four ETFs realized positive daily average returns, with the strongest returns coming from TLT (2.57bps) and IEF (1.54bps). Due to normal 5–10Y bond spreads encouraging future economic growth, long duration bonds like TLT are favored by investors as they provide high returns and investors are more risk-on due to duration risk being less prevalent. IEF shows high returns as well due to its placement as a long duration security, offering confident returns in a strong market, while also being favorable to investors who are more risk-averse and want to less exposed to any risk associated with sudden shift in monetary policy.
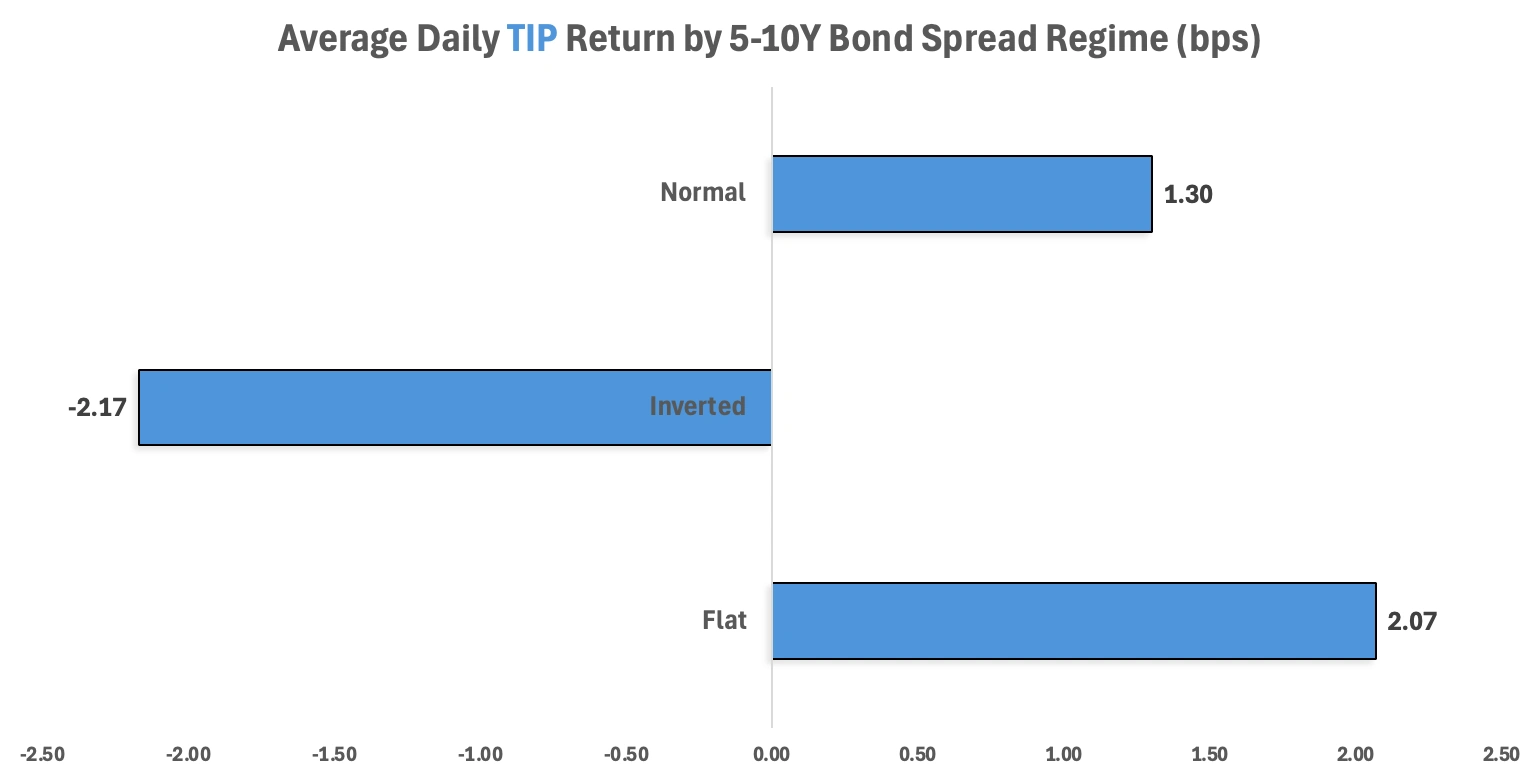
TIP saw similar returns to IEF at 1.30bps, but due to inflation staying relatively constant during normal market regimes, the demand for inflation protected securities is minimized compared to different markets where inflation protection is more desirable while maintaining a positive long-term economic outlook.
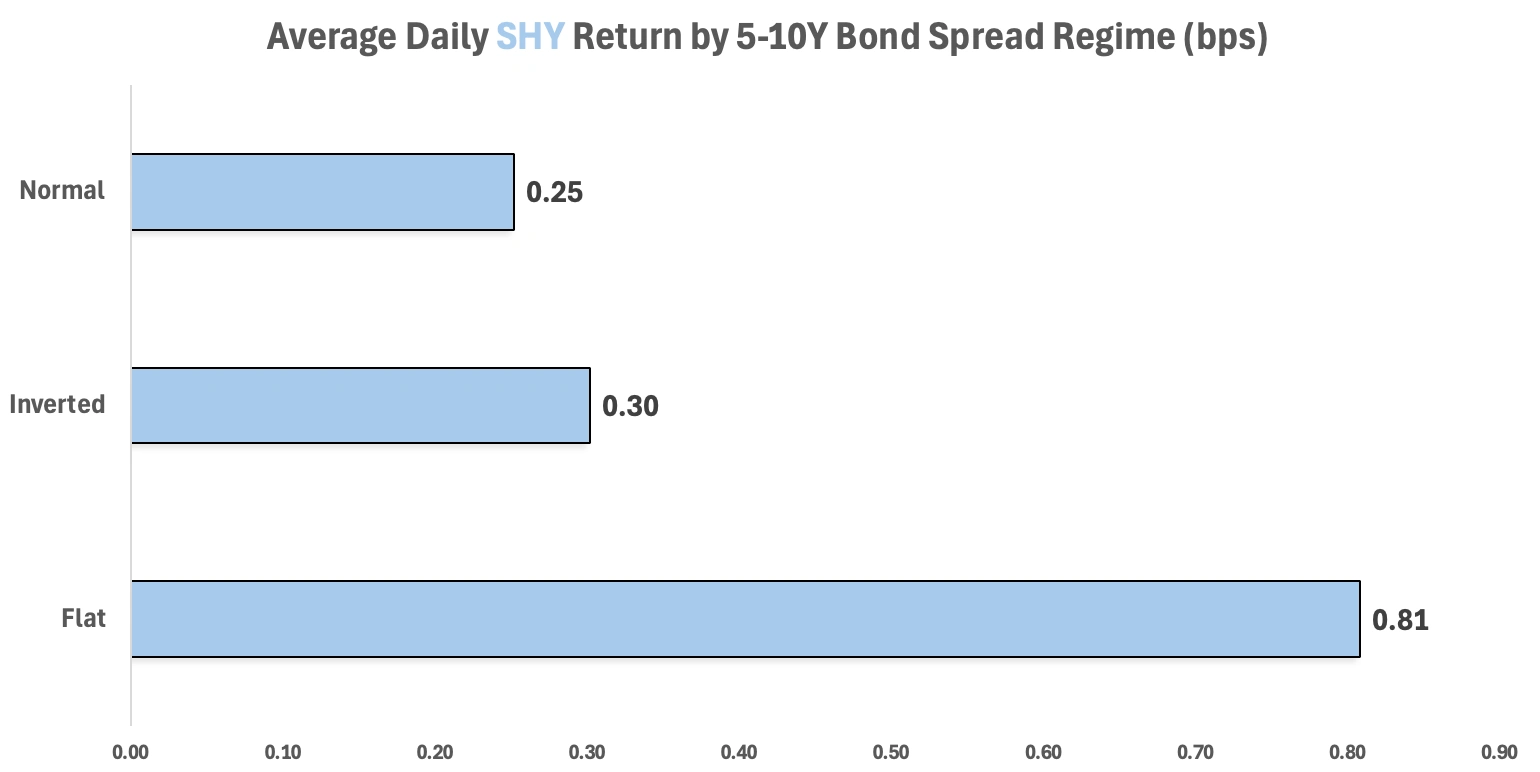
SHY sees the lowest daily average return (0.25bps) due to two main reasons. One being that historically SHY achieves muted returns due to its role as a safe-haven asset during all market regimes. Another being that during normal market regimes, longer-duration Treasuries offering higher yields and a greater potential for large gains.
Flat Market Analysis
Similar to normal markets, flat market regimes show positive average daily returns for all ETFs with TLT and TIP showing the largest returns of 3.54bps and 2.07bps for TLT and TIP, respectively. TLT sees the highest returns due to investors anticipating volatility normalization in the bond market, which tends to favor TLT’s duration. Flat curves also precede an inverted yield curve, and investors may flock to TLT to purchase it, as historically TLT is sold at a premium when the yield curve is inverted. TIP shows the next highest returns at 2.07bps due to investors starting to shift their views and starting to allocate capital to more inflation protected securities. In these environments, investors often anticipate upcoming rate adjustments, either hikes to combat inflation or cuts in response to slowing growth, but with uncertainty about the Fed’s next move. This uncertainty can increase demand for inflation-protected securities like TIPS, especially if inflation is still elevated but perceived as peaking. Additionally, a flat curve often implies confidence in the Fed’s ability to anchor long-term inflation expectations, making TIPS relatively attractive as a hedge
IEF shows similar returns to TIP holding a daily average of 1.84bps. This is because flat market regimes cause investor uncertainty, which leads to a flight from risk assets toward safer options like Treasuries. IEF, positioned in the intermediate part of the curve, benefits from both safety-seeking inflows and expectations of future rate cuts. TIP’s returns breaks above IEF in this market compared to a normal market regimes due to investors starting to shift their funds to inflation protected securities due to fears of monetary policy shifts and spikes in inflation.
SHY again shows muted returns of 0.81bps compared to other ETFs, however a flat market is where it performs dramatically better than SHY in other markets. This is likely reflecting increased investor uncertainty around future Fed policy. With markets unsure whether the curve will normalize or invert, many turn to short-term Treasuries as a low-risk hedge.
Inverted Regime Analysis
In an inverted market, TLT, TIP, and IEF all show negative daily average returns of -8.69bps, -2.17bps, and -2.99bps. For TLT, this is driven by panicked sell-offs in the market, as the start of the inversion signals an impeding recession. During this time investors may flock to shorter term securities, but TLT can also rebound during the late stages of inversion as talks of rate cuts start to appear. Despite TIP being a protection against inflation, its negative daily average returns may reflect market expectations of declining inflation, rising real yields, or a broader flight from risk assets, even those offering inflation protection. For IEF, its negative return is likely due to the Fed front-loading rate hikes, which pushes intermediate yields sharply higher, driving bond prices lower. Additionally, during severe inversions, investors may instead favor very short-duration (SHY) or very long-duration (TLT) bonds depending on inflation expectations, further weakening demand for IEF.
SHY is the only ETF shown here that holds positive returns in inverted market regimes with a an average daily return of 0.30bps. This resilience stems from its ultra-short duration, which shields it from the price volatility caused by rising yields. As the Fed front-loads rate hikes and the curve inverts, SHY becomes a defensive parking spot for investors seeking capital preservation with minimal interest rate exposure.
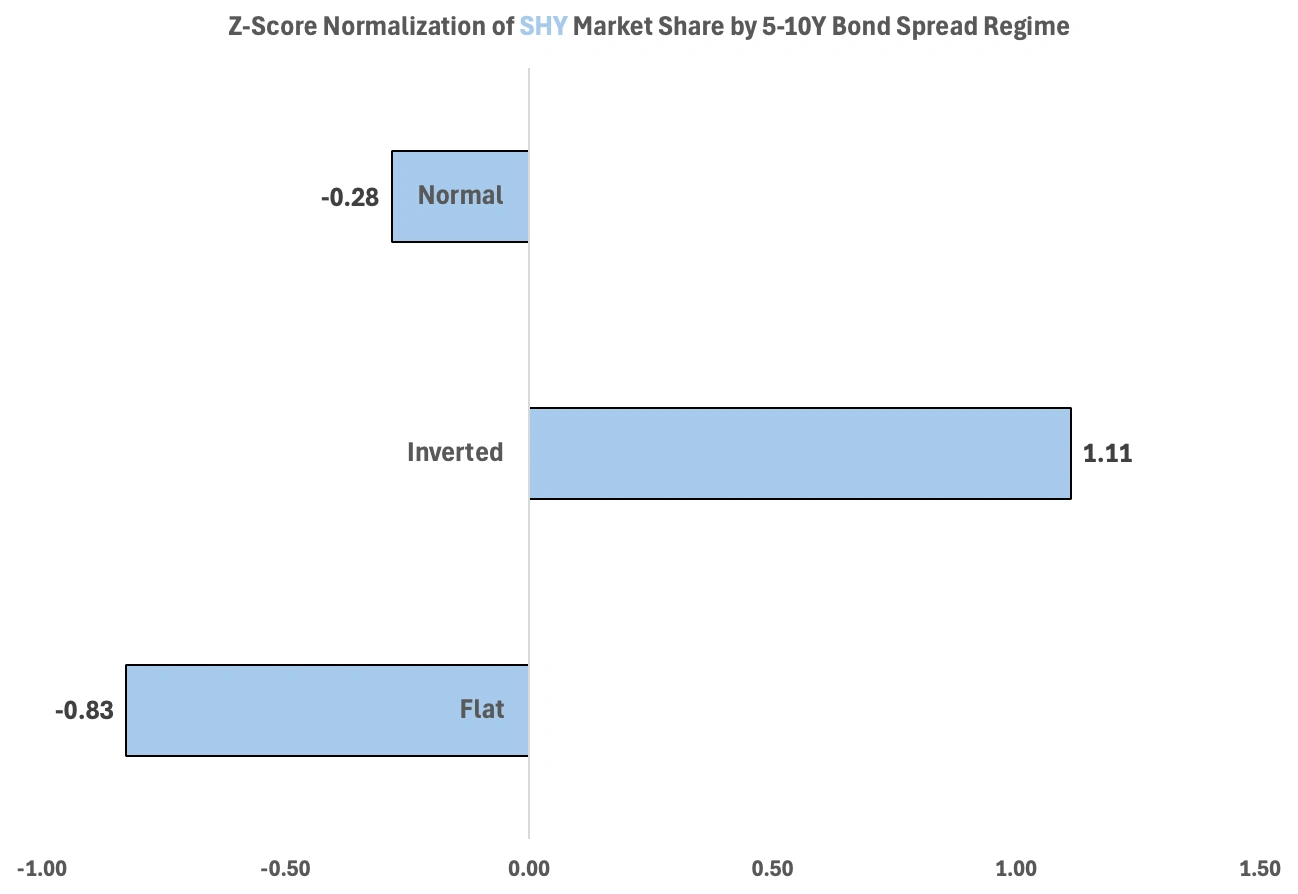
Z-Score Normalization of ETF Bond Market Share
Due to TLT being traded much more than any other bond ETF in the market, looking at raw market share will always skew towards TLT and misrepresent any certain analysis looking at volume trading behaviors in the bond market.
Z-Score Calculation:
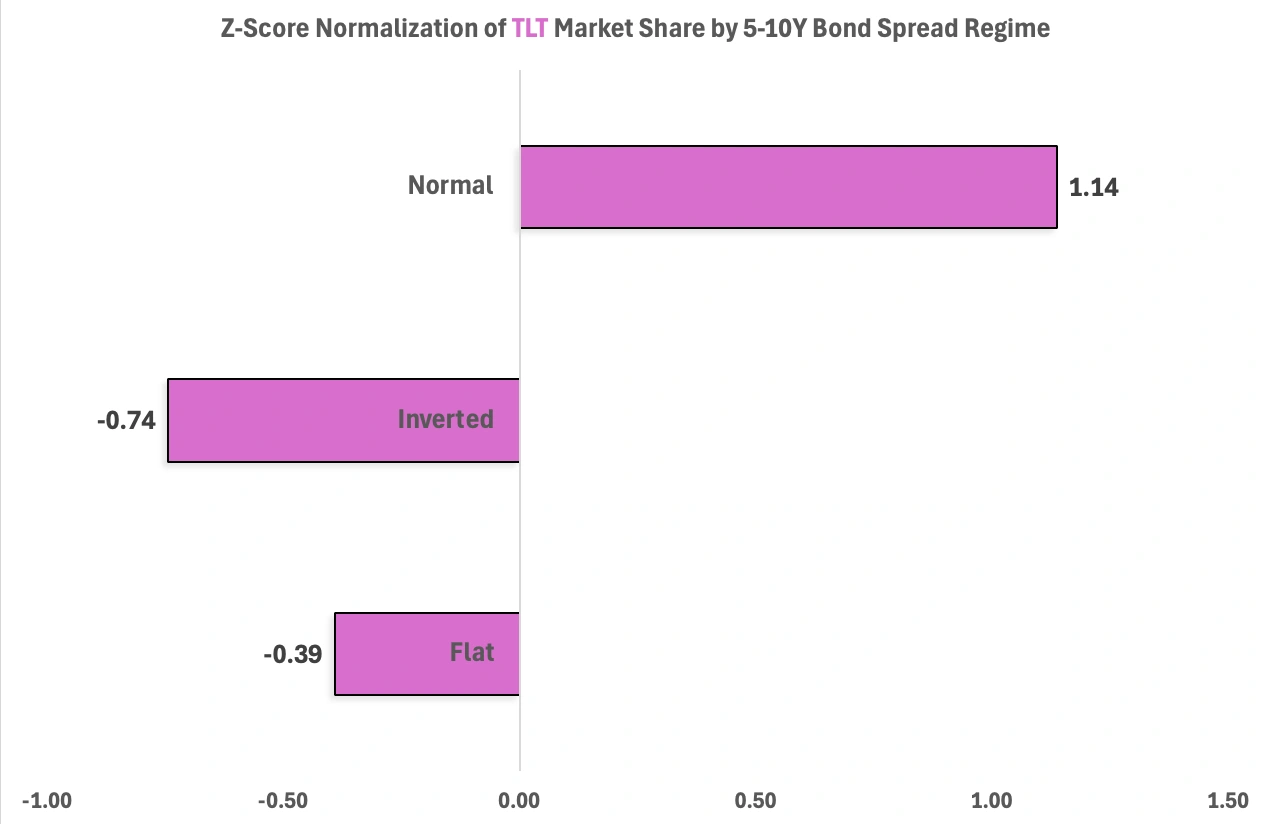
To normalize market shares for each ETF, we use the typical Z-score calculation. Below TLT’s Z-score in a flat market regime:
(TLT flat market regime market share — Average TLT market share across regimes) / Standard deviation of TLT across regimes:
(62.03% — 62.96%) / 2.39% = -0.39
Z-Score Metrics
> 0: ETF is traded above its average market share
< 0: ETF is traded below its average market share
=0: ETF is trading at its average market share
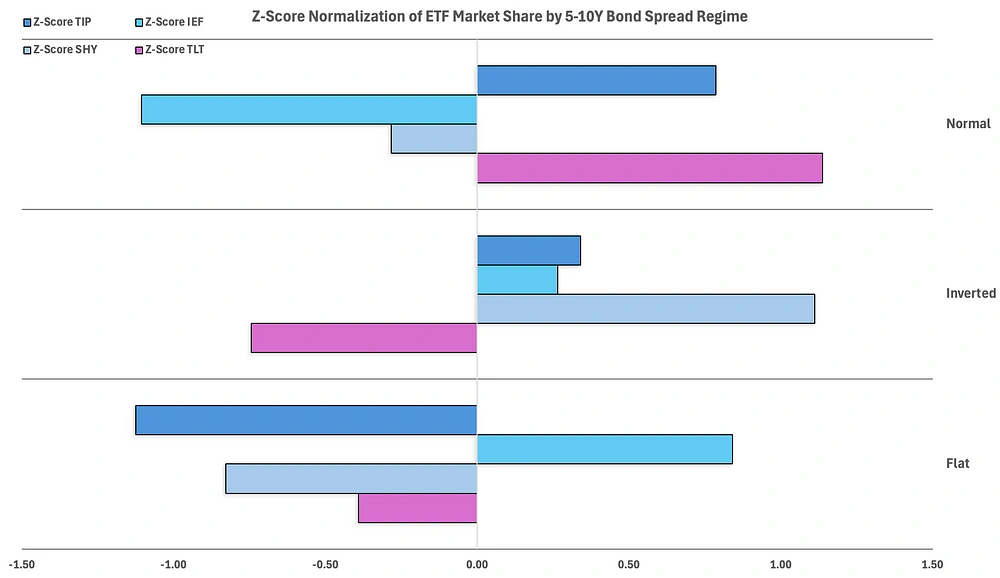
Normal Regime Analysis:
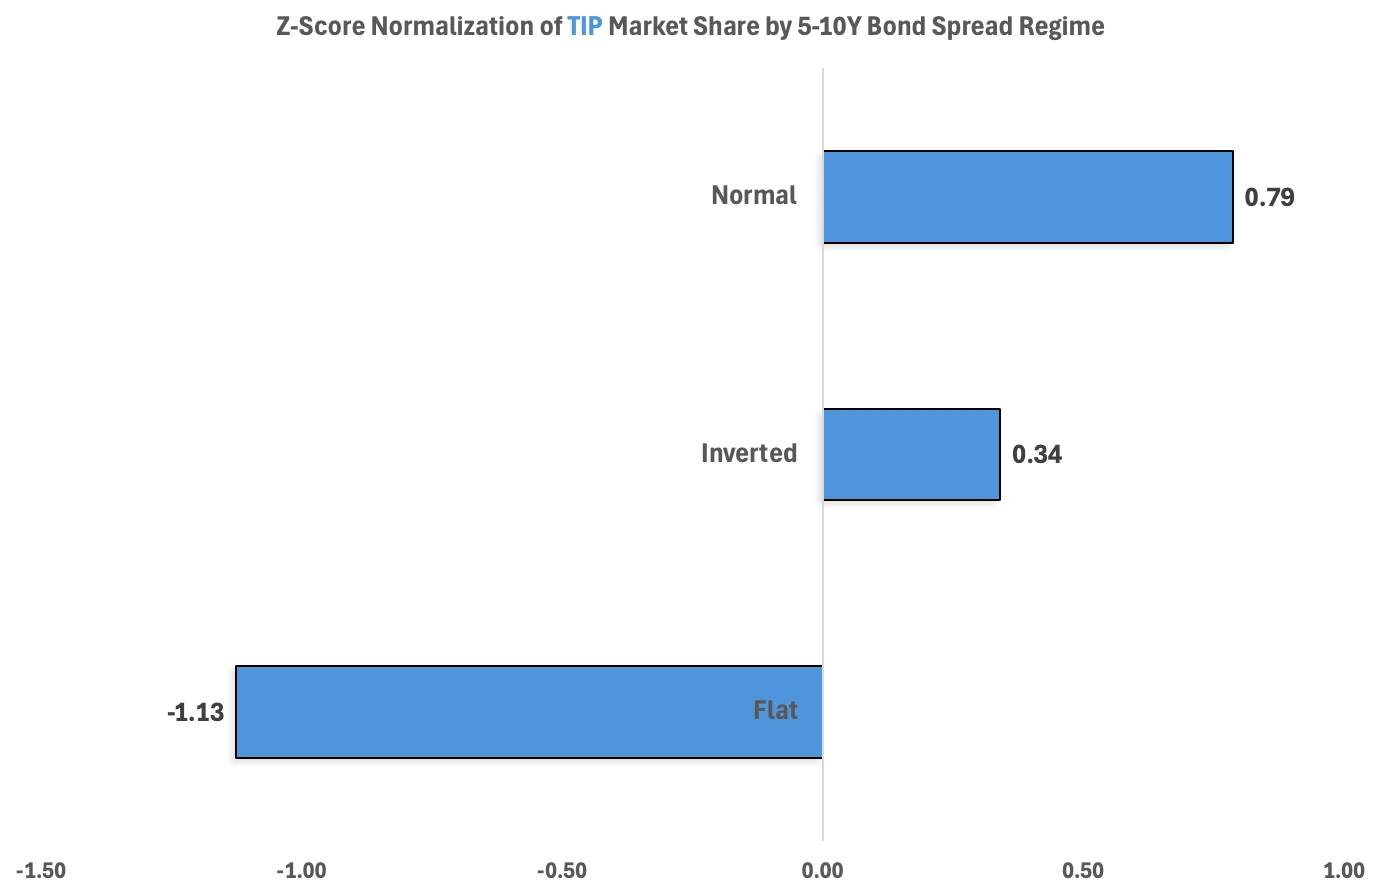
Both TIP and TLT exhibit strong positive Z-scores of 1.14 and 0.79, respectively, during normal yield curve regimes, highlighting investor preference for longer-duration bonds when the economy is stable and inflation is manageable. In such environments, the curve is upward-sloping, and investors may be positioning for gradual rate cuts or slowing growth, which benefits assets with more duration exposure and potential for price appreciation. TIP’s inflation protection becomes less of a hedge and more of a bonus feature in this context, especially if inflation remains stable but elevated.
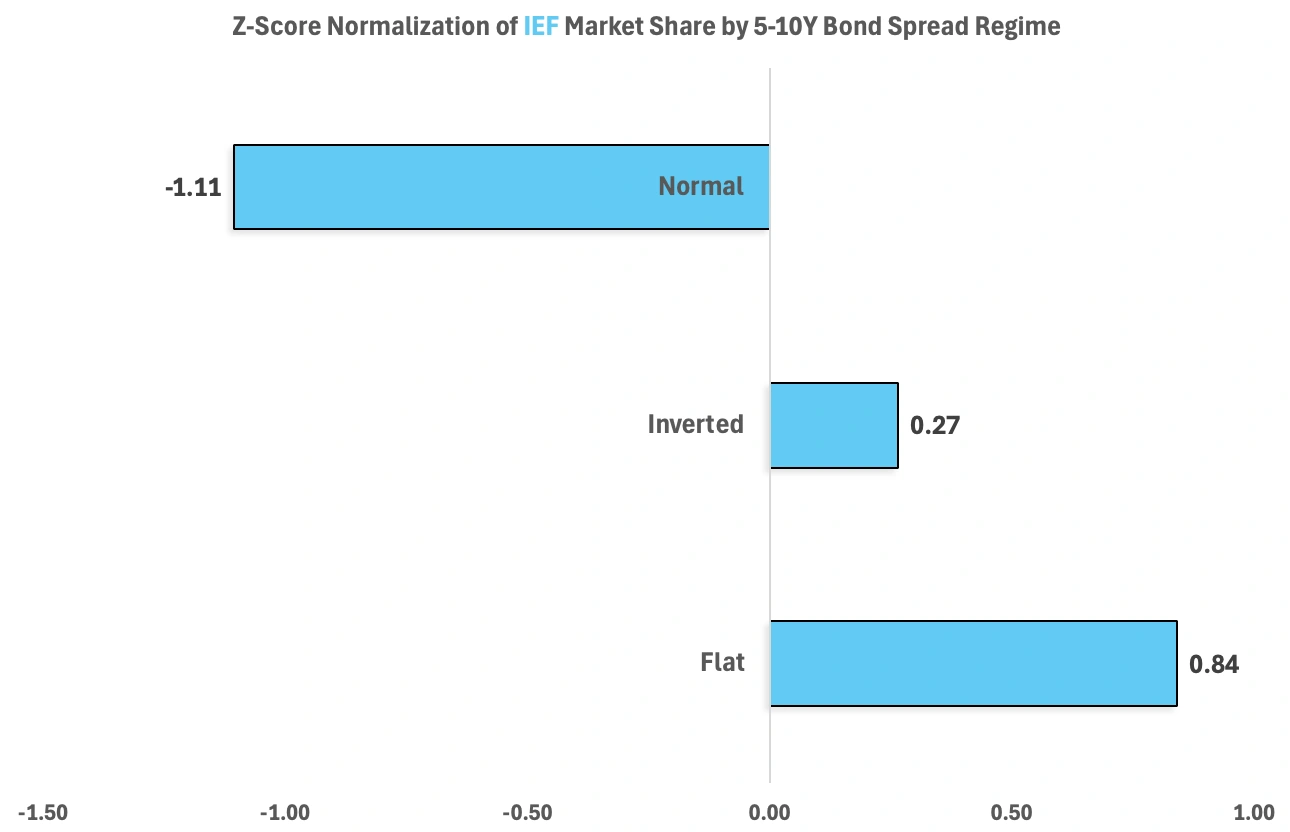
Conversely, IEF and SHY post negative Z-scores of -1.11 and -0.28, indicating lower investor interest in intermediate and short-duration bonds. With reduced concern about interest rate volatility or inversion risk, there is less demand for the safety and liquidity SHY provides. IEF, sitting in the middle of the curve, becomes less attractive as it offers neither the yield pickup of longer-term bonds nor the flexibility of shorter-duration ones. Investors may prefer to lean into duration (TLT, TIP) in pursuit of capital gains when rate expectations are stable or declining.
Inverted Regime Analysis:
During inverted yield curve regimes, TIP, IEF, and SHY all exhibit positive Z-scores of 0.34, 0.27, and 1.11, respectively, reflecting investor shifts toward lower-duration and inflation-protected assets. With interest rate risk elevated and policy uncertainty high, TIP becomes more attractive as it offers inflation protection while maintaining some duration exposure. Its modest Z-score suggests moderate investor interest, likely as a hedge rather than a growth play.
IEF’s positive Z-score of 0.27 indicates a limited but strategic allocation to intermediate-duration bonds. Investors may view IEF as a middle-ground position, offering less duration risk than TLT, yet more yield than SHY, while expressing hope for future curve normalization and price recovery.
SHY stands out with the highest Z-score of 1.11, highlighting its role as a safe-haven during heightened volatility and monetary tightening. Investors often rotate into ultra-short duration assets like SHY to minimize interest rate sensitivity, preserve capital, and take advantage of elevated front-end yields during aggressive Fed hiking cycles.
In contrast, TLT is the only ETF with a negative Z-score (-0.74) in this regime. This reflects broad investor aversion to long-duration Treasuries, which are highly sensitive to rising yields and duration risk. In an environment where the Fed is aggressively tightening and future growth is uncertain, TLT becomes less desirable due to both mark-to-market losses and pessimism over long-term economic prospects.
Flat Regime Analysis:
During flat market regimes, TLT, TIP, and SHY all exhibit negative Z-scores of -0.39, -1.13, and -0.83, respectively. These figures suggest a reduction in investor allocation to both long-duration and inflation-protected assets. A flat curve typically signals heightened uncertainty around future economic conditions or monetary policy, with markets unsure whether the yield curve will steepen or invert.
TIP’s strongly negative Z-score (-1.13) suggests inflation-protected securities fall out of favor in this regime. This could reflect diminished inflation concerns and a market expectation that the Fed will maintain control over inflation, making the inflation hedge less attractive.
SHY’s Z-score of -0.83 may seem counterintuitive, given its defensive characteristics, but it could indicate that investors are looking beyond ultra-short-term safety and seeking duration exposure in anticipation of a curve steepening or rate cuts, events that would benefit longer-term bonds.
TLT, with a Z-score of -0.39, also sees reduced interest, likely due to the balance between high duration risk and lack of a clear rate-cut signal. Investors may hesitate to fully commit to long-duration assets when the curve is neither rewarding long-term bets nor indicating strong economic confidence.
IEF is the only ETF showing a positive Z-score value of 0.84, indicating increased investor allocation during flat market regimes. This preference reflects IEF’s strategic middle-ground positioning: it offers a balance between yield and duration without the excessive volatility of long-term bonds like TLT or the limited return potential of ultra-short-term instruments like SHY. In an environment where the yield curve is flat, often signaling uncertainty or an inflection point in monetary policy, investors may favor intermediate-duration bonds as a flexible, lower-risk allocation. IEF becomes a preferred choice, benefiting from its lower sensitivity to interest rate shifts while still offering moderate income and price stability.
Current Market Analysis
From January 2025 to June 2025 the 5–10Y Bond spread has stayed relatively flat due to certain geopolitical events, and massive uncertainty with U.S trade policies. For the analysis below, we are operating with the assumption that the spread has stayed flat.
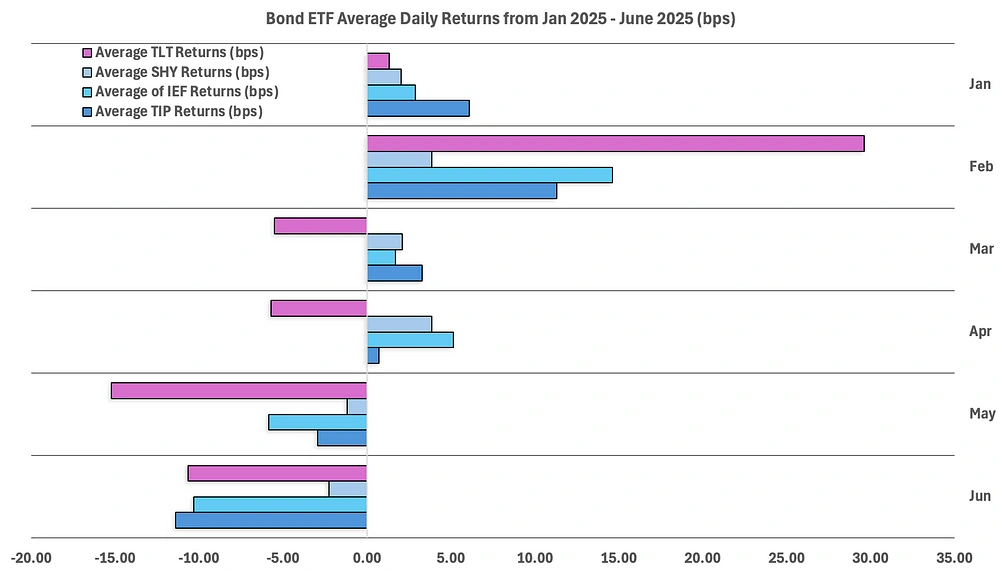

January & February:
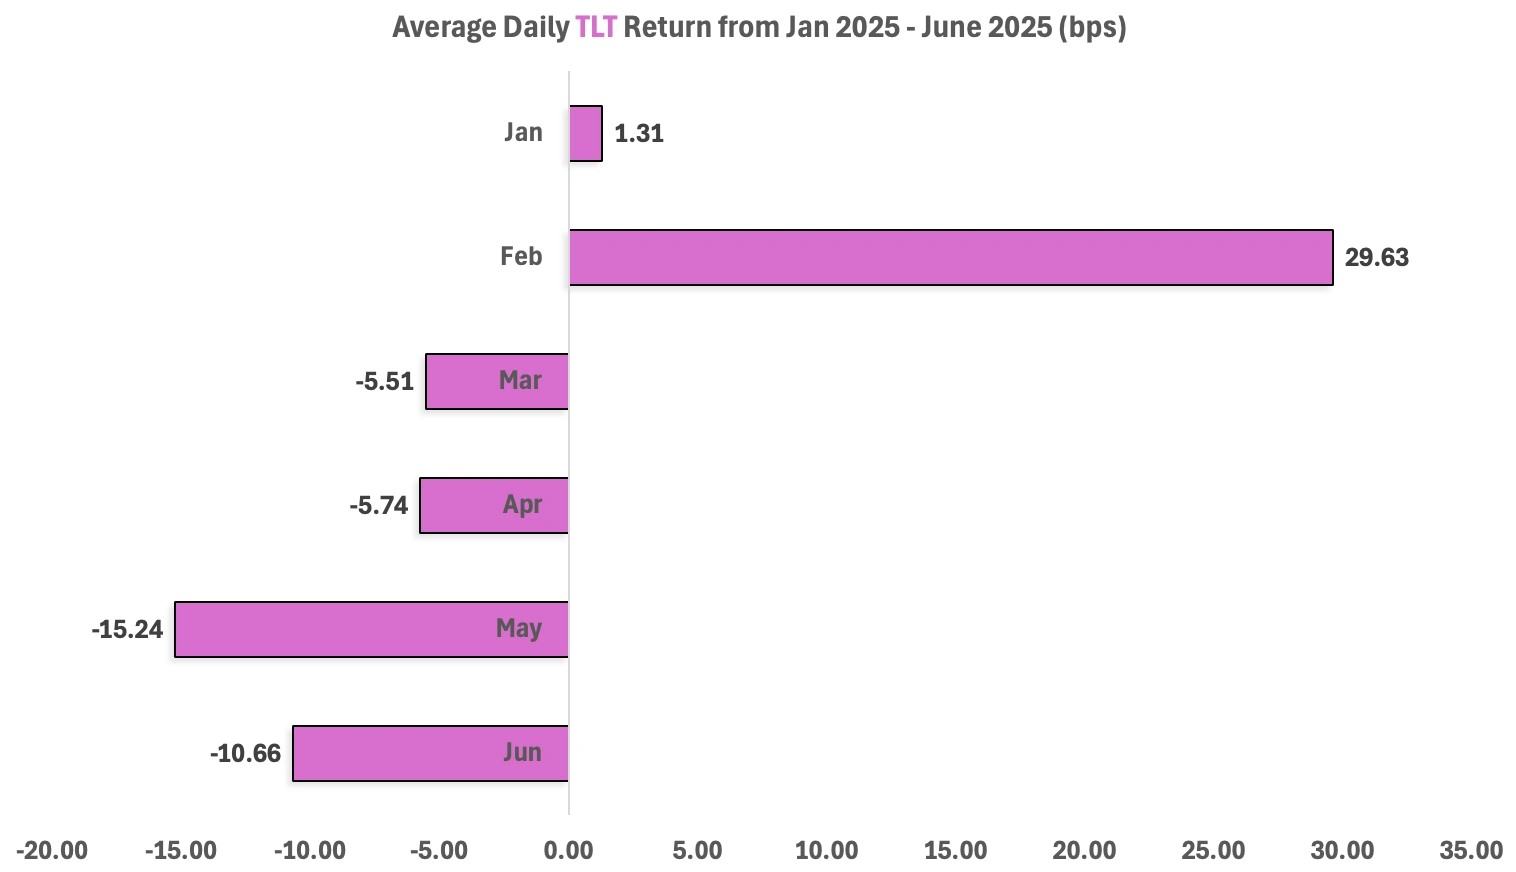
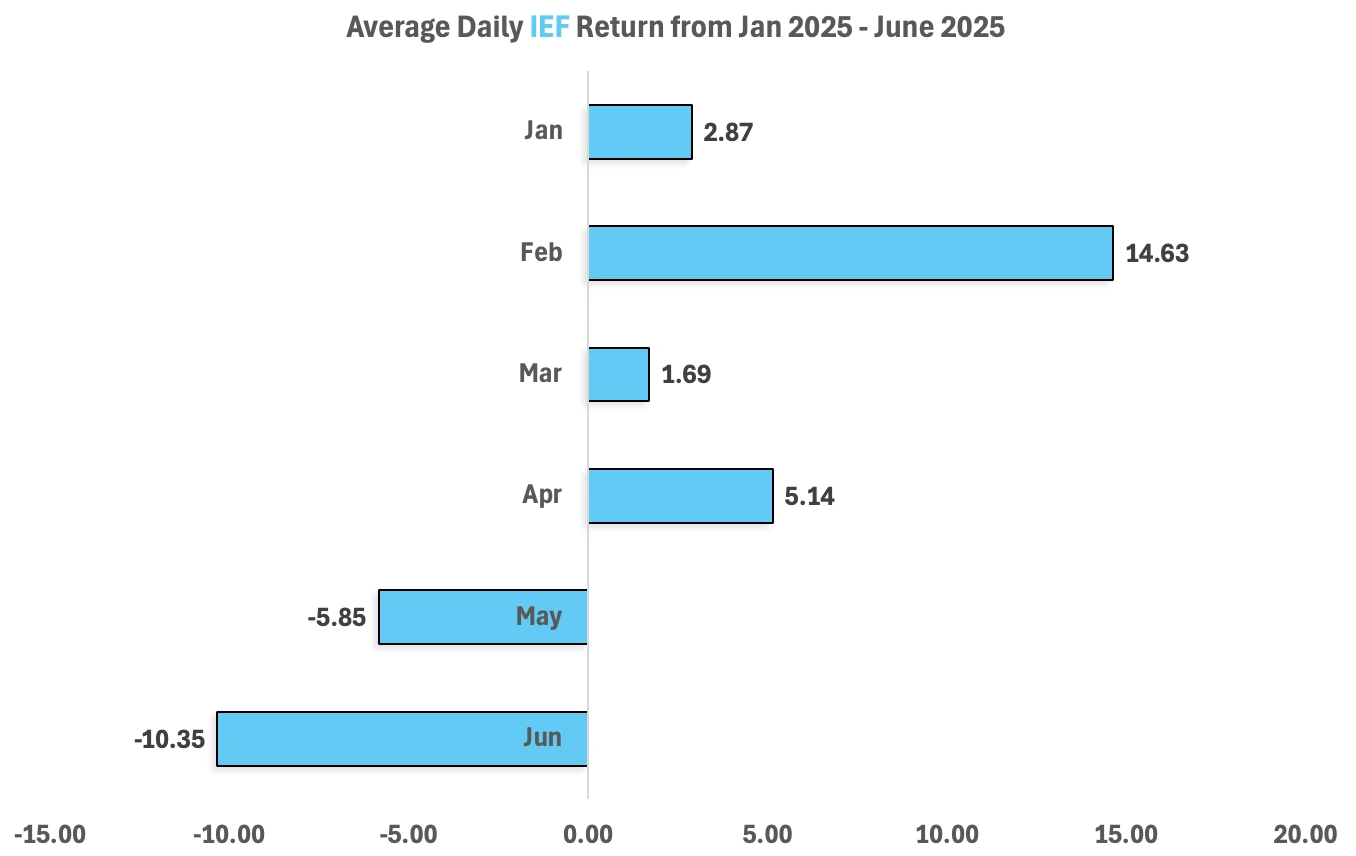
TLT saw massive gains in February (29.63bps) along with a large increase in IEF (14.63bps), likely driven by increased optimism about rate cuts or a macroeconomic inflection point. Investors started to flock into long-duration bonds expecting capital appreciation from declining rates, where investors were split between risk-averse looking to hold onto less medium-term duration bonds to hedge against unexpected monetary shifts, while some were willing to hold onto TLT due to it’s appeal of large gains in the market.
March & April:
In March and April, returns across all ETFs were modest, with one big inversion occurring in TLT. TLT is seen as the only bond ETF providing negative returns in March and April (-5.51bps and -5.74bps) due to expectations for an immediate Fed action cooling, as well as a market correction from its massive gains in February.
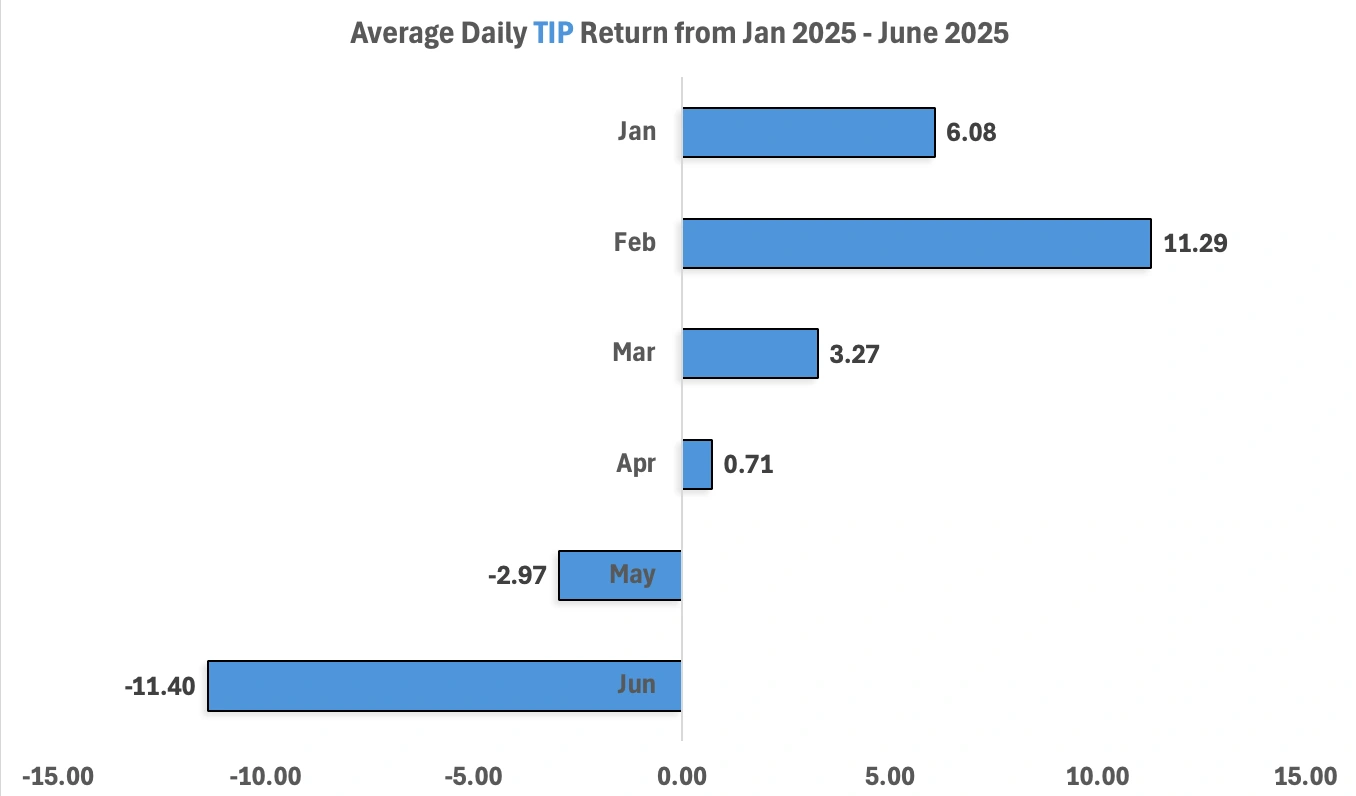
TIP and SHY maintained the highest returns during March at 3.27bps and 2.10bps, suggesting that investors started transitioning to defensive positioning amid mixed inflation data and policy ambiguity from the Fed.
In April, SHY and IEF showed the highest returns at 3.86bps and 5.14bps. This shift in IEF returns may reflect a growing investor preference for intermediate-duration bonds as market participants anticipated a potential pause or pivot in monetary policy. IEF’s performance suggests that investors were beginning to extend duration modestly, positioning for potential rate stabilization or declines, while still avoiding the heightened volatility associated with long-duration assets like TLT. SHY’s continued strength reinforces its role as a defensive allocation during uncertain environments, where capital preservation remains a top priority.
May & June:
May and June have marked a sharp downturn in the bond market, with every major bond ETF posting significant negative returns. In May, Fed Chair Jerome Powell reaffirmed that the Fed had little incentive to cut rates, particularly in light of rising economic uncertainty and renewed trade tensions tied to Trump-era tariff policies. This stance rattled fixed income markets, especially longer-duration bonds.
TLT, which represents long-term Treasuries, fell steeply by -15.24bps in May, followed by a smaller drop of -10.66bps in June. Although this indicates a mild recovery, IEF and TIP saw larger drawdowns in June compared to May, falling to -10.35bps and -11.40bps respectively. IEF’s decline reflects waning investor appetite even for intermediate-term bonds, while TIP’s fall likely signals expectations of stable inflation and limited near-term policy shifts by the Fed.
Perhaps most concerning is the underperformance of SHY in both May and June. Typically resilient in volatile or tightening environments, SHY has historically delivered muted but positive returns. Its recent deterioration may reflect a broader loss of confidence in the U.S. bond market as a whole. With short-term Treasuries no longer offering safety or upside, investors appear increasingly wary of committing capital amid mounting concerns over economic fragility and policy stagnation.

January & February:
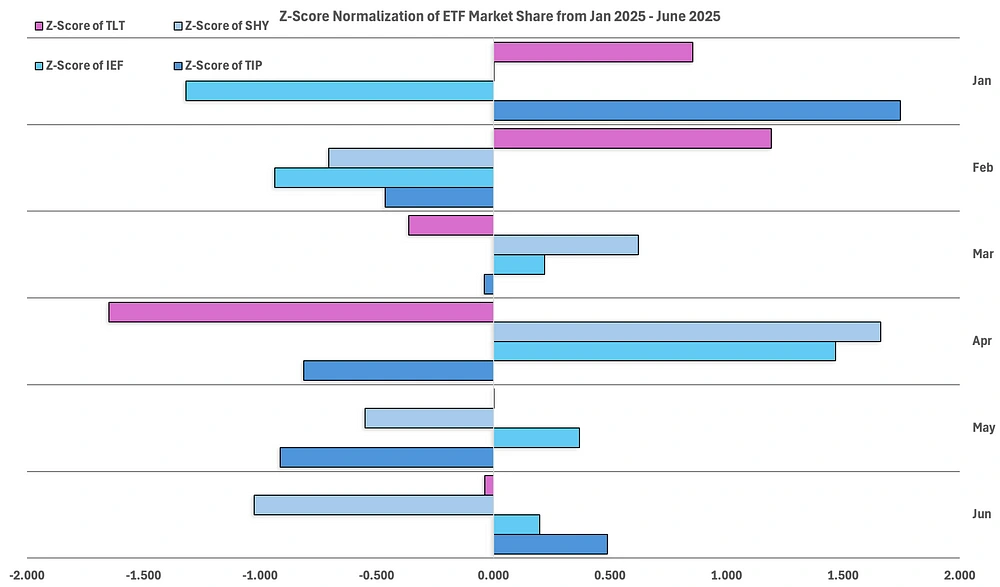
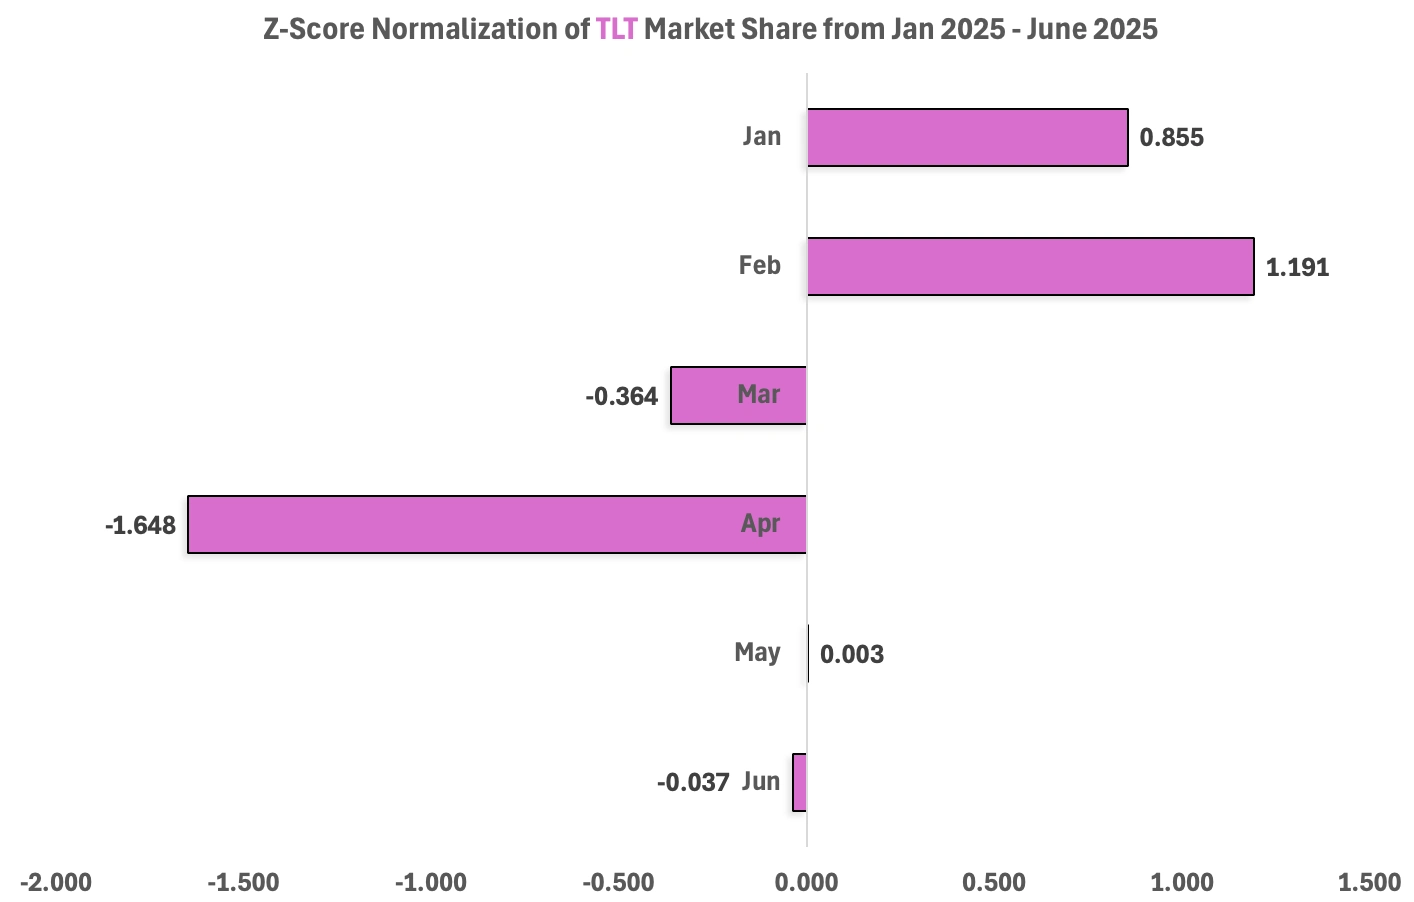
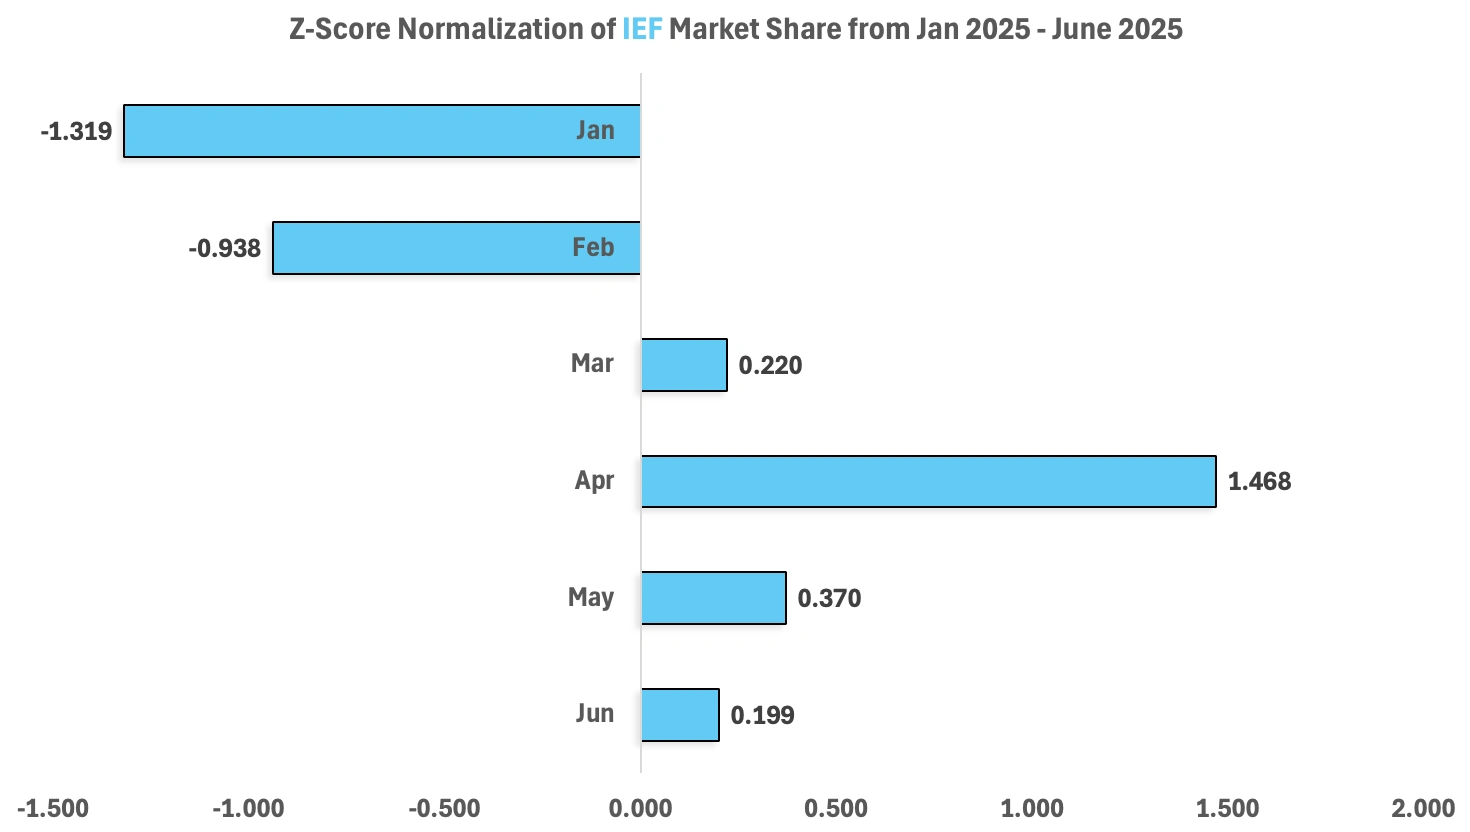
TLT and TIP both start the year with strong positive Z-scores, suggesting investors favored longer-duration and inflation-protected assets, typical behavior when perceived confidence in the market is shown. IEF shows a large negative Z-score of -1.319, which aligns well with investor sentiment flocking to longer-duration bonds, looking to capitalize on its historic high returns during strong economic conditions.
March & April:
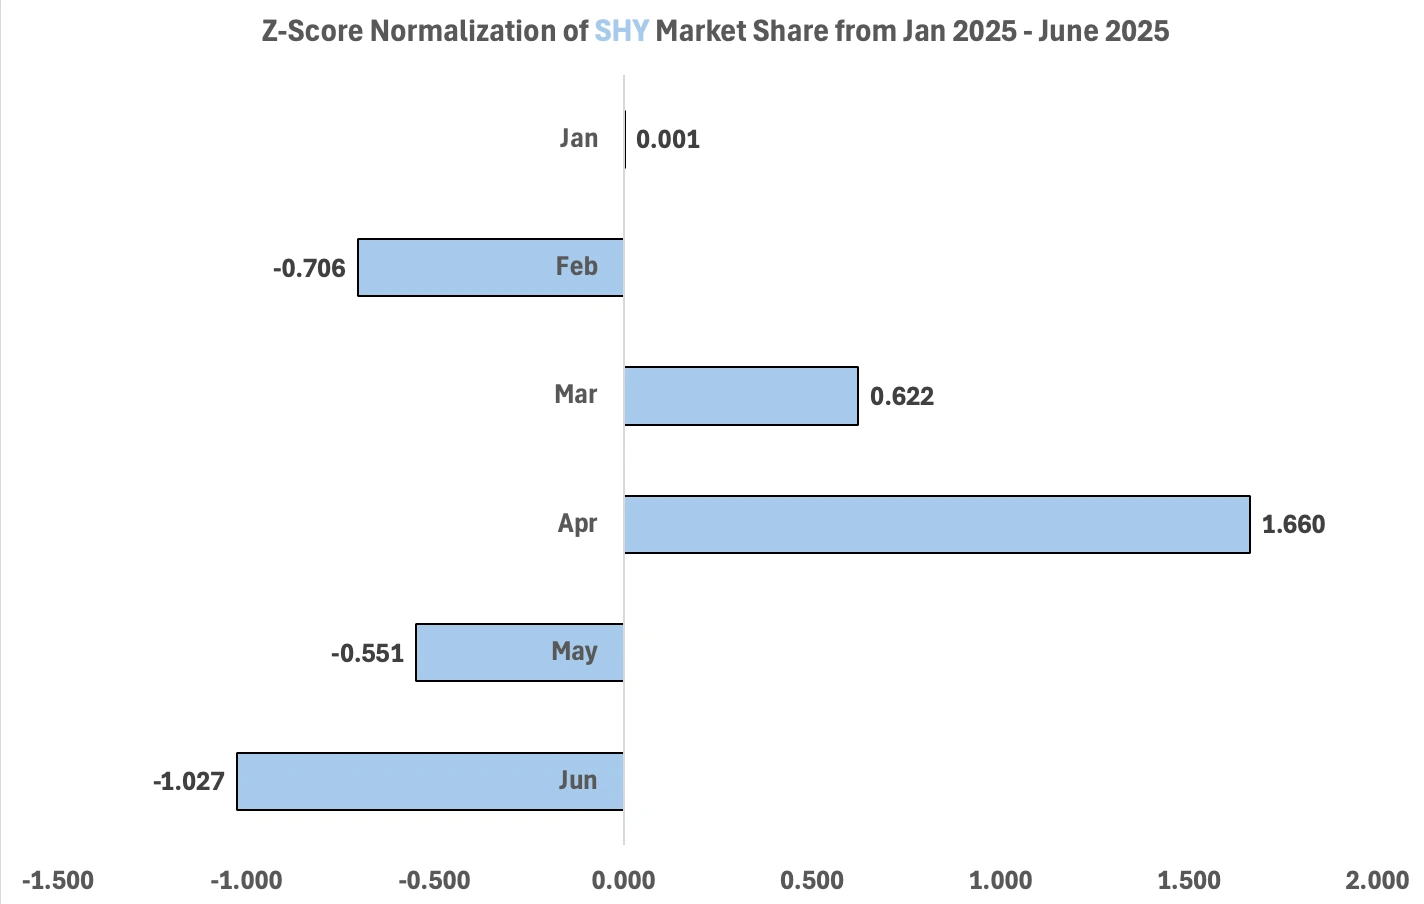
In March and April, investor sentiment starts to shift as future economic outlook started look more pessimistic. TLT and TIP start to compress in March shifting to -0.364 and -0.040. SHY sees the largest Z-score in March at 0.662 suggesting investors started shifting to shorter-duration assets amid economic uncertainty and investors flocking to preserve their capital.
In April these Z-scores were amplified with TLT having a Z-score of -1.648 and TIP having a Z-score of -0.914. This large drop in market share during this time for these two assets was due to investors already having have shifted their assets in March and and investors maintaining a “wait-and-see” mentality. Conversely, SHY and IEF raised to Z-scores of 1.660 and 1.468. Similar to March, investors started to shift their portfolios in shorter-term bonds as Fed policy remained stagnant and economic outlook started appear more fragile amid the Tariff wars and loss of confidence in U.S markets.
May & June:
All ETFs began moving closer to their mean in May and June, with TLT recovering the most, now trading very close to its historical average. This recovery may reflect short-term bargain hunting or repositioning amid broader uncertainty. SHY shifted to a negative Z-score in both months, likely the result of a market correction following earlier months of overextended inflows and elevated trading above its mean. TIP remained in negative territory in May, but climbed back to a positive Z-score of 0.489 in June, potentially indicating a renewed investor interest in inflation-protected securities as inflation expectations subtly shift. IEF has consistently maintained positive Z-scores, similar to its performance in March and April, suggesting that investors are favoring medium-duration bonds as a hedge in a highly ambiguous macro environment where neither short nor long duration appears fully safe.
What Does This Mean for Future Market Expectations?
Since January, the U.S. bond market has undergone sharp regime shifts driven by macroeconomic uncertainty, inconsistent inflation signals, and unpredictable Fed policy outlooks. The data from the past six months paints a picture of a market oscillating between optimism and fear, with investors struggling to interpret a rapidly evolving macro landscape.
January & February: Risk-On Rally
Early 2025 saw a surge in demand for longer-duration bonds, with TLT gaining 29.63bps and IEF 14.63bps, fueled by optimism around rate cuts and a potential economic inflection point. The large positive Z-score for TLT reflected bullish sentiment, though investors remained split, some chasing capital appreciation, others hedging with medium-term bonds like IEF.
March & April: Market Correction & Defensive Positioning
As expectations for rate cuts faded, returns cooled. TLT reversed sharply (-5.51bps, -5.74bps), correcting its February rally. In contrast, TIP and SHY led in March, signaling a shift toward defensive positioning. IEF (5.14bps) and SHY (3.86bps) led in April, suggesting cautious optimism for monetary stability without exposure to long-duration volatility.
May & June: Deepening Investor Anxiety
By May and June, all bond ETFs posted significant losses. Powell’s hawkish tone and renewed trade tensions eroded confidence, leading to sharp declines, TLT fell -15.24bps in May, with IEF and TIP dropping further in June. Even SHY turned negative, a rare sign of broad-based uncertainty. The steep drop in TLT’s returns, despite average trading volumes, suggests fear-driven selling, highlighting investors’ fading confidence in a long-term bond recovery.
Key Takeaway: Fragile Confidence and Flattening Preferences
This six-month trajectory reflects a market searching for direction but increasingly leaning toward risk aversion. The recent underperformance across all bond ETFs, including short-duration SHY, raises a red flag: investors may be losing confidence in the U.S. bond market as a whole.
Z-score normalization of market share further confirms this trend. As of May and June, all ETFs moved closer to their means, suggesting stabilizing flows but not due to renewed confidence, instead, it may reflect a broader retreat into cash or alternative assets. The next coming months are critical for U.S economic health, with Jerome Powell fearful to make the same mistakes the Fed made in the 70s it is unlikely he will announce rate cuts anytime soon, regardless of political pressure. Bullish investors may view this as an opportunity to capitalize on broad bond market “discounts,” while bearish investors may see these emerging cracks as early signs of a much deeper unraveling.
Like this project
Posted Jun 12, 2025
Analyzed U.S. bond market trends and ETF performance for 2025 to offer advice on U.S economic stability and future performance predictions.
Likes
1
Views
72