Sales & Grievances Analytics UX
Vinit Bisht
Sales & Grievances Analytics UX
Case study
WhatsApp, as one of the leading global messaging platforms, has continuously evolved its features to meet the demands of its users. However, with the increasing influence of visually-driven platforms like Instagram and Snapchat, WhatsApp's "Status" feature—once a unique and straightforward tool for sharing updates—has been overshadowed by more interactive and visually appealing alternatives. This case study delves into the limitations of WhatsApp's current status feature and proposes design enhancements aimed at improving its user experience without compromising the app's core identity as a messaging-first platform. By addressing user pain points and offering tailored solutions, this study seeks to strike a balance between functional improvements and maintaining WhatsApp's simplicity and brand integrity.
The Task
I’ve been given the task of making a digital solution to manage business and customers for the owner who has 6 stores in different locations in Bangalore.
This includes screens regarding:
Analytics about the customers who visit/purchase/window shop.
Post-sale feedback and/or grievances of consumers within 30-days of sale.
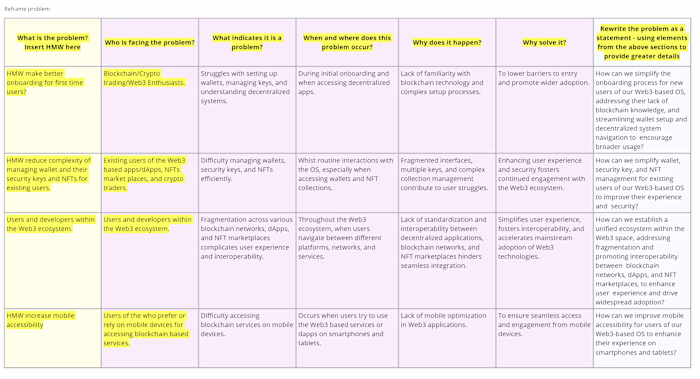
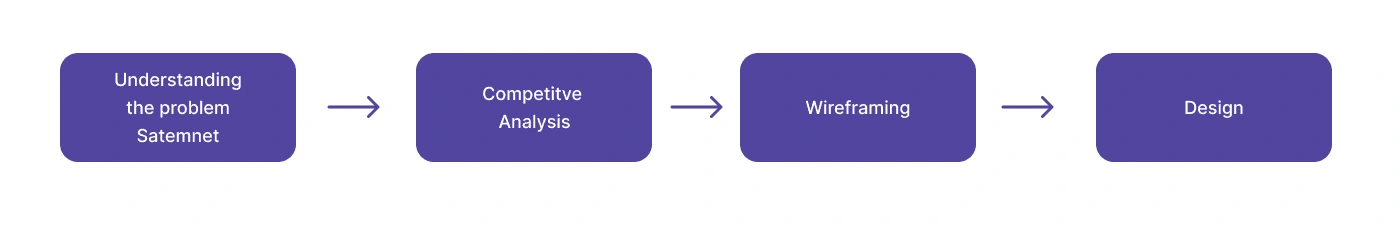
Design Process
I started out by understanding the problem, what is the task all about and how can I design the solution in the given maximum screens. After figuring out the problem, I moved to competitive analysis in which I researched different sports-related stores and look out for web application that provides businesses with analytical reports and metrics about their workings. Once decided what to put where and how to show it the process of wire-framing and designing became easy.
Screens (wire-frame)
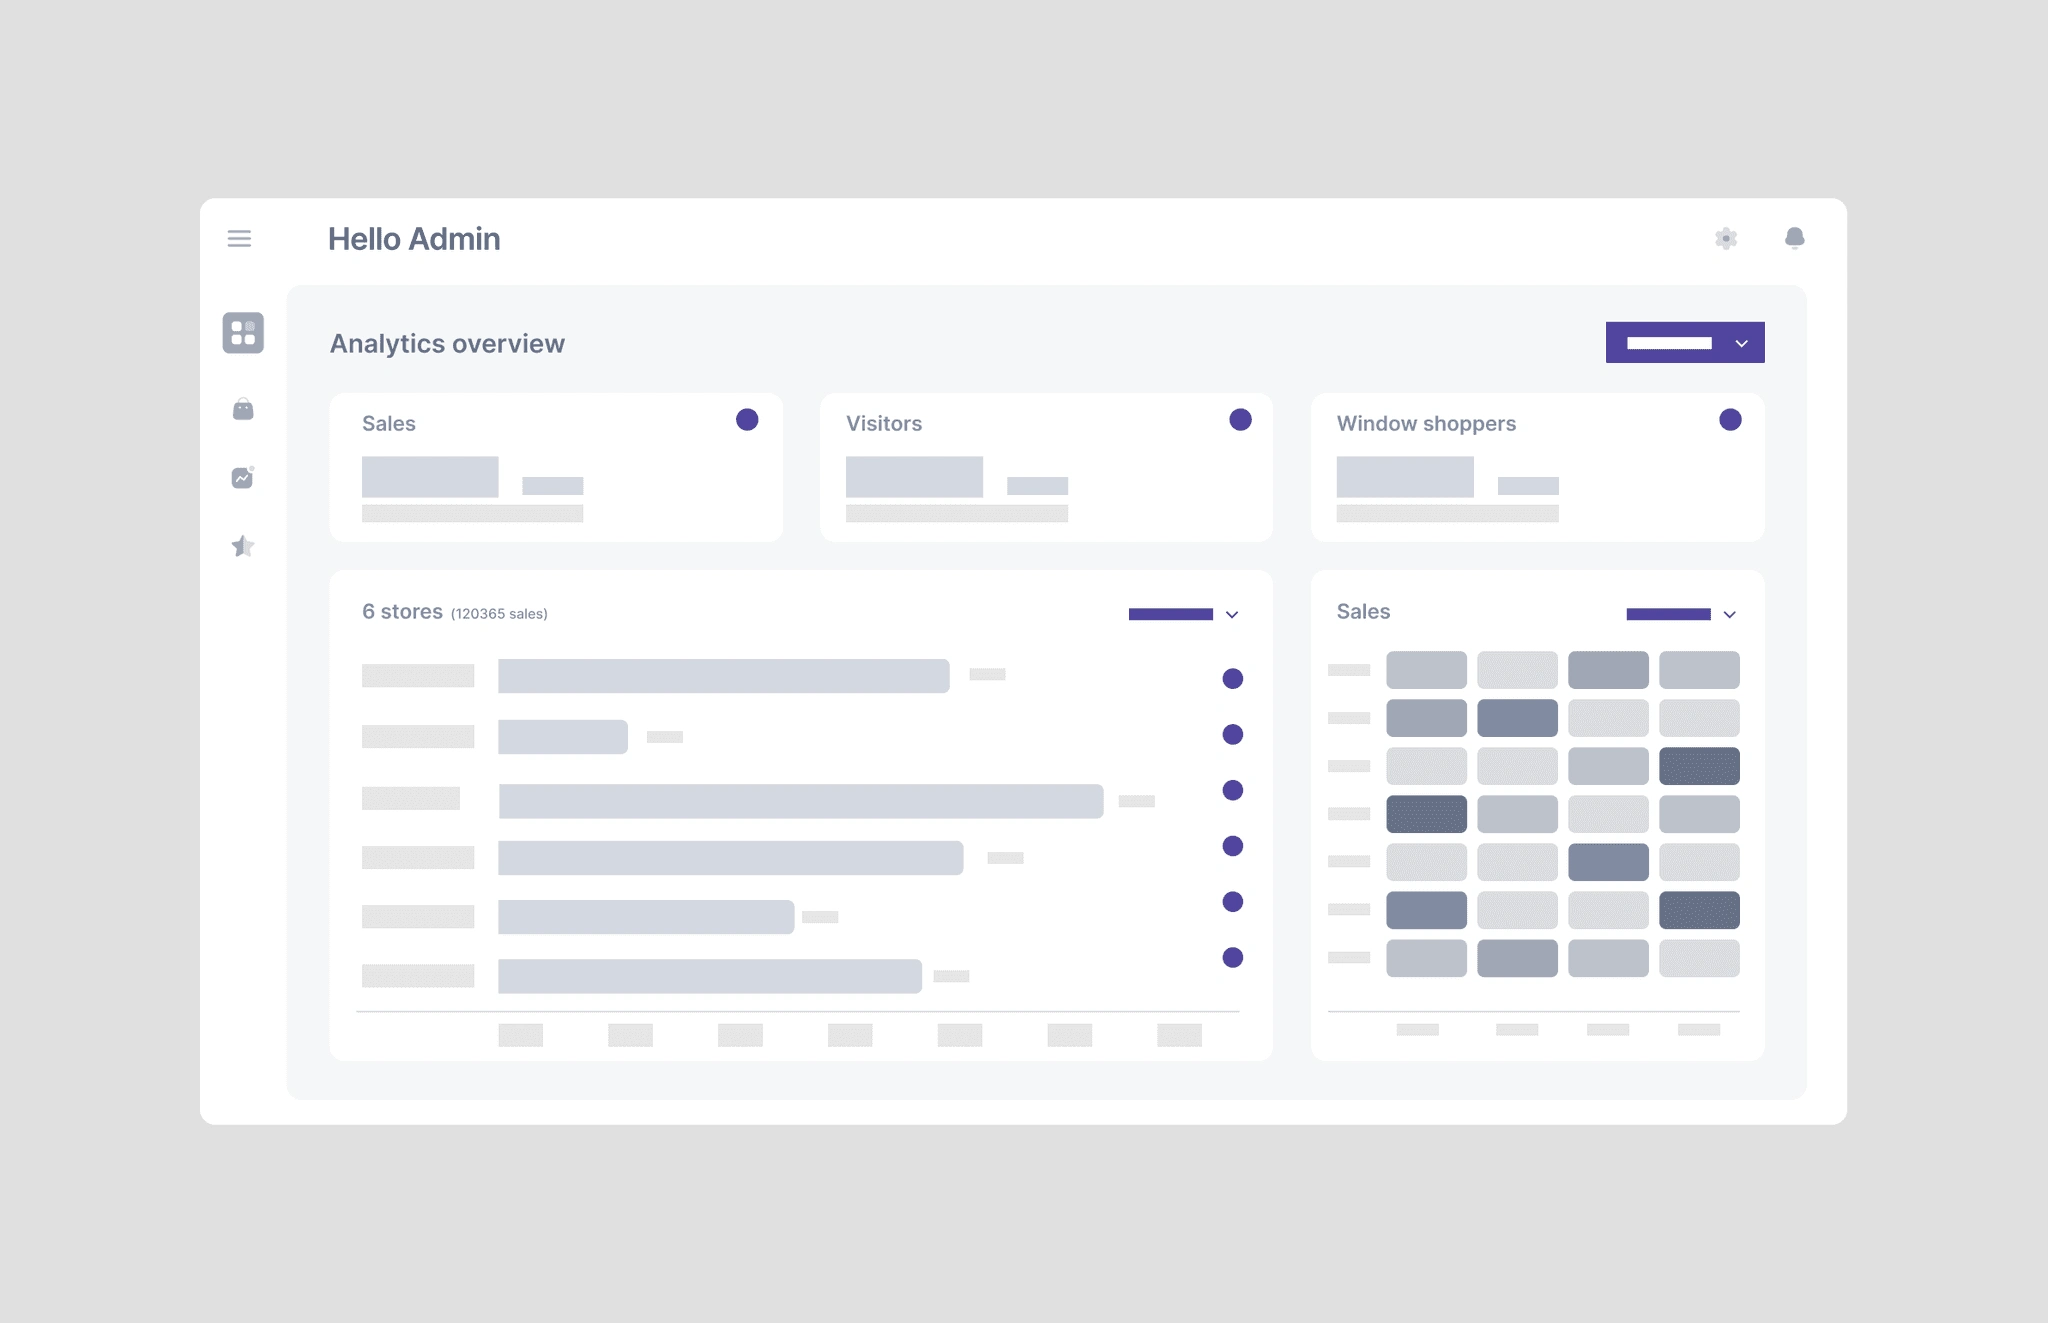
Dashboard (Analytics overview)
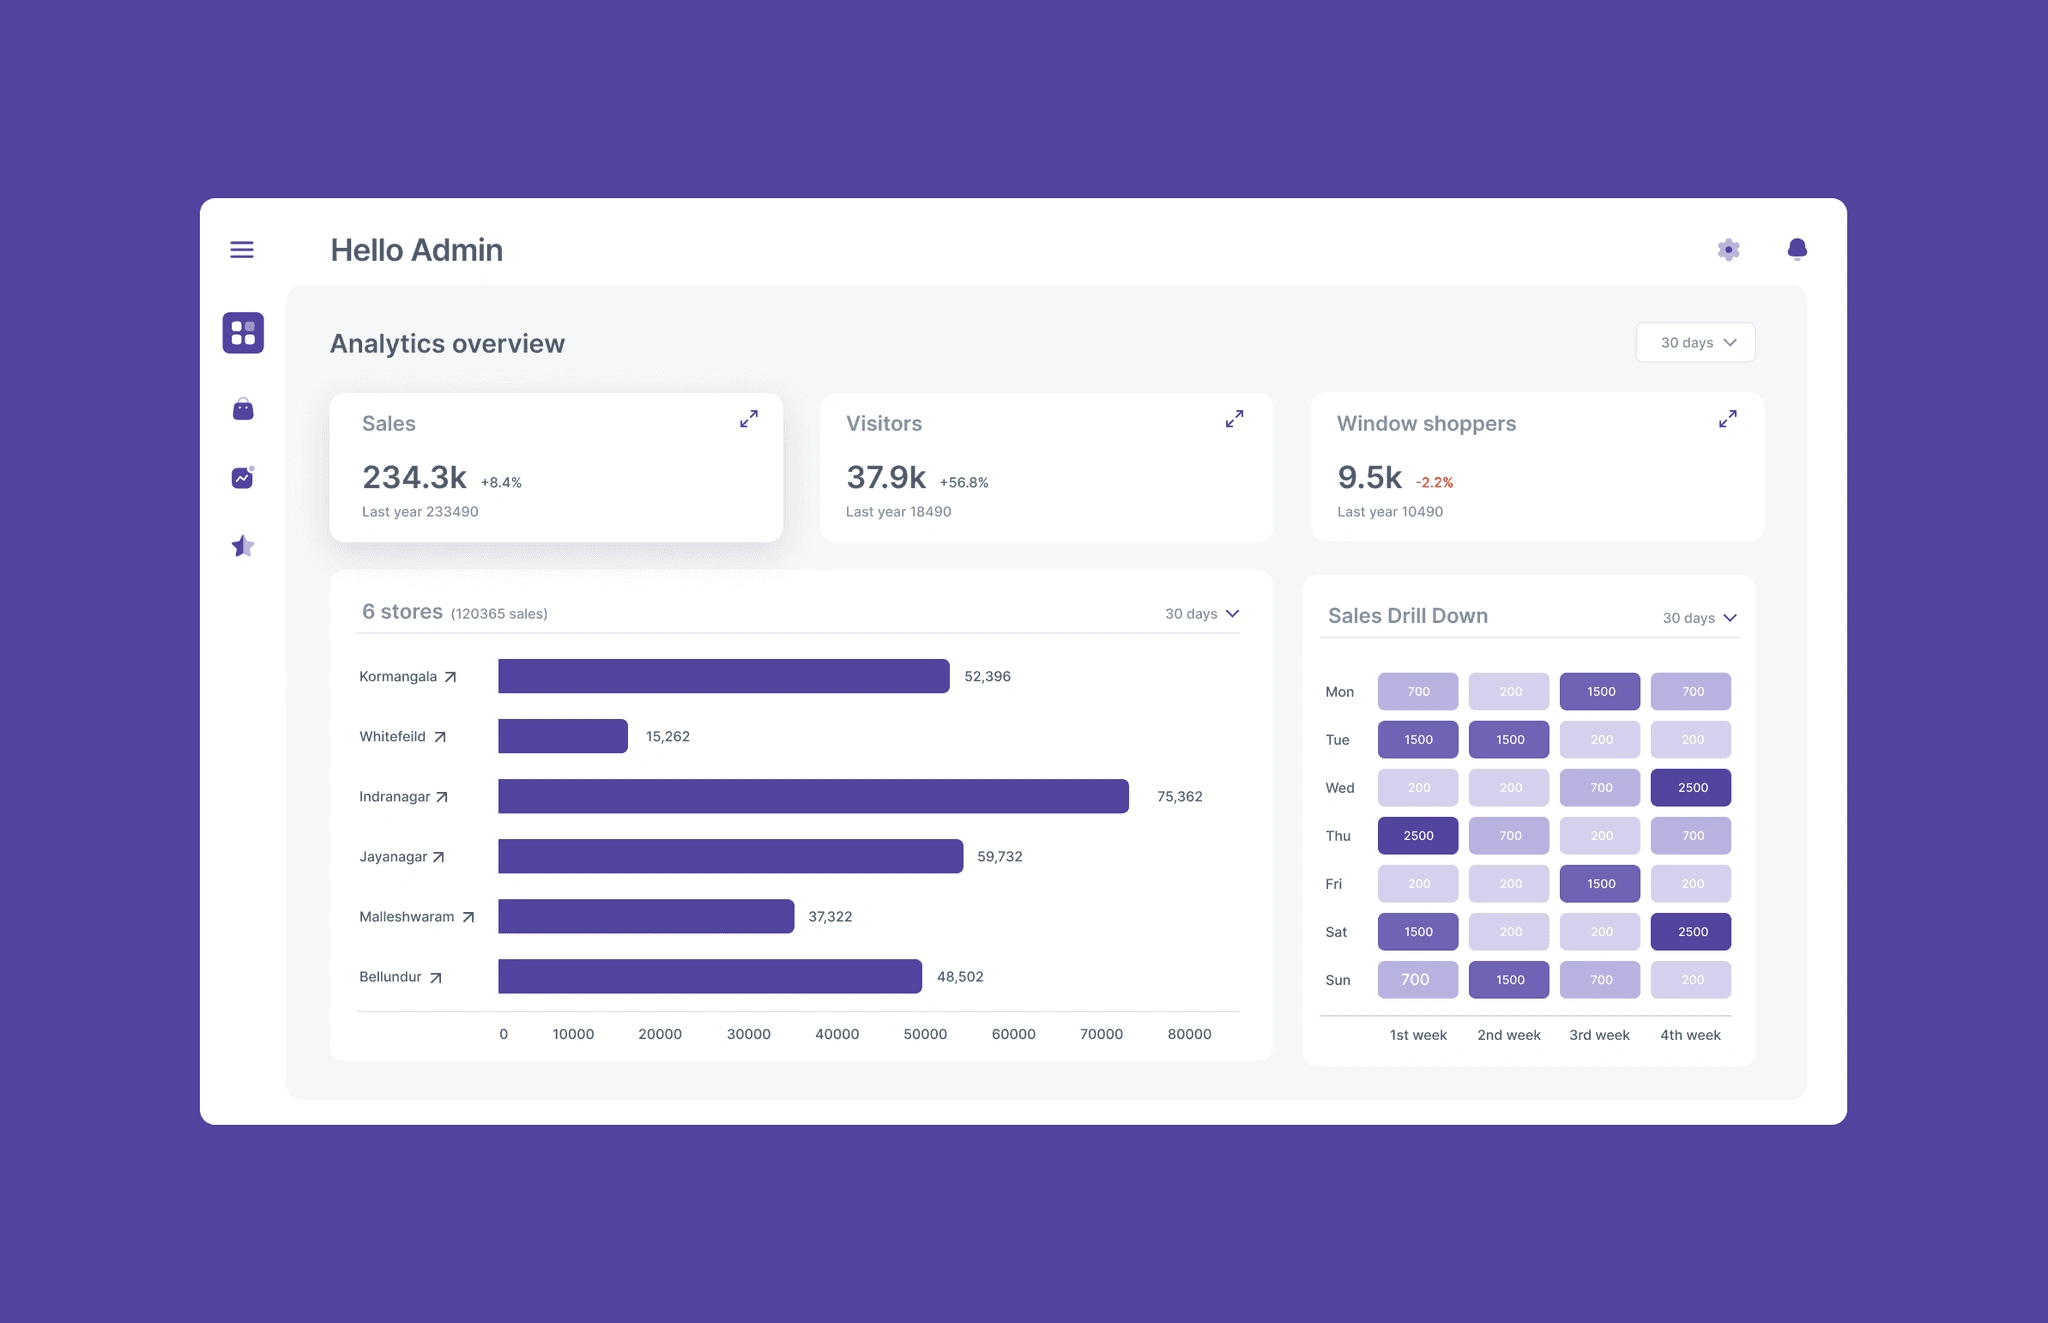
This is the dashboard that covers statistics regarding sales, visitors, and window shoppers of all the 6 stores. The grid consists of 5 tabs that will depict the metrics of the selected time-frame.
Sales: Purchases made by the stores, comparing last year’s same day's purchases and showing a profit or loss percentage.
Visitors: Total number of visitors for the past 30 days. The visitors could be counted by scanning people at the entrance of the store, the best example of it could be a thermal scanner which we often see at the entrance of malls nowadays.
**Window Shoppers:**We can pull out the data of window shoppers by deducting the purchases from the visitors. The one who did not buy anything will count as a window shopper.
6 Stores: Comparing all the stores with their sales, from this tab admin can directly go to a specific store page, where he/she/they can see specific details about the selected store.
Sales drill down: This tab will show a heat map about the monthly drill down on day level sales, it could be on, month or year level too. This has been made to segregate the sales data into particular time periods so that stores can take actions regarding that to increase the sales.
From the layout perspective
sales, visitors and window shoppers tab comes at first and cover 30%, as it highlight’s the figures and shows specific details regarding the same. Rest of 60% layout has been covered by charts and heat map as it has more visual information to display.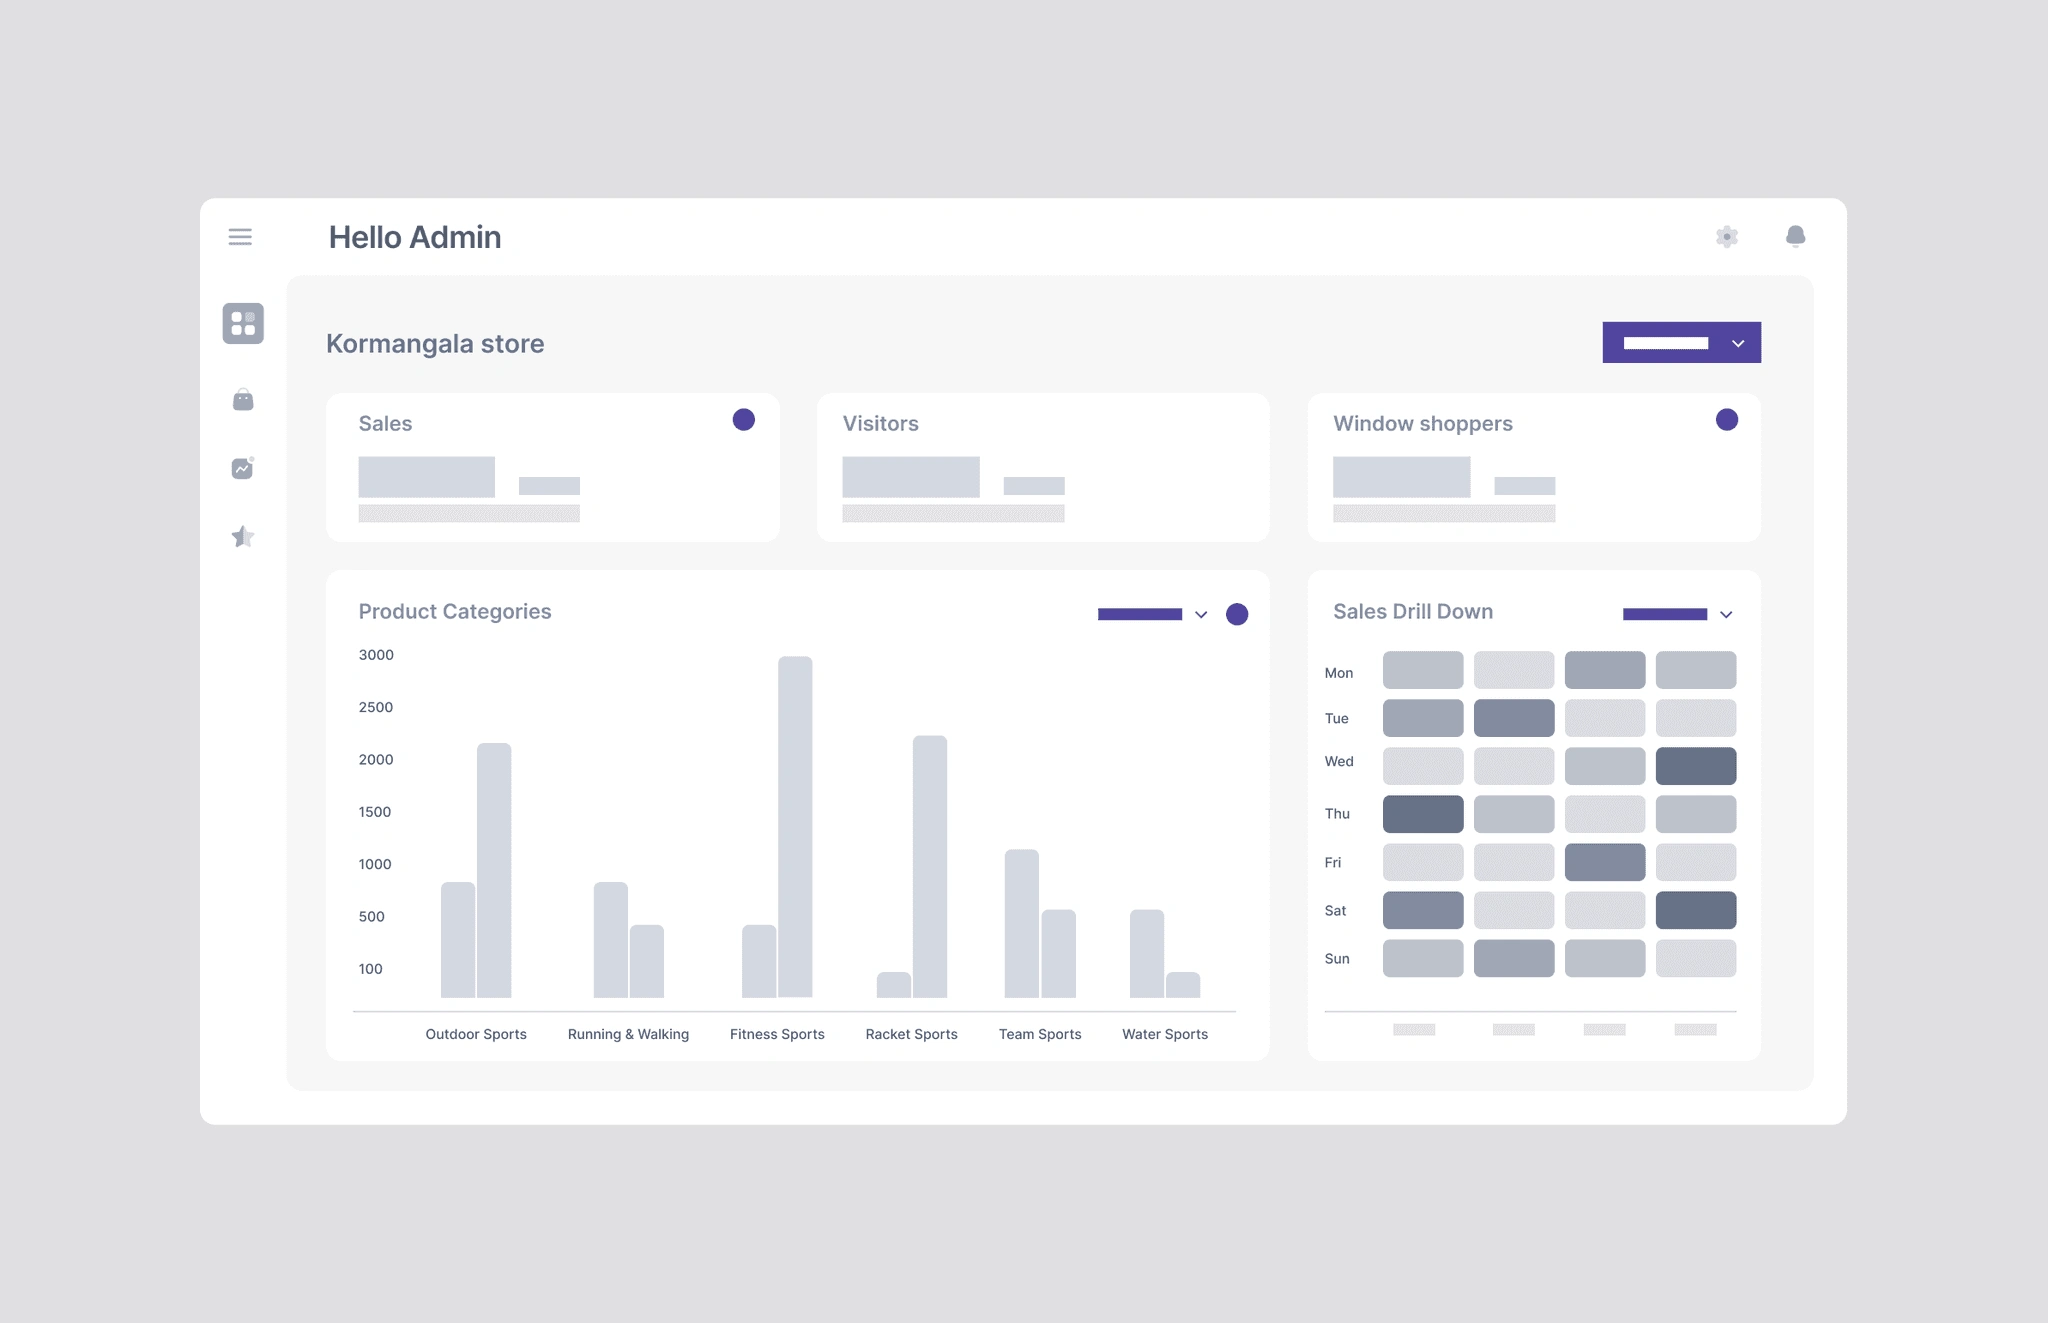
The screen in this dashboard covers all the statistics related to specific store like kormangala. The metrics it will show is sales , visitors, window shoppers, product categories and sales drill down.
Product Categories : This tab will categorize all the sport’s sales, and will compare it in the bar chart with last year sales on the same time-frame. The Admin can use filter icon button to select different sports categories and compare it side by side. Admin can also change the time-frame.
Dashboard (Analytics overview)
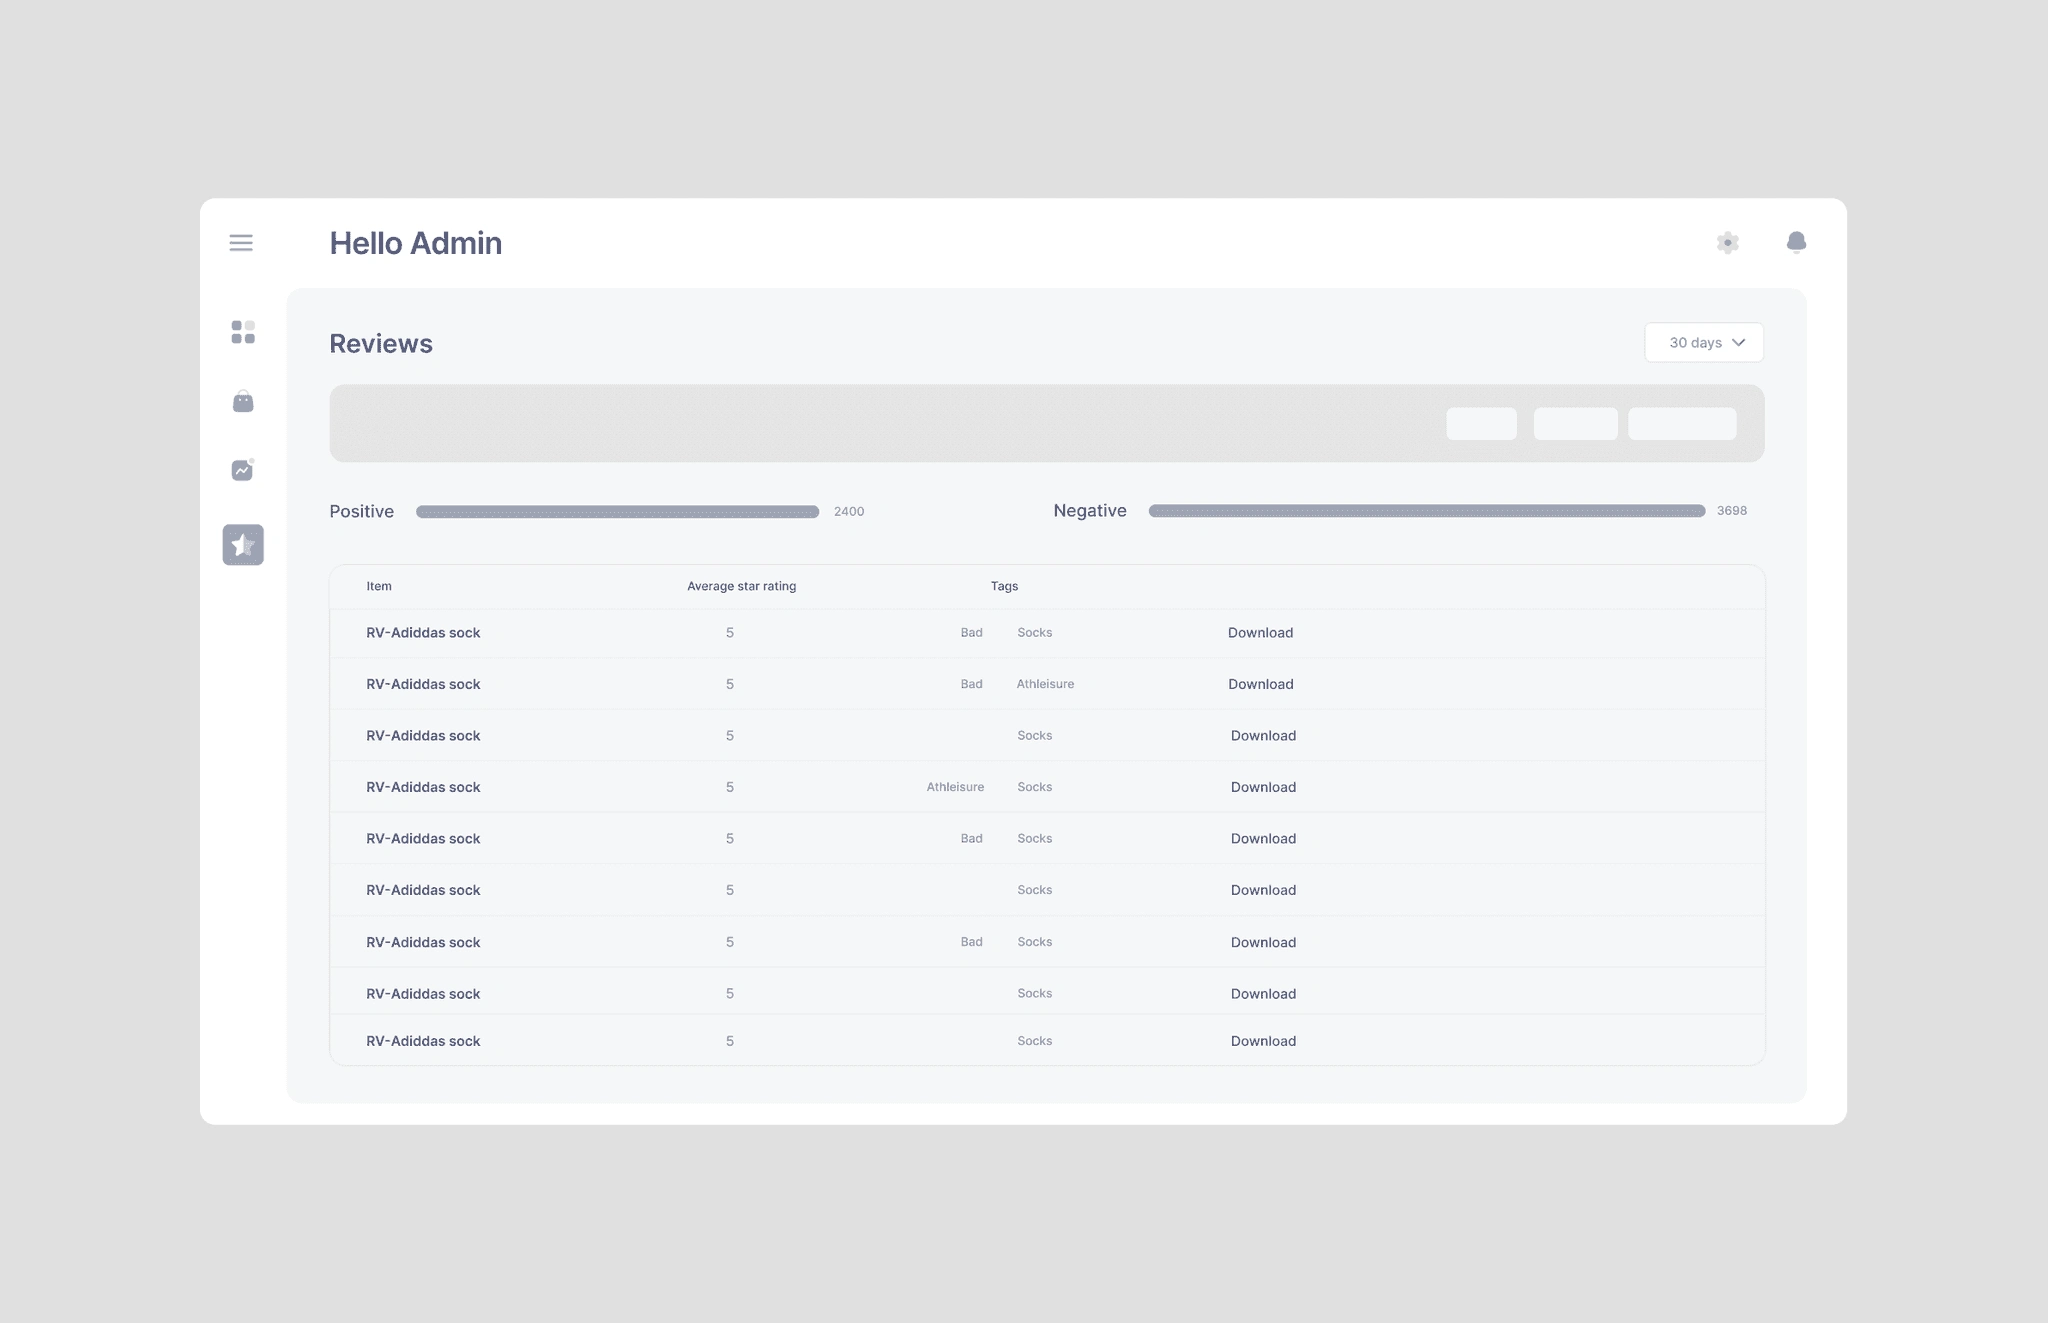
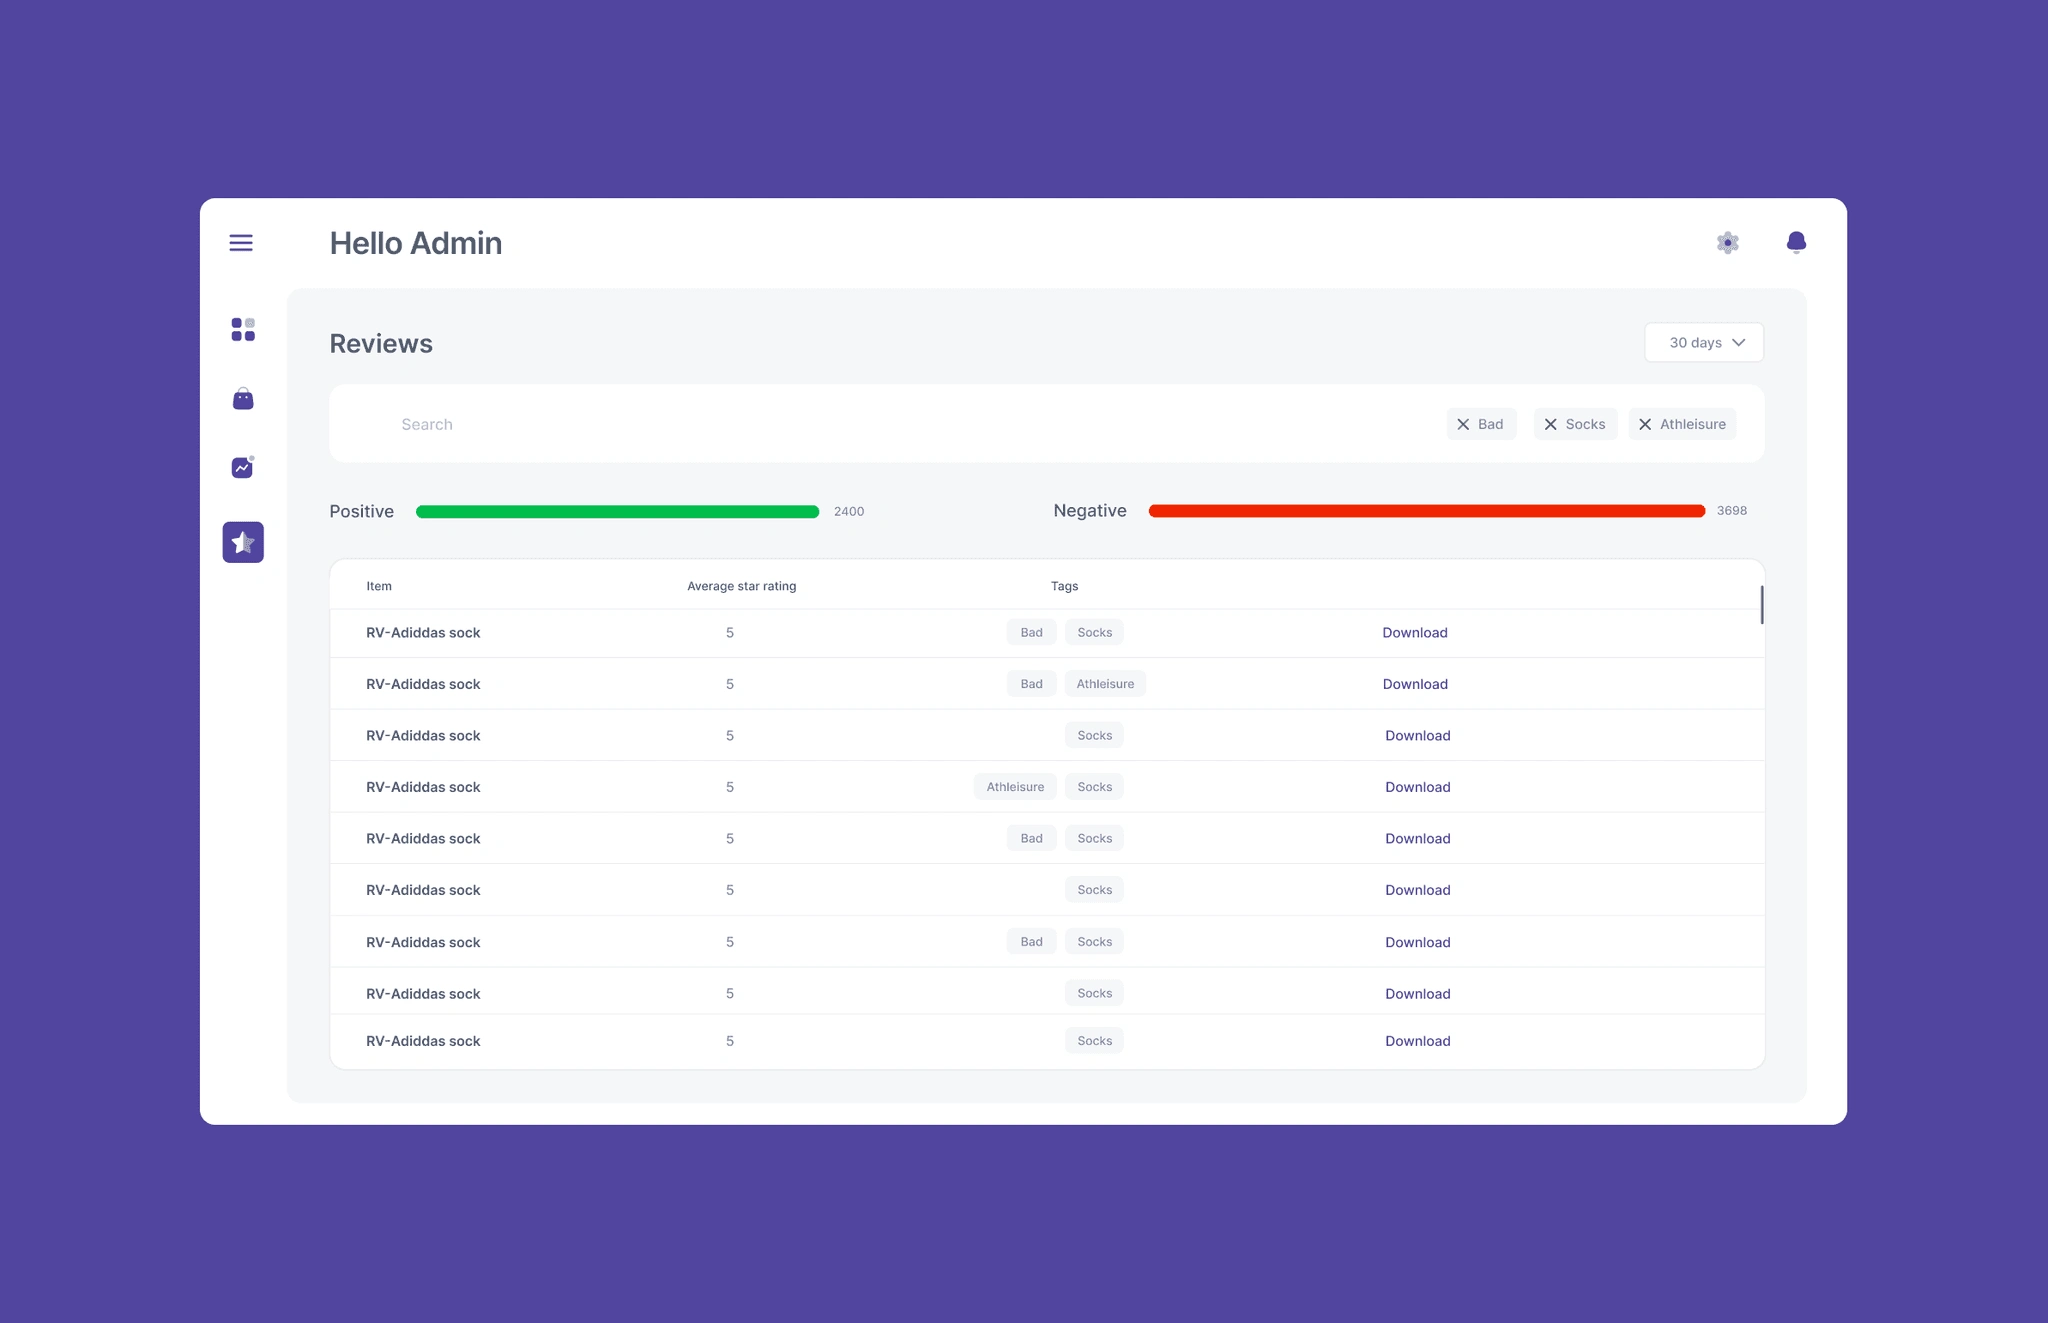
This screen will show all the reviews from the customer at any time-frame. As it was not specified in the task from where to fetch the data, As per thought, I take it as online platform where the buyers will write the review and rate the product in stars.
There is a search bar at the top, which will make chips of the searched items and convert it into tags , according to which the data will be called in the form of the list.
I’ve added two categories of review which is Negative and Positive which will sum up and show all the reviews into two separate form.
The list haveitem’s name column, clicking on which review detailed page will appear. It has Average star rating which will show what star rate the product got, and at last it has tagsand downloadaction button.
item’s name column, clicking on which review detailed page will appear. It has Average star rating which will show what star rate the product got, and at last it has tagsand downloadaction button.Product Review (Detailed)
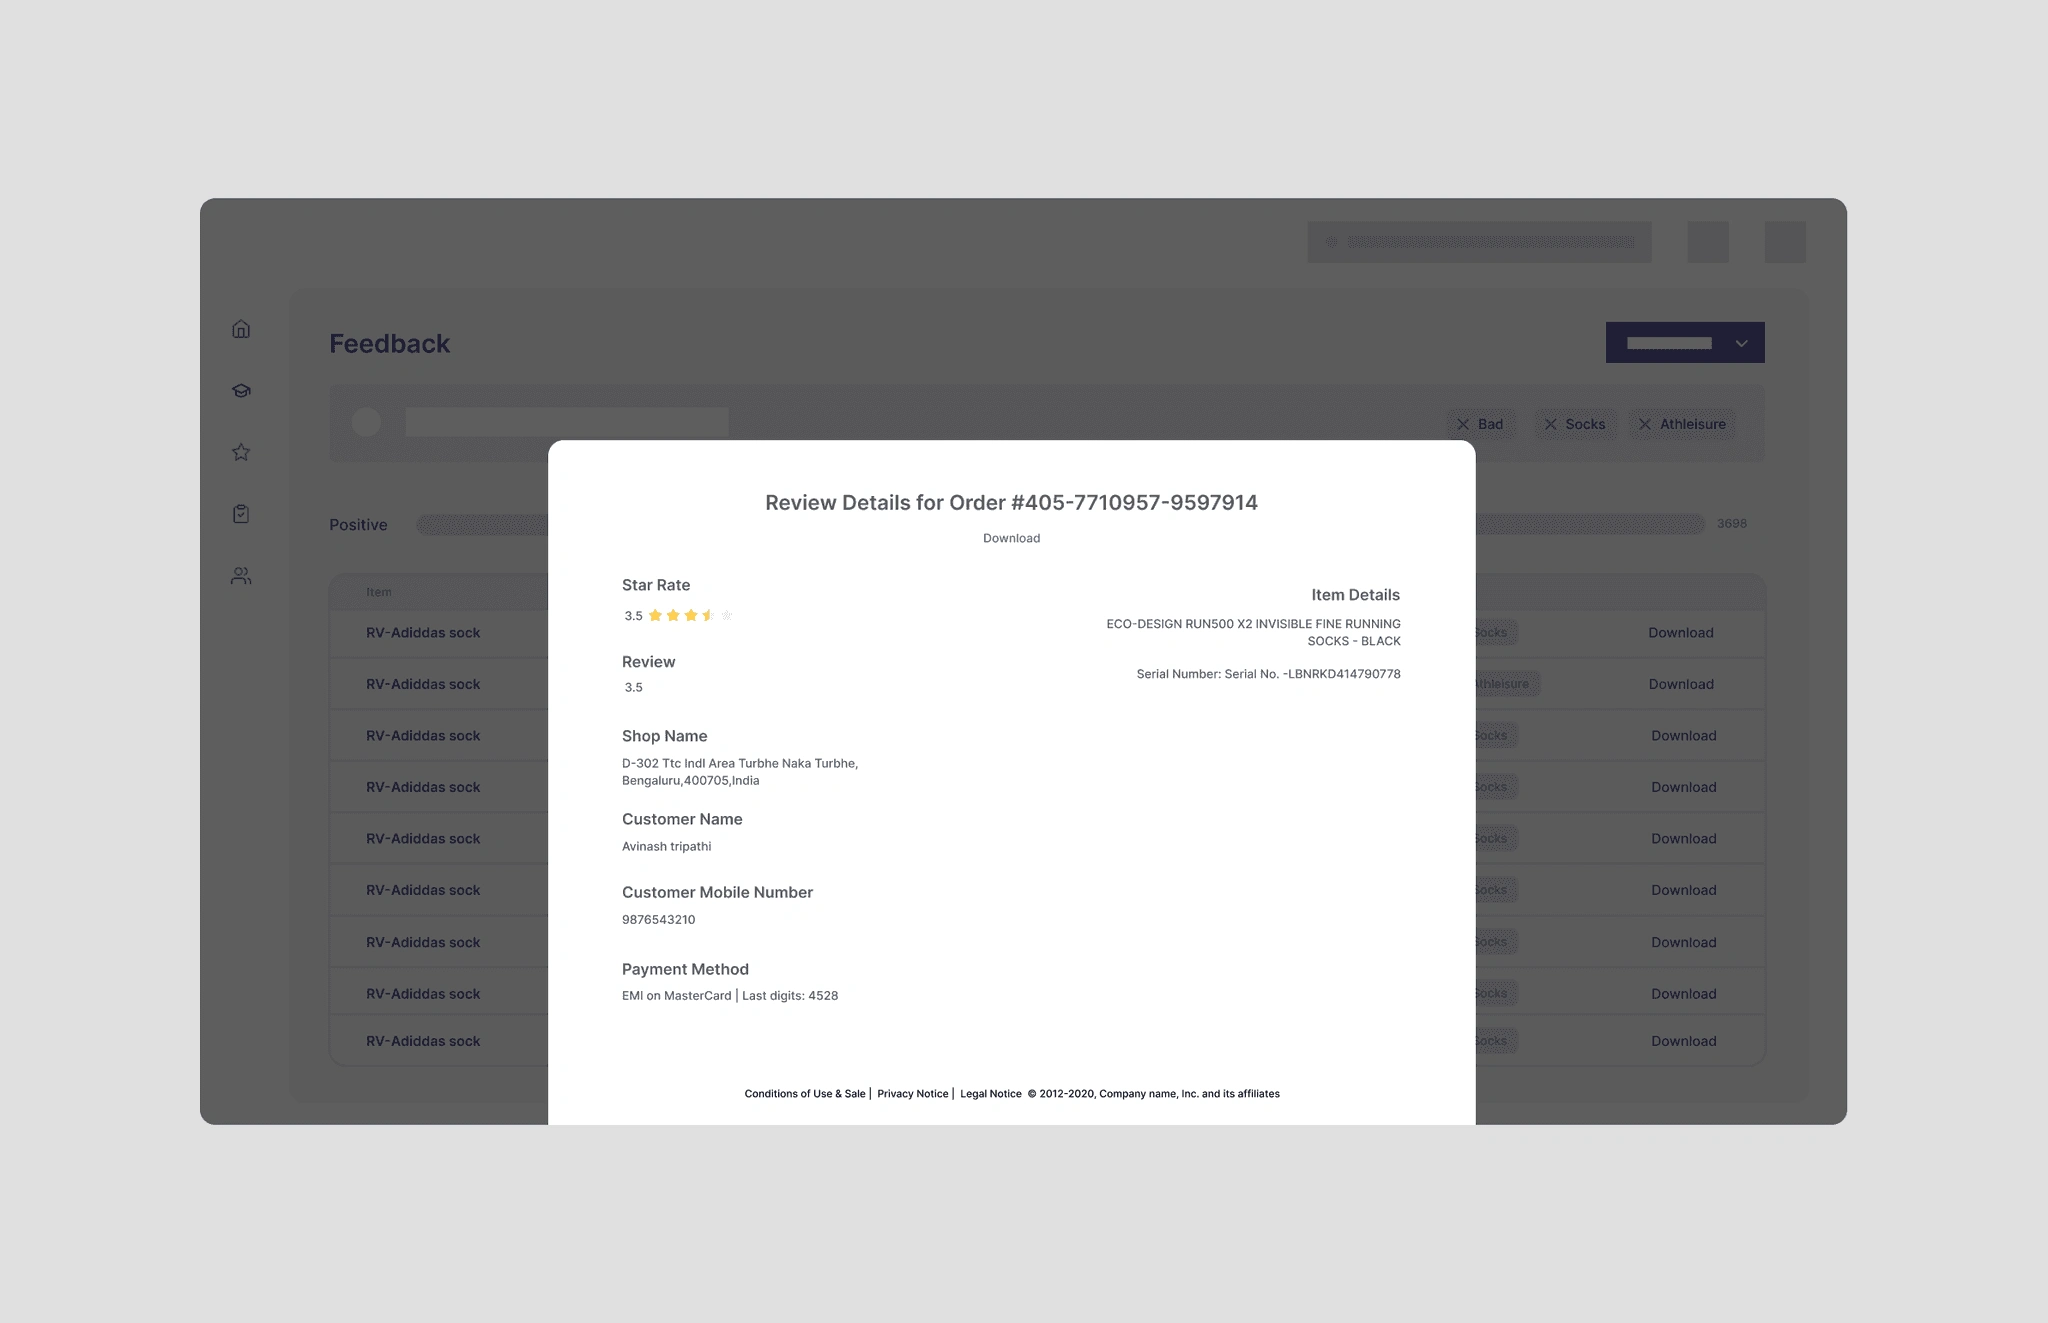
This page is being made to show admin what, which and for what reason the consumer has written the review about. The page will show from where the consumer has bought the product, shop details, Product’s item number and some details about the consumer too.
Screens (Visual Design)
Dashboard (Analytics overview)
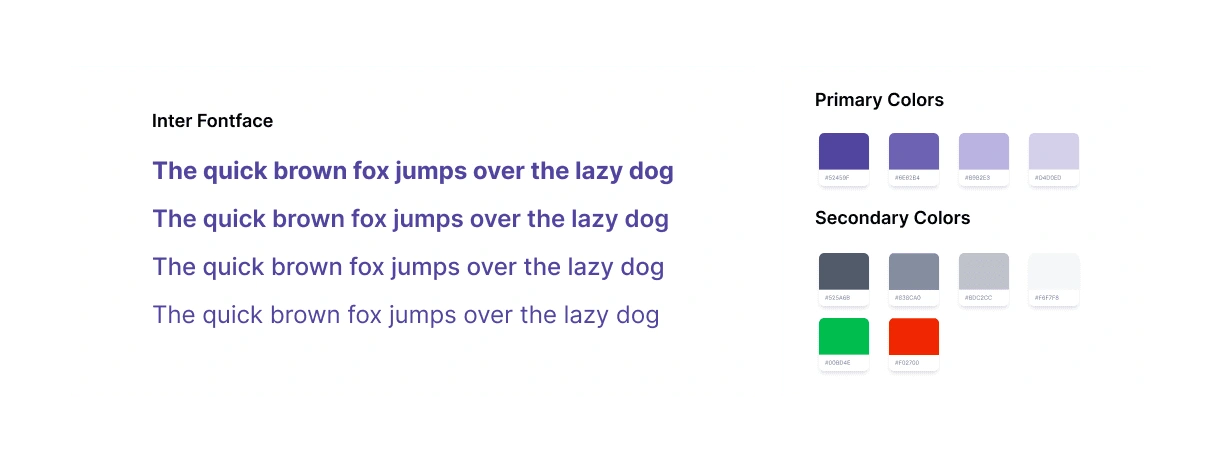
In designing the visuals I used Inter fonts as it is better to have decent-looking fonts for data and analytics-related screens and pages. For color, I opted primary color, a slightly dark shade of blue as it carries more emphasis on the background shades like white. For the rest of the screen colors, different shades of white work the best.
Inter fonts as it is better to have decent-looking fonts for data and analytics-related screens and pages. For color, I opted primary color, a slightly dark shade of blue as it carries more emphasis on the background shades like white. For the rest of the screen colors, different shades of white work the best.
Like this project
Posted May 3, 2026
Case study on improving WhatsApp's Status feature through UX design.
Likes
0
Views
5