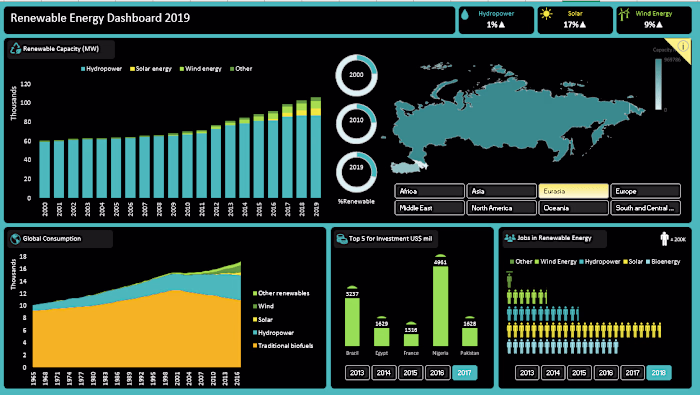
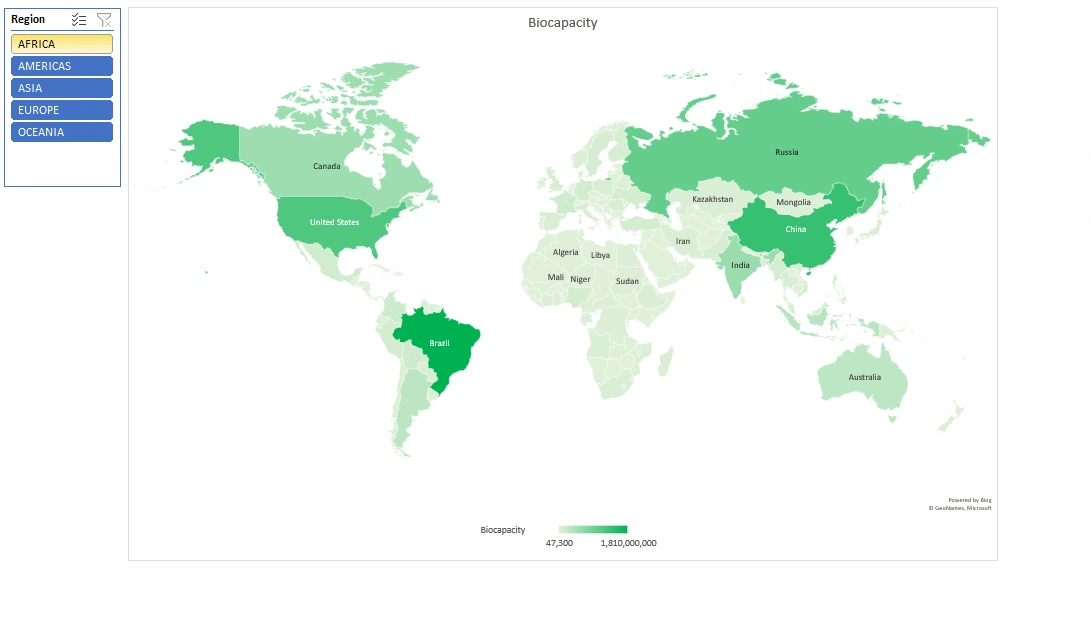
Interactive chart for Biocapacity and Eco-Footprint by country.
Waqas Ali
Interactive chart for Biocapacity and Eco-Footprint of different countries in the world.
Like this project
Posted Mar 31, 2023
Creating an interactive world map for Biocapacity and Eco-Footprint in Excel involves using the slicers and insert map from charts.
Likes
0
Views
6