Profitability and Sales Performance Insights

Ashwini Prajapati


Key Responsibilities
1. Data Cleaning & Processing: Used Power BI and Excel to clean and prepare data.
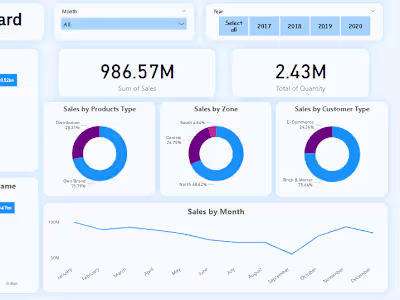
2. Data Visualization: Created interactive dashboards in Power BI for analysis.
3. Insights Generation: Identified profitable segments (Government, Small Business) and regions (Mexico, Germany, France). Analyzed discount impact and product performance.
4. Recommendations: Suggested resource allocation, discount optimization, and promotional strategies.
Key Findings
1. Profitability: Government and Small Business segments are most profitable. Mexico, Germany, and France are top-performing regions.
2. Discounts: High discounts lead to losses, low to medium discounts maintain profitability.
3. Products: VTT and Amarilla perform well, Velo underperforms despite high discounts.
4. Seasonal Trends: Peak profitability in September, November, December, and February.
Recommendations
1. Focus on Government and Small Business segments in top-performing regions.
2. Avoid high discounts; use low to medium discounts strategically.
3. Increase focus on VTT and Amarilla; reassess strategy for Velo.
4. Align promotions with peak profitability months
Like this project
Posted Feb 18, 2025
Delivered actionable insights and interactive dashboards to optimize profitability and sales performance