CRO Adding $300,000+ in ARR for an Apparel Brand
Like this project
Posted Sep 10, 2024
Ongoing CRO program adding $300,000+ to an apparel brand with one test. Implementing psychological factors and understanding customers helped unlock this winner
Likes
0
Views
23
Clients

Ripley Rader
Featured on
CRO is all about digging deep into your customers & data to drive real, tangible growth for our clients. Today, we’re breaking down a powerful case study where we used heatmap technology to generate over $300K in new customer revenue for a women’s apparel brand.
This isn’t just about testing for the sake of testing. It’s about understanding how customers interact with a brand, who they are, and identifying friction points to find smart, data-backed solutions that drive conversions. Let’s dive into exactly how we made it happen.

The Challenge - Customers Couldn’t Easily Shop Product Variants
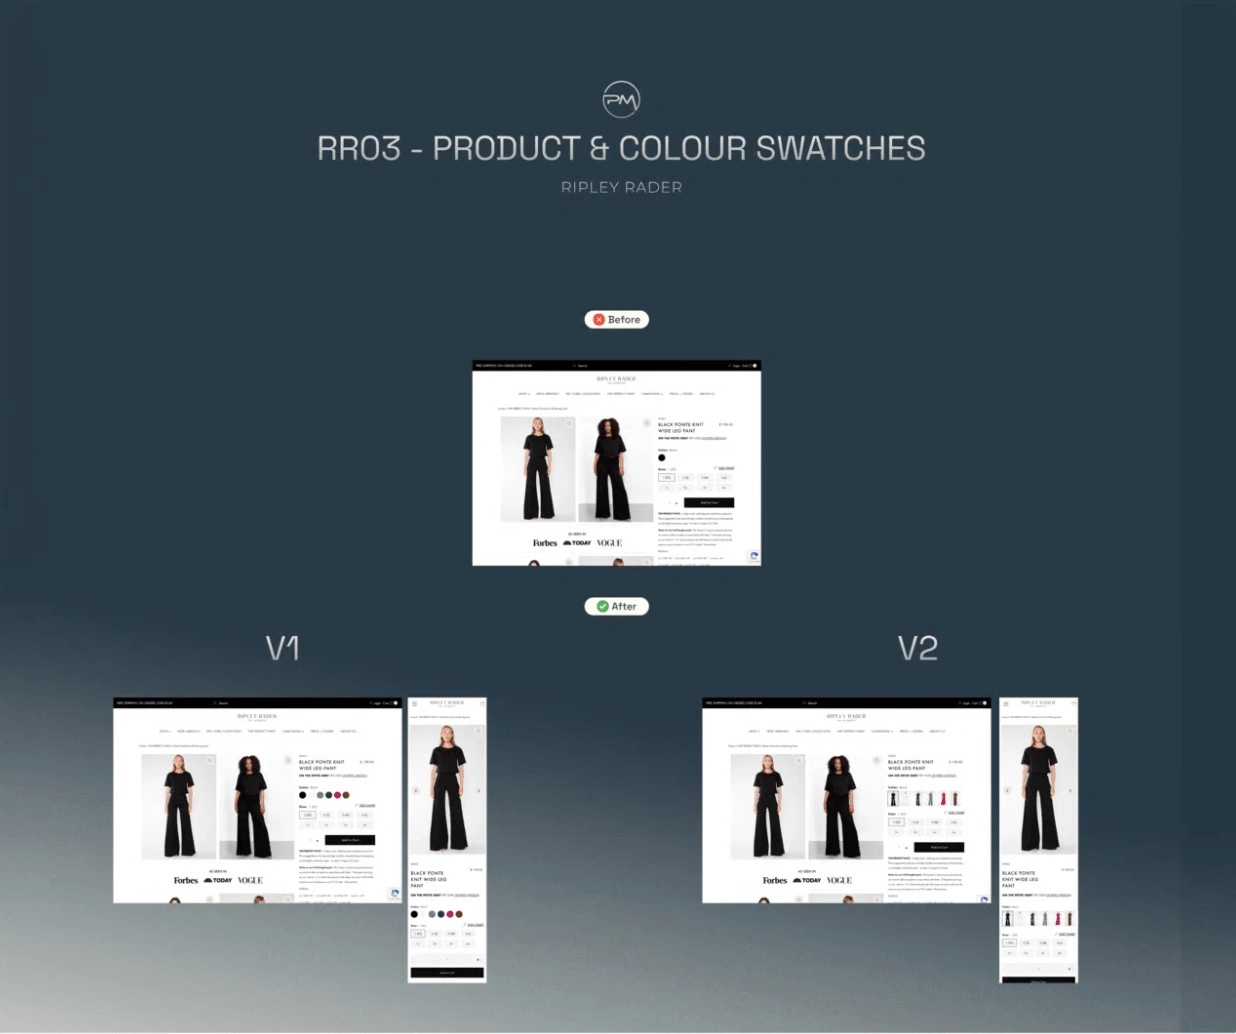
This clothing brand specializes in high-quality apparel, with their best seller being available in multiple color variants. However, customers were only able to easily find the black variation, which limited their ability to explore other colors and styles. This was a missed opportunity for both customer satisfaction and higher revenue.
We used heatmaps and session recordings from Heatmap.com to investigate how customers were interacting with the site. The data revealed that customers were often clicking heavily on navigational elements like breadcrumbs and buttons labeled “Cropped Version,” indicating they wanted to see more products or explore other options but were unable to find what they were looking for.
Our Solution: Adding Image Variants Directly to the Product Pages
Hypothesis:
We hypothesized that adding clear image variants on the product detail pages would allow customers to quickly find and choose the color or version of the product they wanted, leading to an increase in user satisfaction and conversion rates.
Psychology Behind It:
The decision-making process becomes much smoother when options are immediately available and visible allowing them to compare the colours. By reducing cognitive load (the mental effort required to make a decision), we believed customers would be more likely to add multiple items to their cart. This approach also catered to their natural shopping preferences—more images, less guesswork.
The Testing Process: What We Did and How We Did It
We tested this change on three key products within the clients catalog, focusing on the product pages that showed the most interaction through heatmap data. The goal was simple: make the variants easily accessible so customers could explore the product’s full offering without needing to navigate away from the page or search for other options.
Here’s how we broke it down:
Observation through Heatmaps & Session Recordings:
Heatmaps and recordings helped us understand where users were experiencing friction. Many of them were clicking on breadcrumbs or navigational elements, trying to explore more product options. By focusing on user behavior, we saw the exact pain points and confusion.
Redesigning the Product Pages:
We took the insights from our heatmap data and redesigned the product pages to show color and style variants directly as image thumbnails. This allowed customers to see each variant upfront without needing to leave the product page.

Testing and Implementation:
Once the new designs were live, we ran the test for 41 days, gathering data on how customers interacted with the updated product pages. The results spoke for themselves.
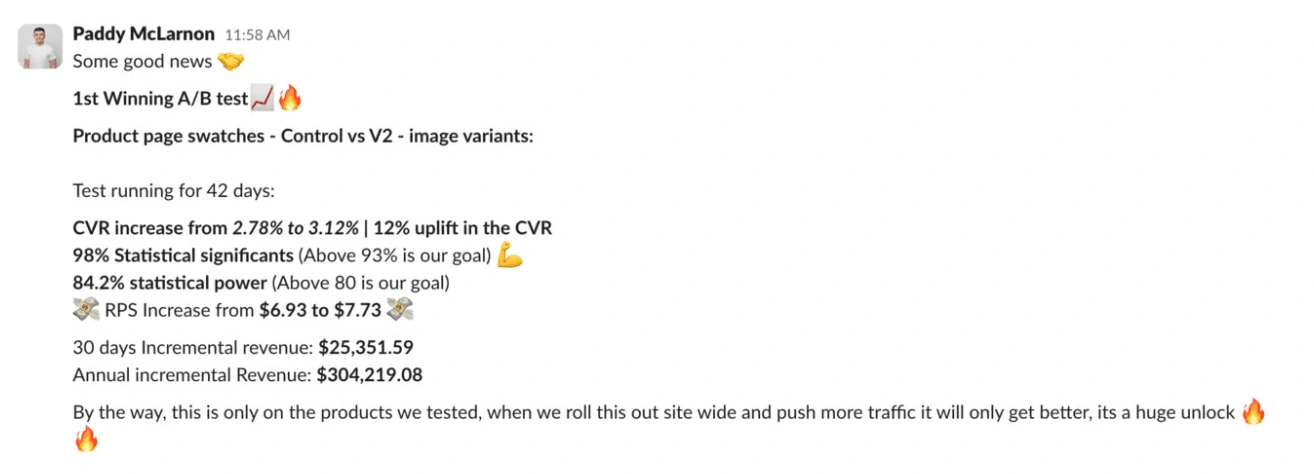
The Results: A $300K+ Revenue Boost in 42 Days
The impact of this small, data-backed change was massive. By adding image variants directly to the product pages, Ripley Rader saw a:
11.4% increase in Revenue Per Visitor (RPV), from $6.96 to $7.75.
12% increase in conversion rates.
$34,067 in monthly incremental revenue, leading to a projected $300K+ annual revenue increase.
What’s even more impressive is that these results came from just three product types we tested. Once we implement this across all product pages for all variants, the potential revenue lift could be significantly higher.
What Did We Learn?
This case study reinforced the value of heatmap data in understanding customer behavior. It’s not about guessing what might work—it’s about observing, learning, and testing. Every test gives you a deeper insight into what drives conversions for your audience.
For Ripley Rader, we saw that older, visual shoppers want simplicity. They don’t want to hunt for options or navigate through endless pages. The easier you make it for them to see and choose, the more likely they are to convert.
Key Takeaways:
Understand your audience.
Ripley Rader’s audience is largely women over 45. They prefer to see product options in full detail, and removing friction from their shopping experience made a big difference.
Use heatmap data to identify friction points.
Heatmaps helped us see where customers were struggling and what they were clicking on. This informed our decision to revamp the product pages.
Simplify the shopping experience.
By adding image variants directly to the product page, we allowed customers to find exactly what they wanted, reducing frustration and increasing satisfaction.
How Can This Apply to Your Brand?
If you’re running an eCommerce brand—whether it’s fashion, supplements, or home goods—this case study shows the power of heatmap data in uncovering hidden opportunities. By understanding how your customers behave on your site, you can make data-driven decisions that boost revenue and increase customer satisfaction.
Not sure where to start? At PM Digital, we specialize in conversion rate optimization and customer experience improvements that drive real results. Whether you’re a 6-figure brand looking to scale or an 8-figure brand ready to optimize, we’re here to help.
Always remember: Learn, Hypothesize, Test, Repeat.
If you run a brand on Shopify or are interested in CRO - Book a call with me and we can chat about our different packages:)


