Mustad Measures Alpha

Anton Drachuk


Mustad Measures Alpha
Establishing proxy measures to validate customer experience performance.
Objective
Establish simple proxy measures to validate performance of customer experience and provide clarity on ways to analyse opportunities to make a difference.
Deliverables
The future of Data Driven Mustad
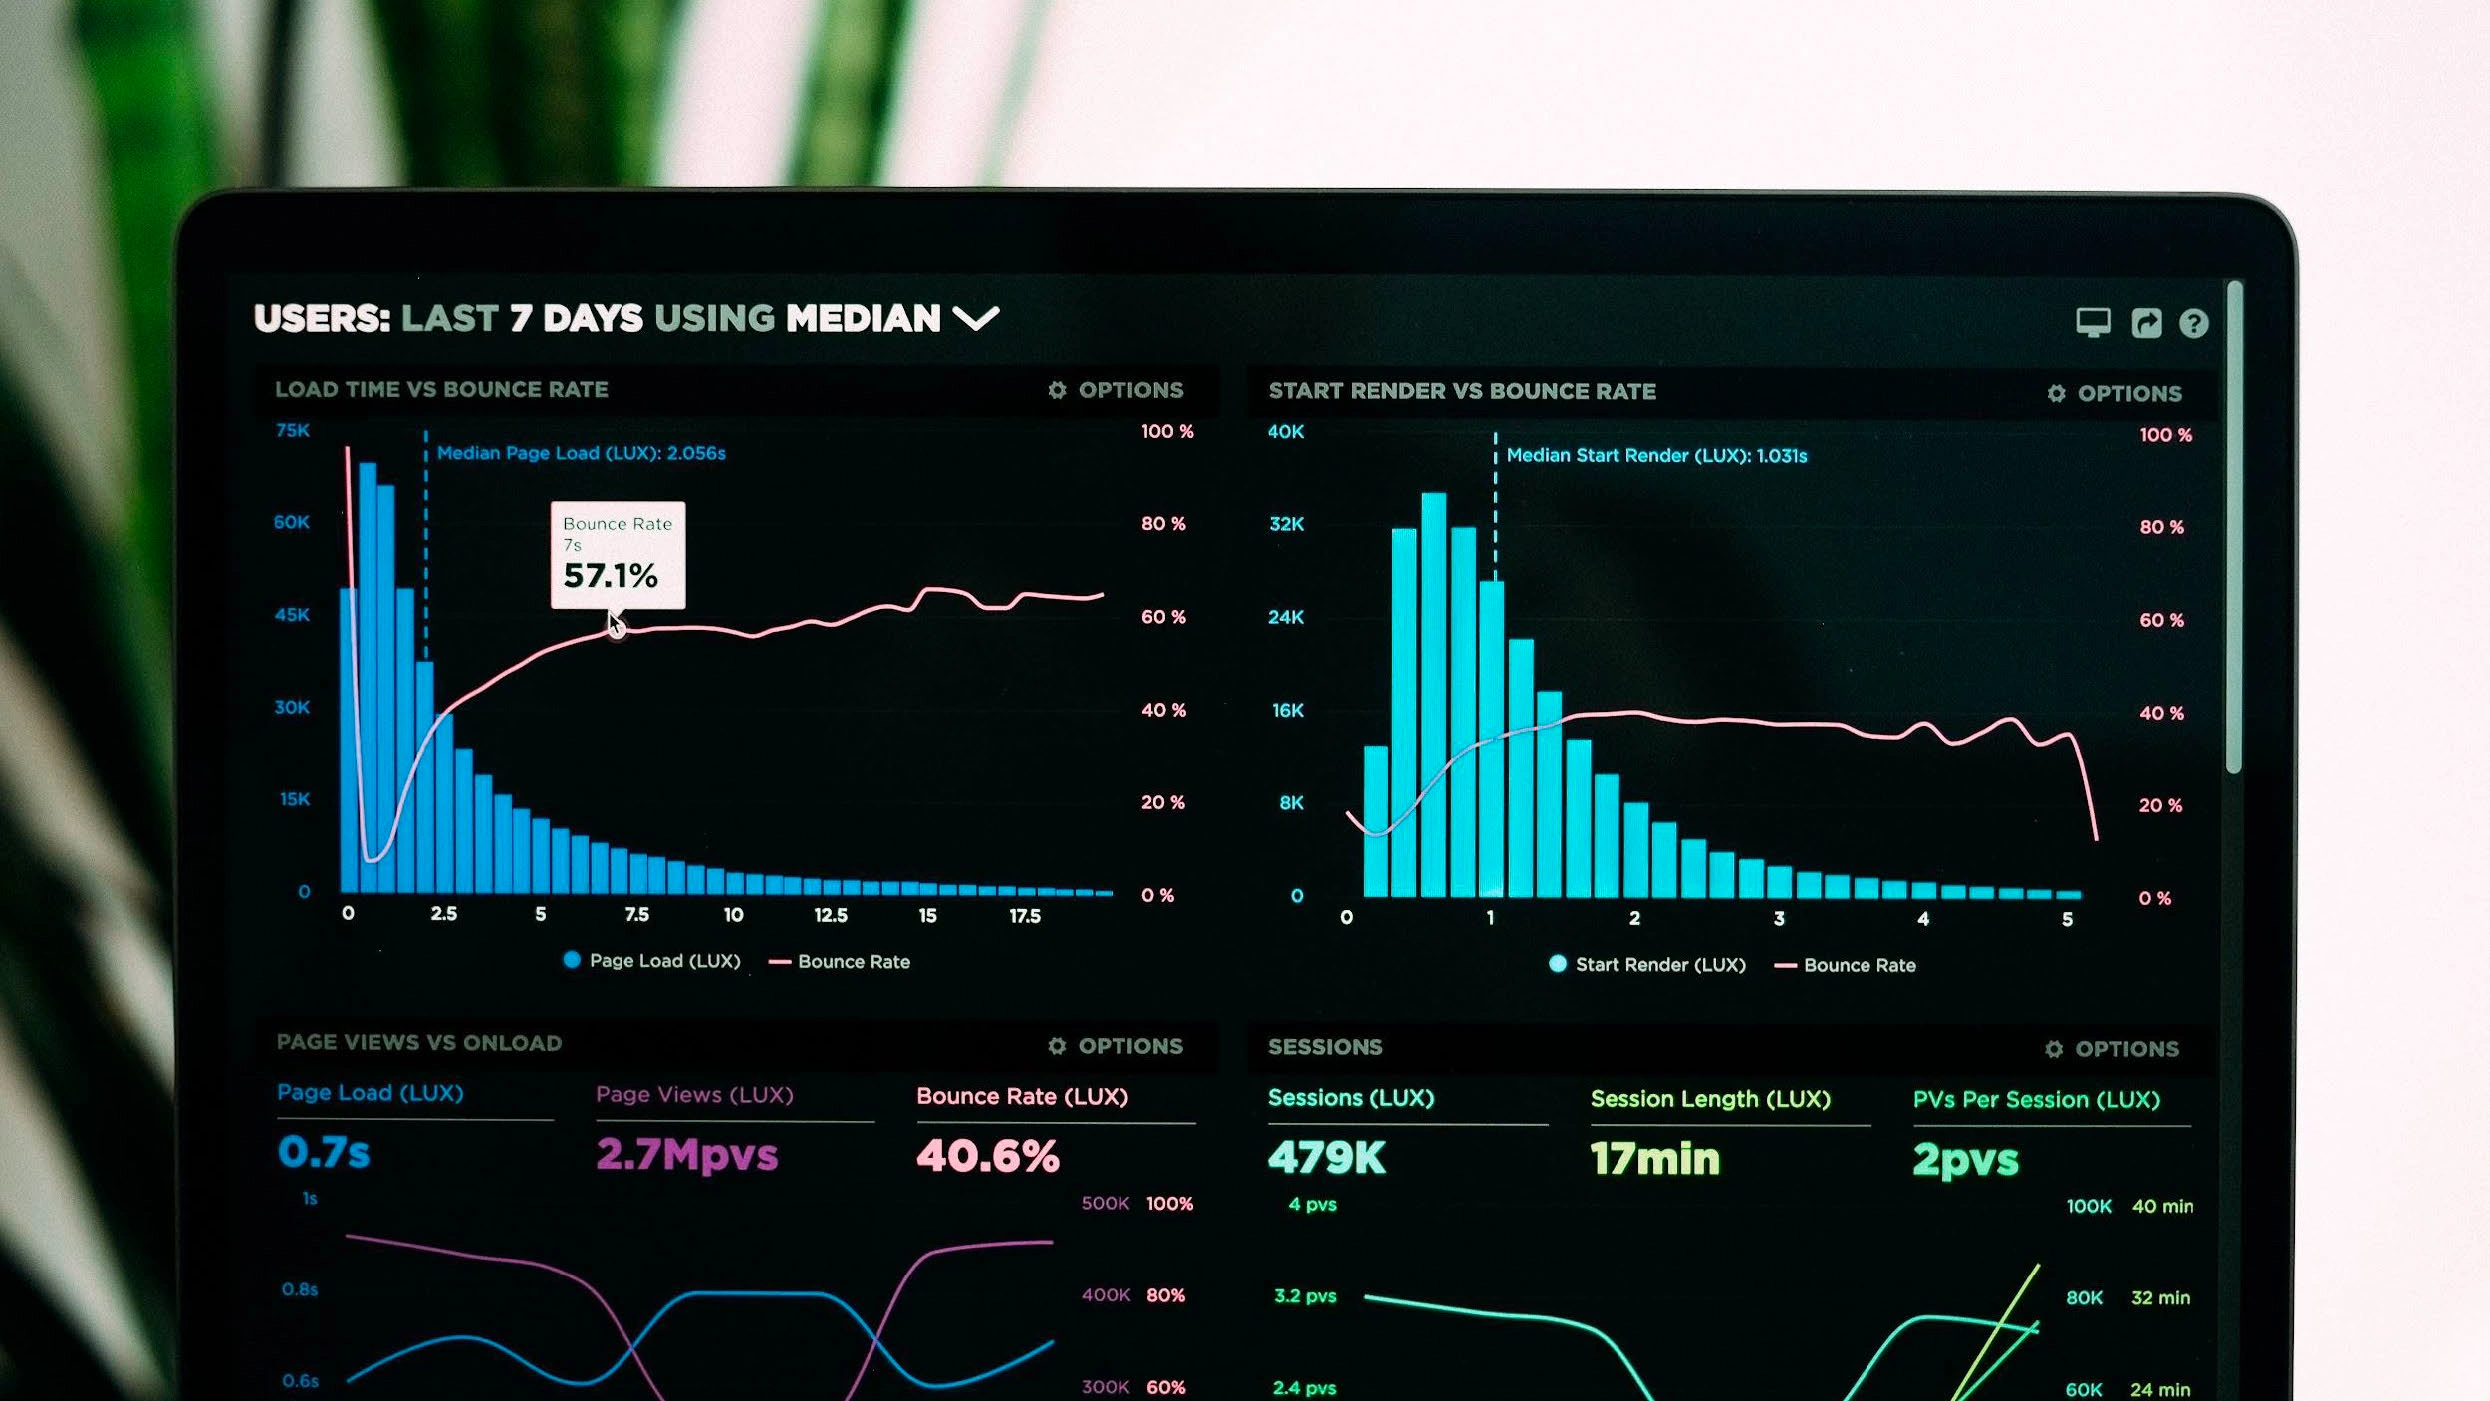
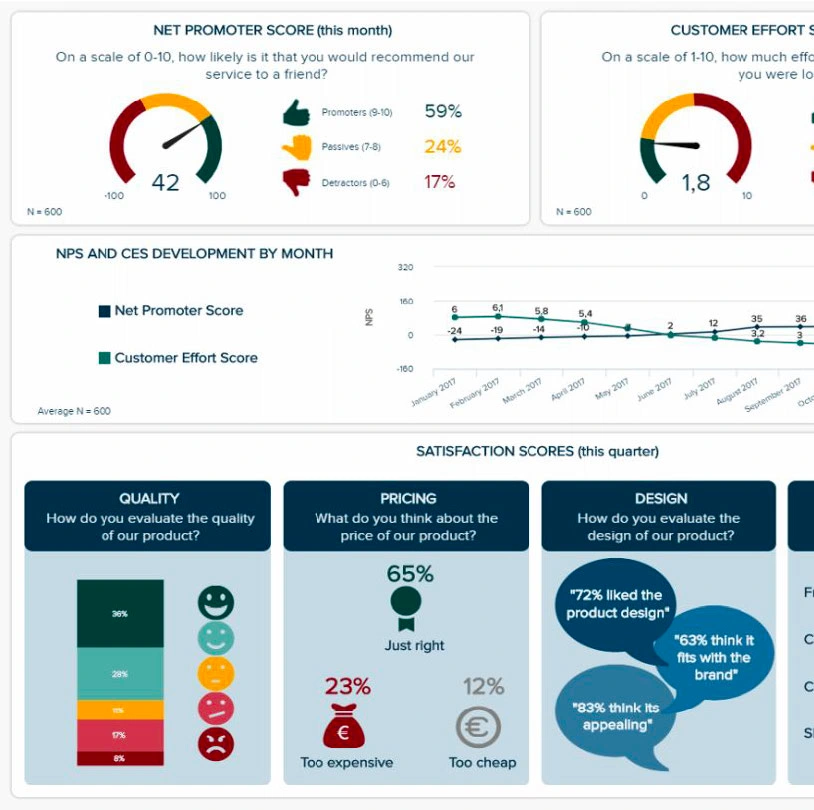
In the future, Mustad will be able to understand its customers expectations and experience and its own performance in delivering at a glance. This project sets up the process and roadmap for building a Voice of the Customer dashboard.
However, Mustad currently is not set up to create the full picture it needs. Keys changes to measuring include:
Collect information in a consistent way across regions and departments to be able to compare.
Collect information regularly, to compare previous results and predict patterns.
Hire staff to set up infrastructure and create reporting processes that integrate with BAU.
Clarify user journeys to be able to act. Currently, if you could see that complaints are going up, you don’t have the mechanisms to do something about that.
Goals of Measures 1.0
The objective was to establish simple proxy measures to validate performance of customer experience and provide clarity on ways to analyse opportunities to make a difference.
Process Overview
The process involved:
Customer Value Matrix: Reviewing existing sources to organise what Mustad knows about its customers across 30 elements of customer value under 4 business questions.
Applied across Customer Lifecycle: Prioritising value points according to business priorities and mapping them to the customer journey.
Identifying Indicators: Looking for indicators for each value point—what needs to be true for Mustad to have delivered this value?
Data Needs & Collection Methods: Choosing methods that align with existing services and are straightforward to implement.
Classifying Customer Values
We identified 30 categories and 165+ components of customer value. This is a living document that will be updated every time more research is conducted.
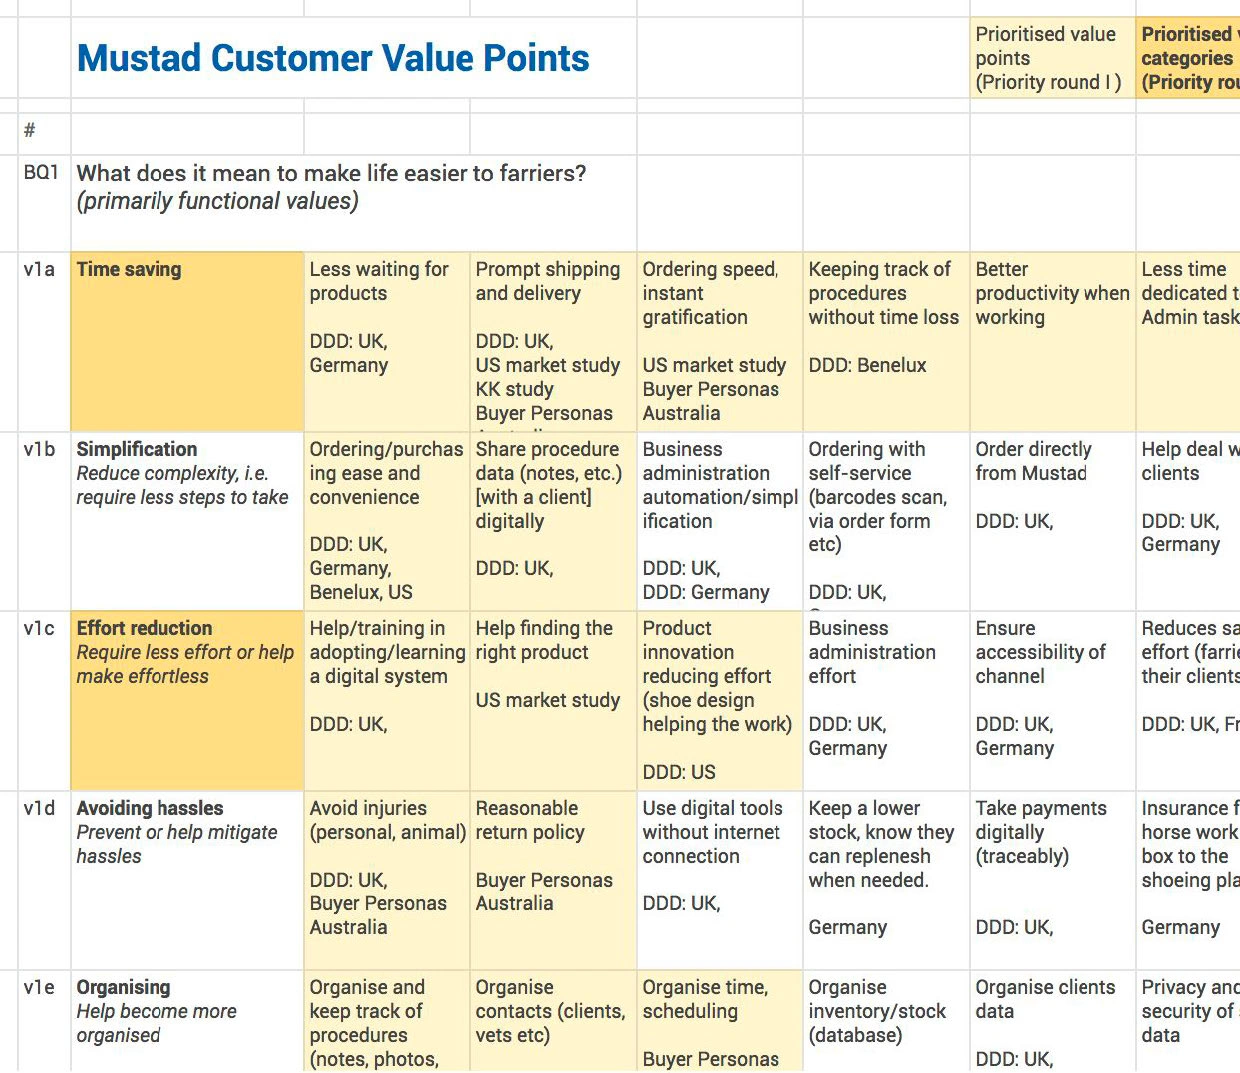
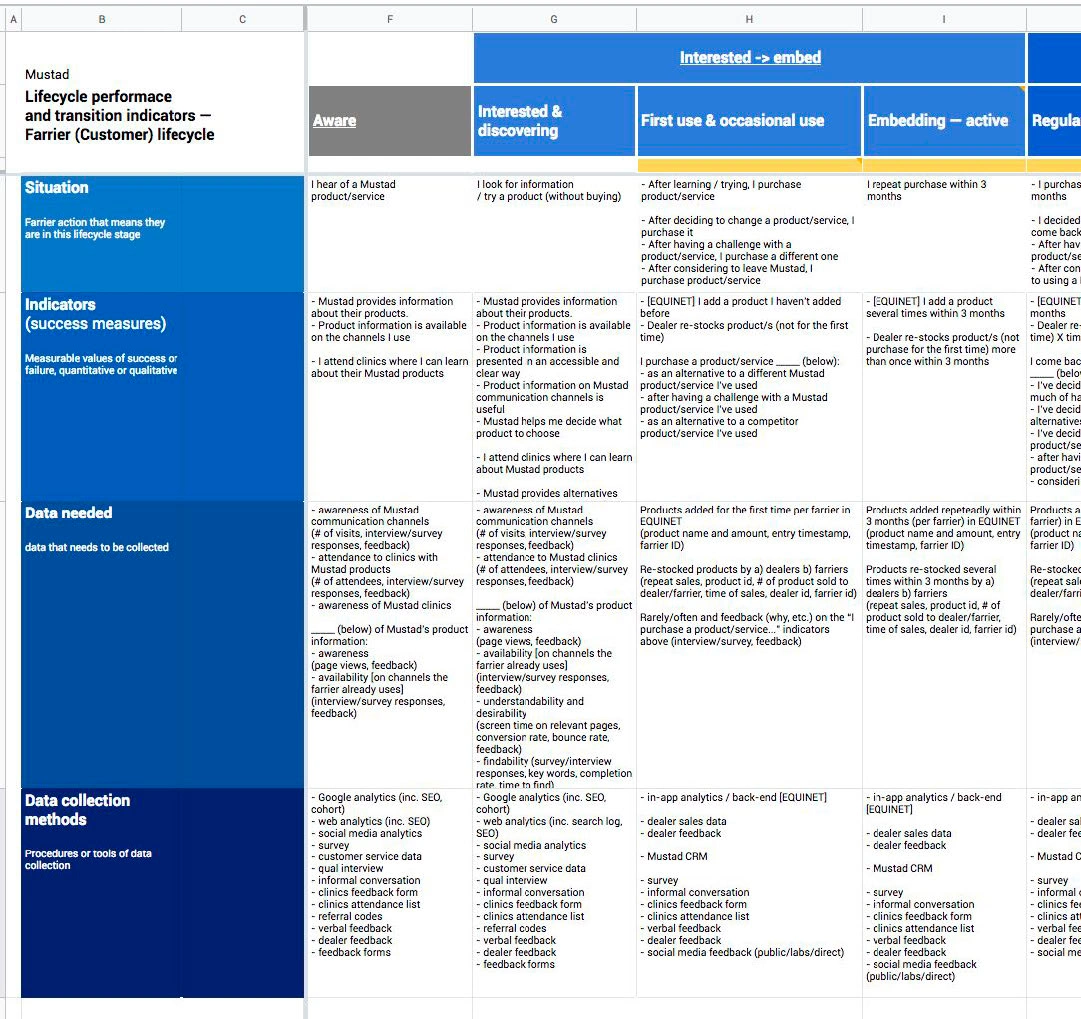
Mustad Farrier Indicator Chart
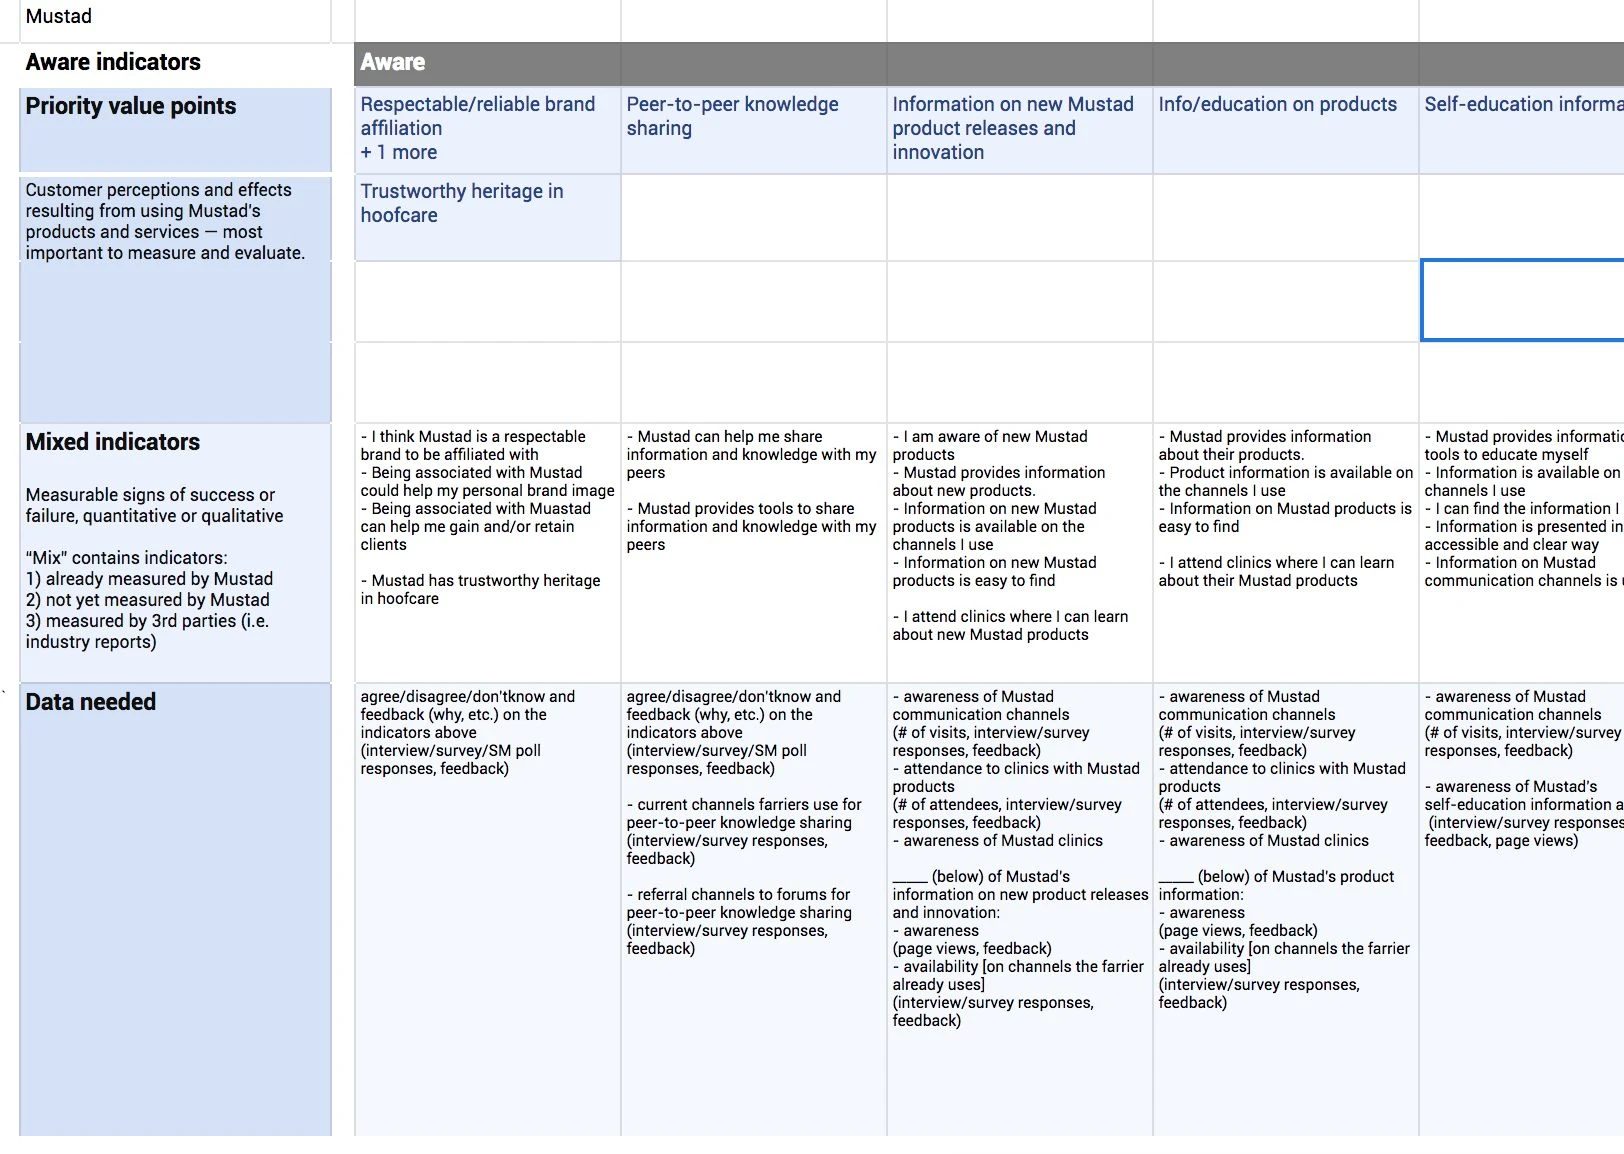
The indicator chart is organised across the customer lifecycle. It includes success indicators, data needs, and collection methods.
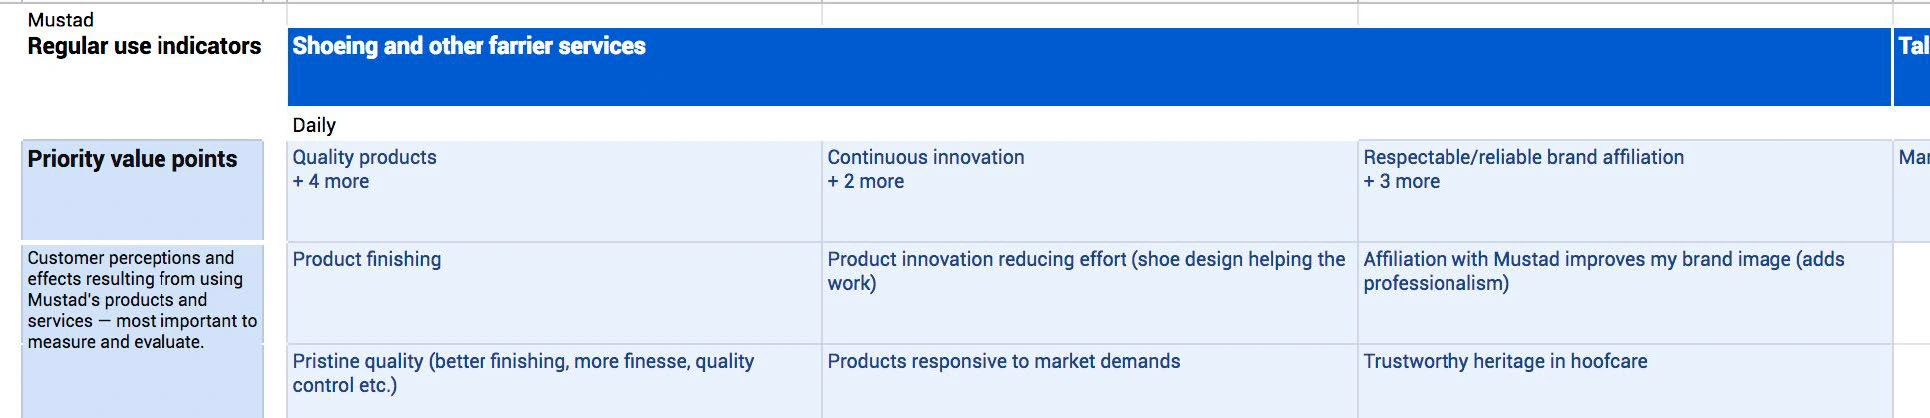
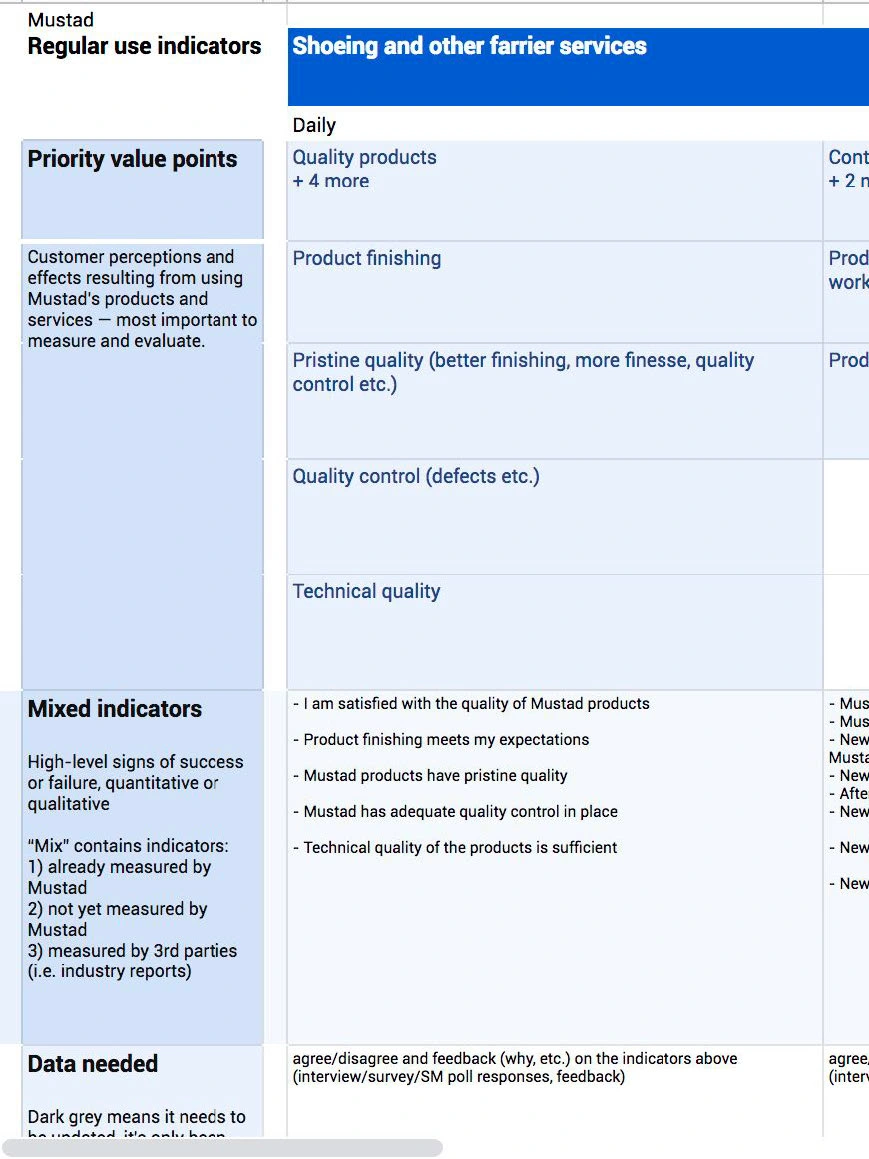
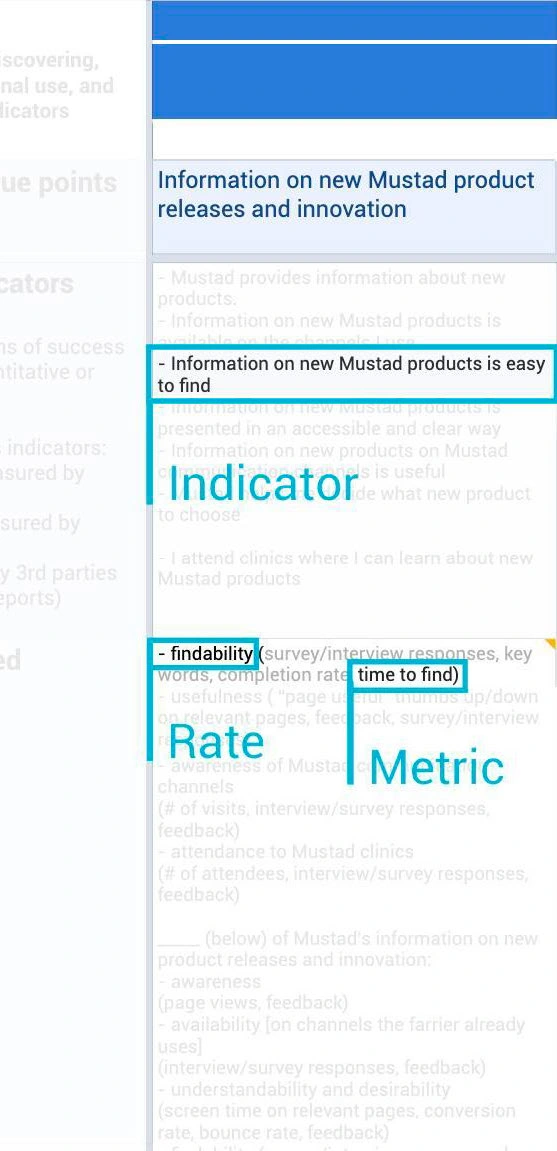
A closer look at the indicator chart
The indicator chart is made up of several layers to find out what and how to measure. Each value point has success indicators, data needs, and collection methods.
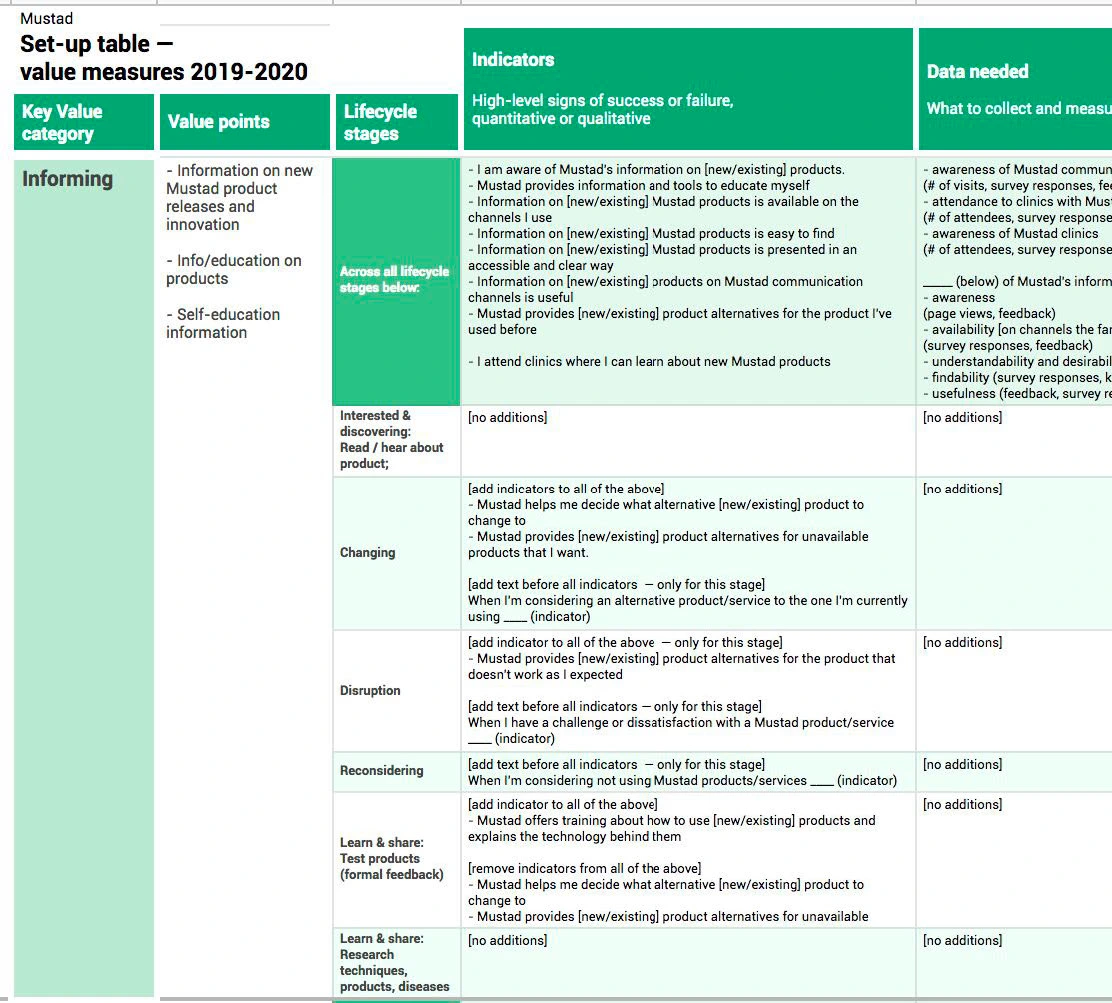
Measures Setup Table
This table includes the highest priority value points to make it easier to plan and compare. It is organised around the data needed to make it easier to see what new measures need to be put into place.
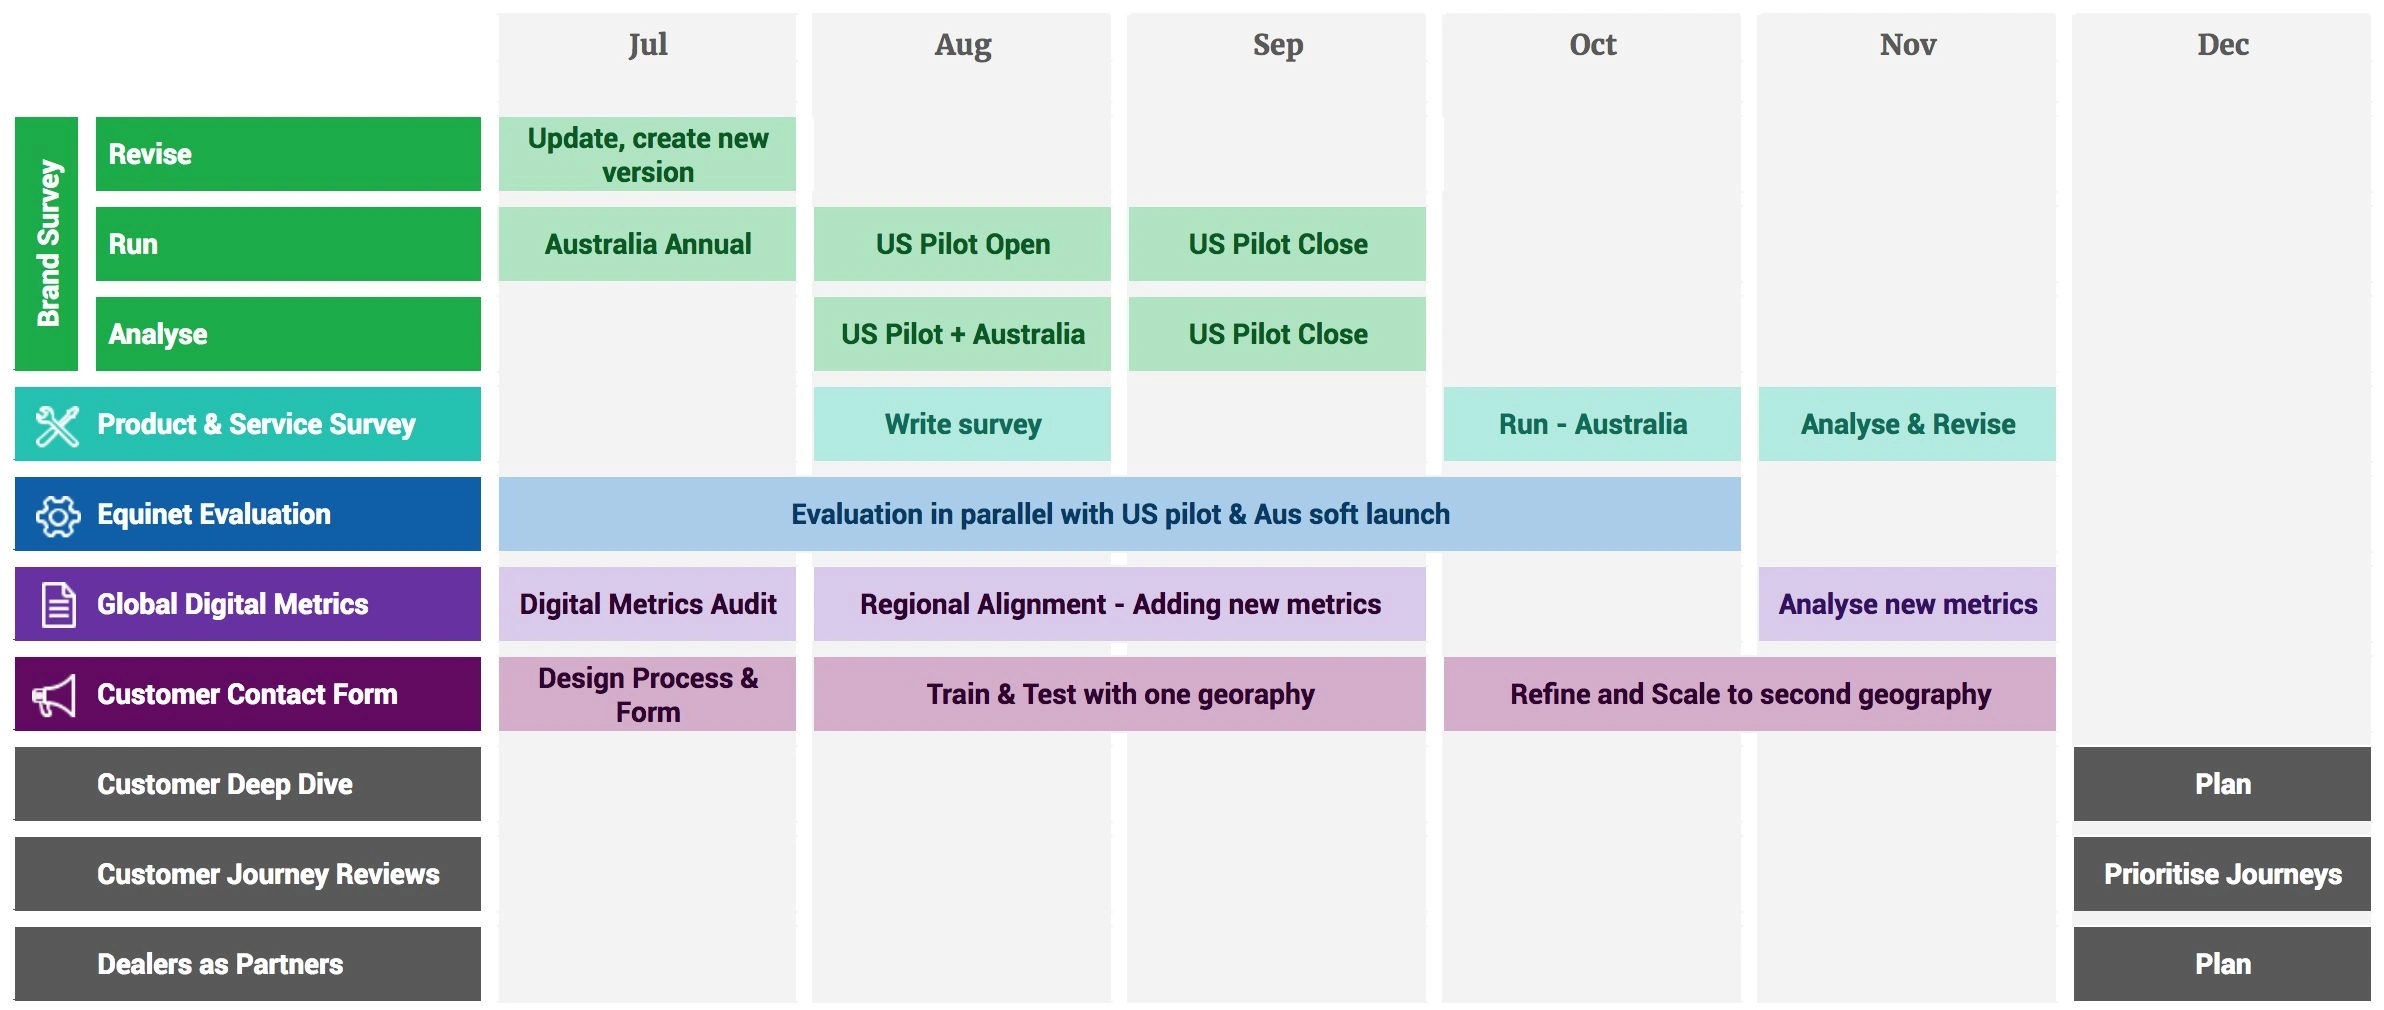
Roadmap
Build a base of data, but also expertise. This can't all be done at once. We suggest starting with existing projects and working towards alignment on others.
Understanding the whole picture
We laid out the Farrier Career Lifecycle and the Farrier Customer Journey Lifecycle. Indicators show which stage a farrier is in and how they move through different stages.
Project Impact
Doing all of this accomplishes four key things:
Get data on the table: Owning more of the story by leveraging individual contacts with farriers.
Understand what to measure next: Planning Customer Deep Dives and Journey Reviews with effective use of resources.
Learn what's most important to know: Regularly revising data to reflect business needs.
Build capability: Laying the foundation for a Data Driven Mustad through increased skills and different ways of working.
Glossary and terms
Clarifying language is an essential part of this process. Everyone needs to fully understand the words we use in order to be able to put this into practice.


Like this project
Posted Jun 29, 2026
Establishing proxy measures for customer experience at Mustad.
Likes
0
Views
0