Super Dashboard

Mohamed Yosef

The growth of supermarkets in most populated cities are increasing and market competitions are also high. In this dashboard we'll give it a try and turn everything into a readable visualizations.
About the dataset
The dataset is one of the historical sales of supermarket company which has recorded in 3 different branches for 3 months data.Visit Data Source
Versioning
Based on Streamlit 1.25.0
Analysed by Pandas 2.0.3
Visualized by Plotly 5.16.1
Made with Python 3.11
Like this project
Posted Jan 26, 2024
The growth of supermarkets in most populated cities are increasing and market competitions are also high. In this dashboard we'll give it a try and turn everyt…
Likes
0
Views
1


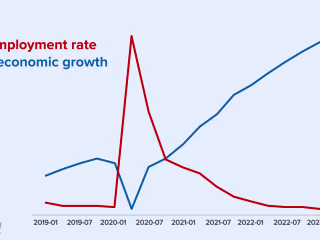
Unemployment rate and economic growth after COVID-19

Energy Consumption - Time Series Forecasting