HR teams spend hours every
Imaad Mahmood
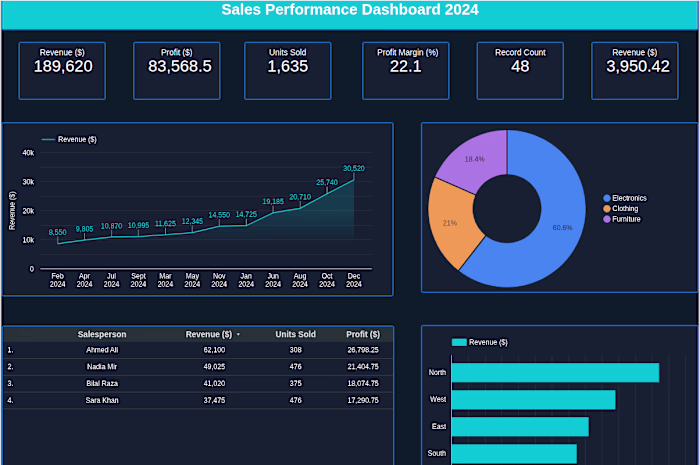
HR teams spend hours every week pulling salary, performance, and turnover data from separate spreadsheets. This dashboard puts all of it in one place — live.
Built this HR Analytics Dashboard in Google Looker Studio with 5 KPI cards, department salary breakdown, geo distribution map, and a ranked leaderboard sorted by total compensation.
Engineering leads at $1.05M total salary. Finance close behind. Decision-makers can see that in 3 seconds instead of 3 hours.
Like this project
Posted Apr 2, 2026
HR teams spend hours every week pulling salary, performance, and turnover data from separate spreadsheets. This dashboard puts all of it in one place — live....
Likes
0
Views
4