Real-Time Energy Data Pipeline on AWS (Client Project)

Tran Tien Van


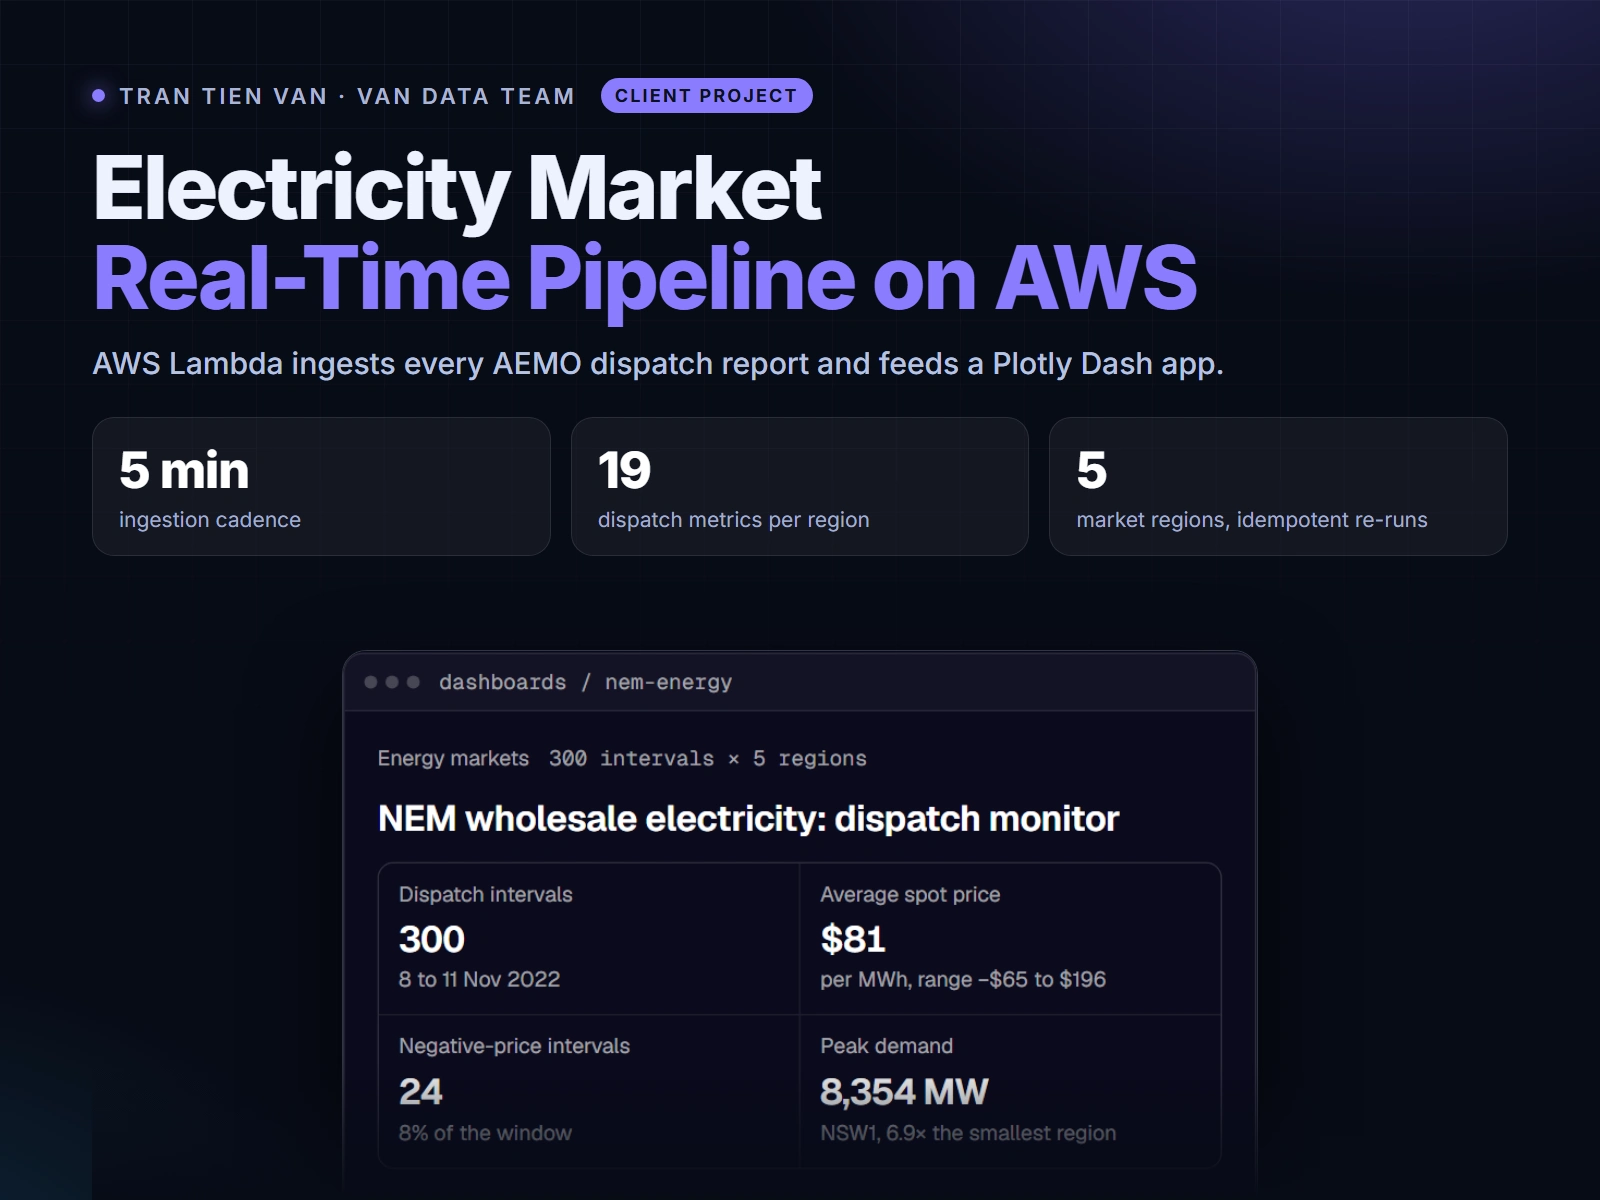
Client project for an energy-market analytics team (client unnamed). A scheduled data pipeline for the Australian National Electricity Market (NEM).
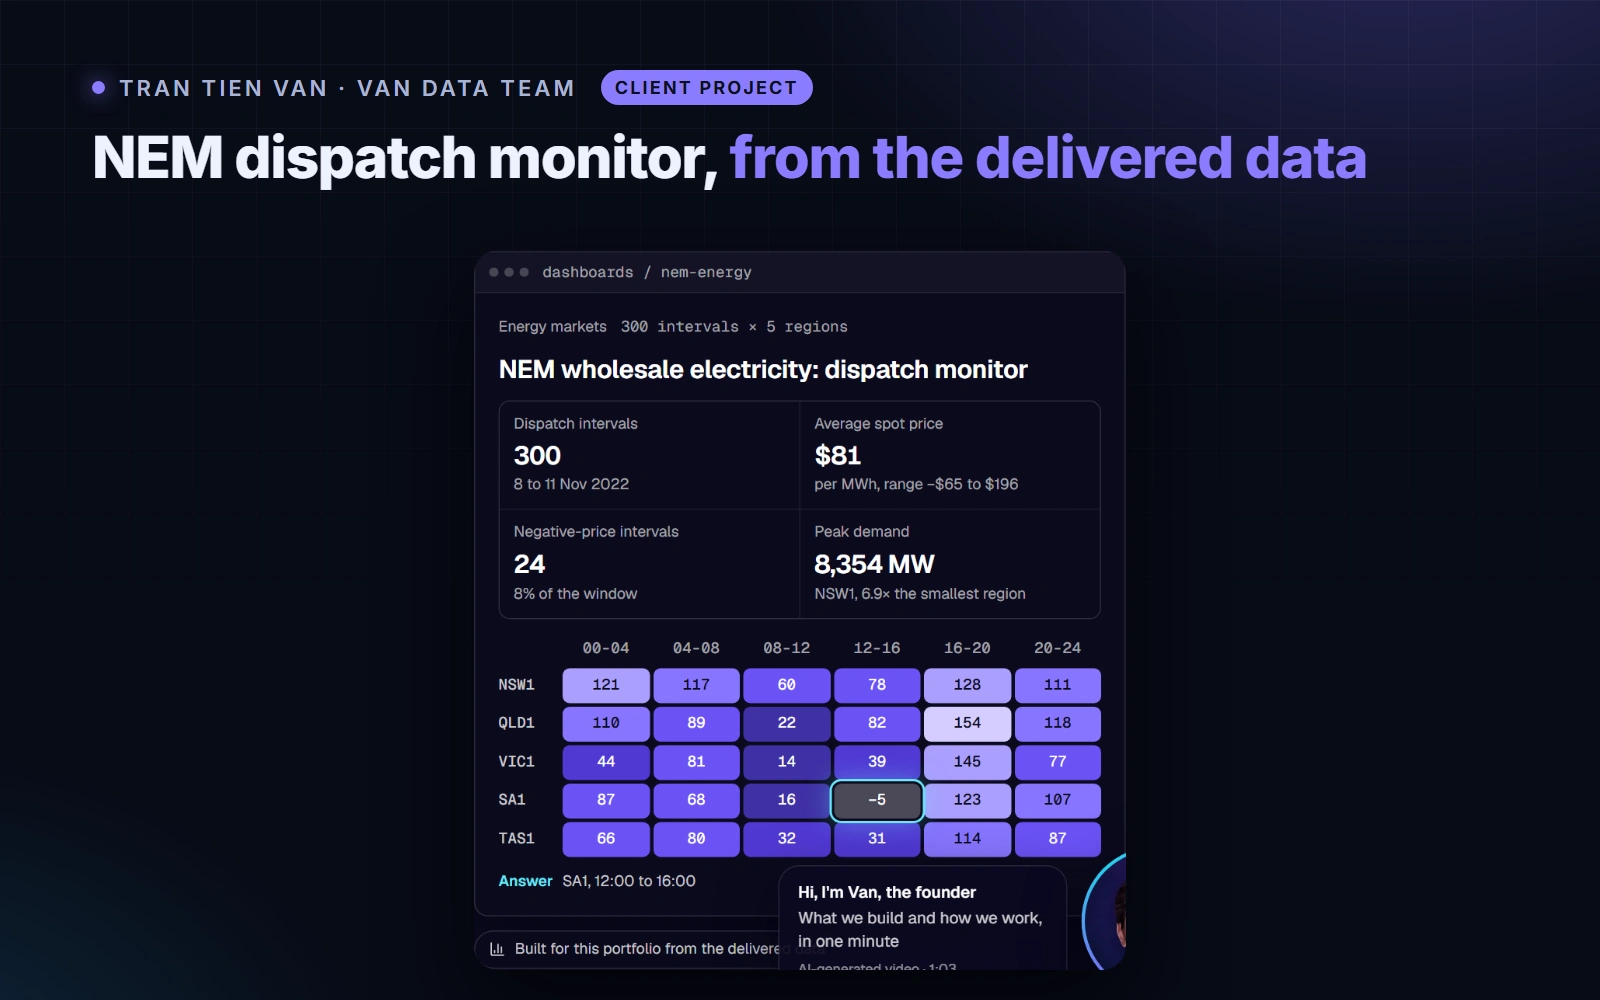
What we built
A scheduled AWS Lambda pipeline that fetches each NEMWeb dispatch report every five minutes
Every report archived in S3 and 19 dispatch metrics per region written to DynamoDB, with idempotent re-runs
A Plotly Dash app where analysts compare the five market regions
Results
A new AEMO dispatch report ingested every 5 minutes across 5 market regions
19 dispatch metrics per region, from spot price to net interchange
Every report archived in S3 and streamed to DynamoDB, with idempotent re-runs
What the data says
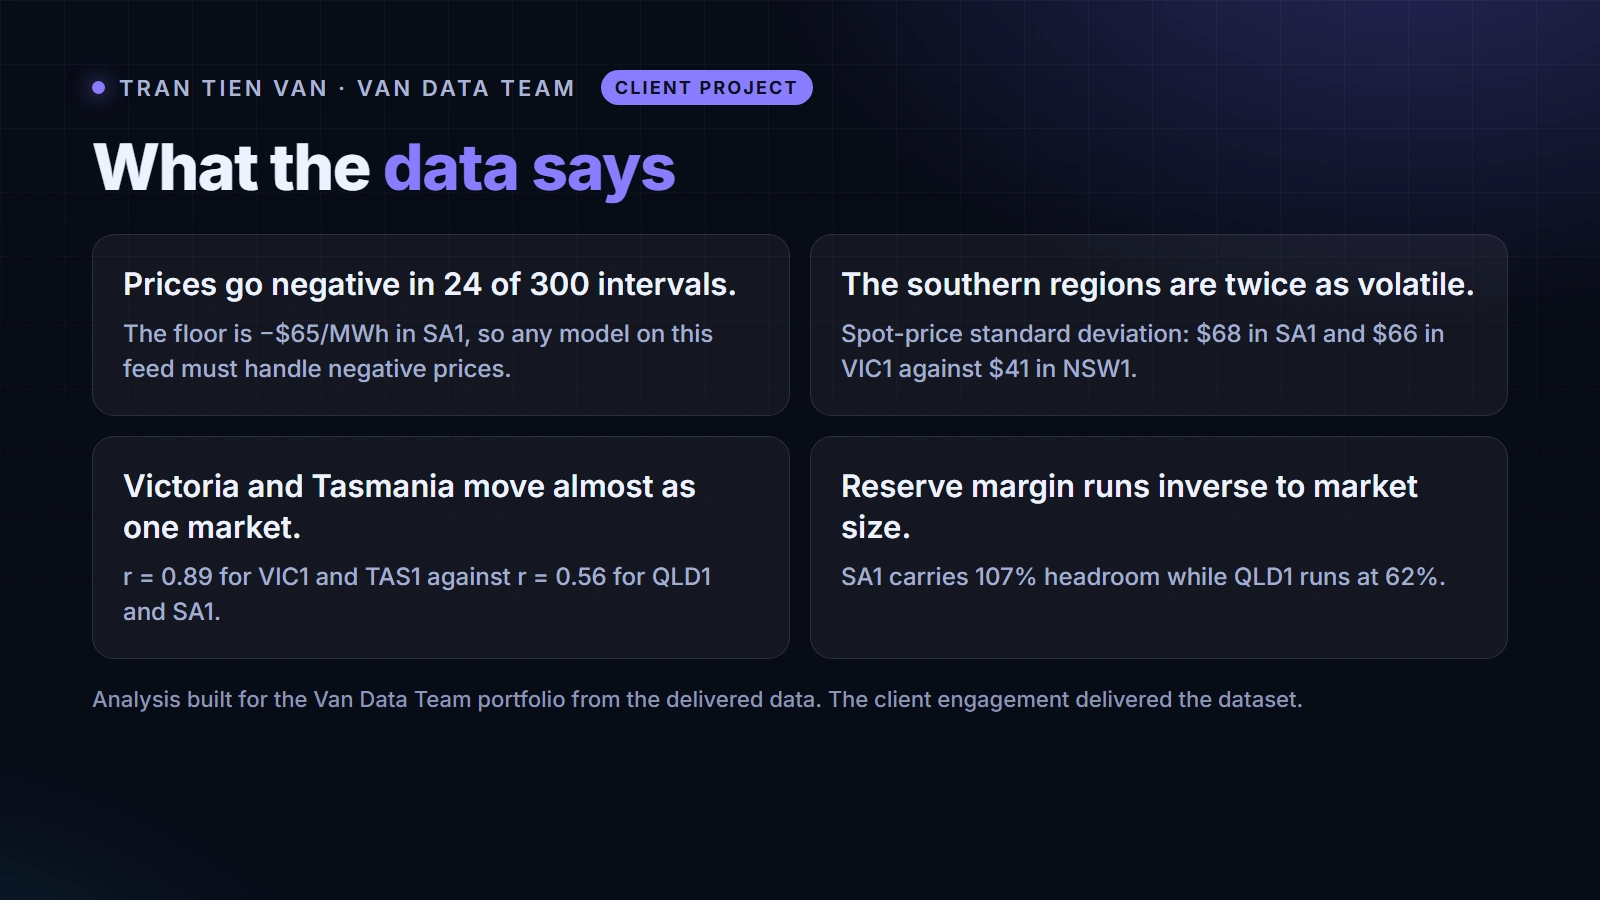
Prices go negative in 24 of 300 intervals; the floor is -$65/MWh in SA1
The southern regions are about twice as volatile as New South Wales
Victoria and Tasmania move almost as one market (r = 0.89)
The dashboard was built by Van Data Team for its portfolio from the delivered data; the client engagement delivered the data.
Stack: AWS Lambda, Amazon S3, DynamoDB, Python, Plotly Dash.
Full case study: vandatateam.com/portfolio
Like this project
Posted Nov 5, 2026
Client project: AWS Lambda pipeline ingests each AEMO dispatch report every 5 minutes into S3 and DynamoDB, feeding a Plotly Dash analytics app.