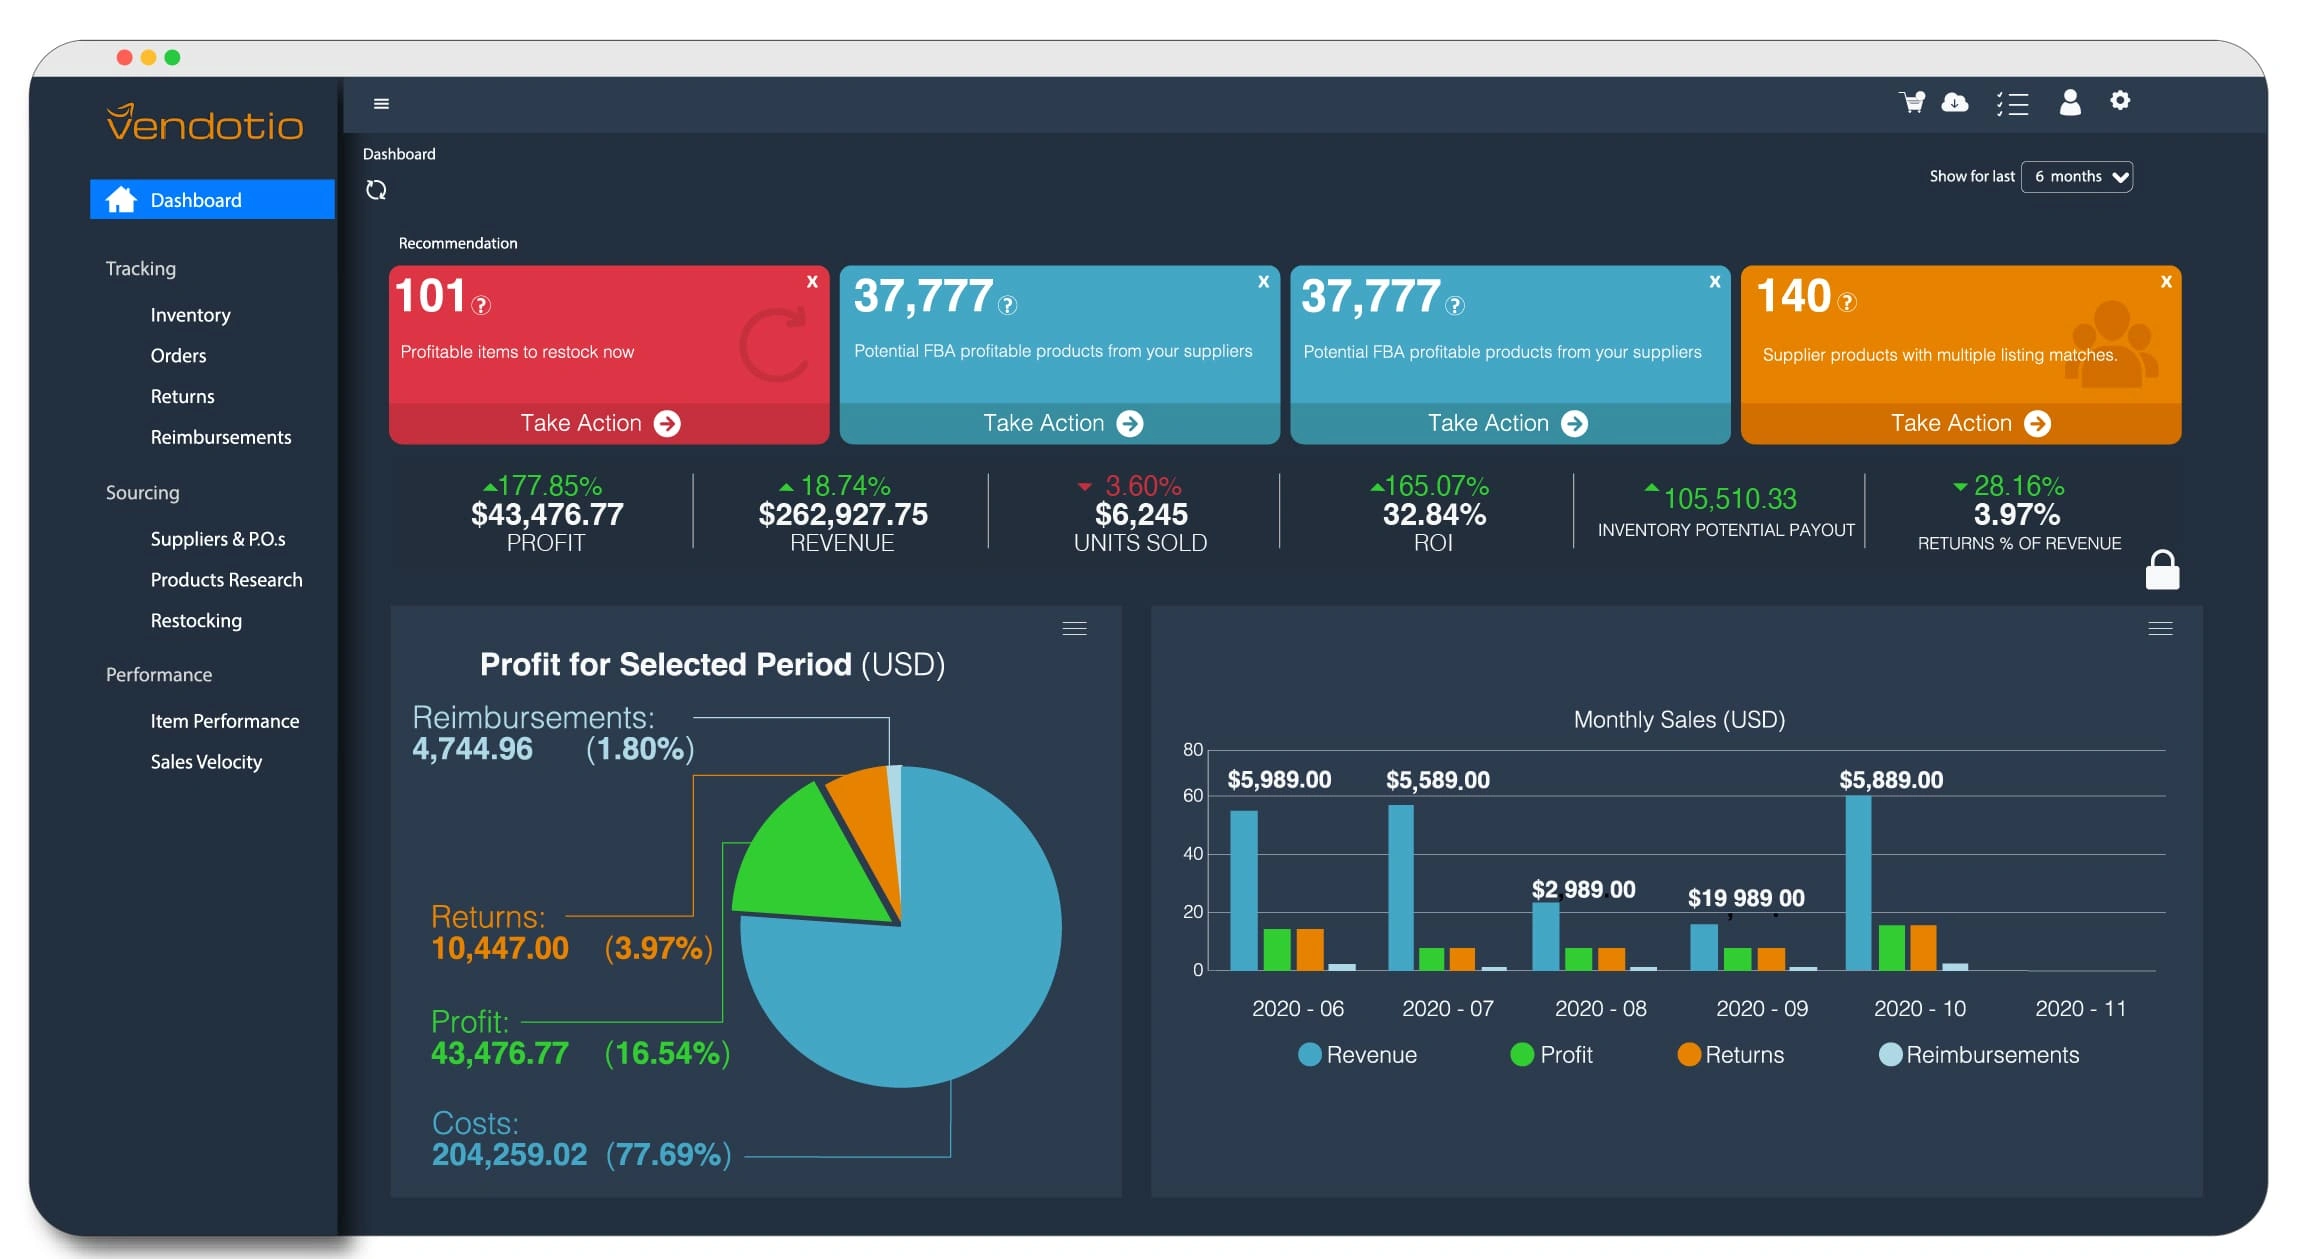
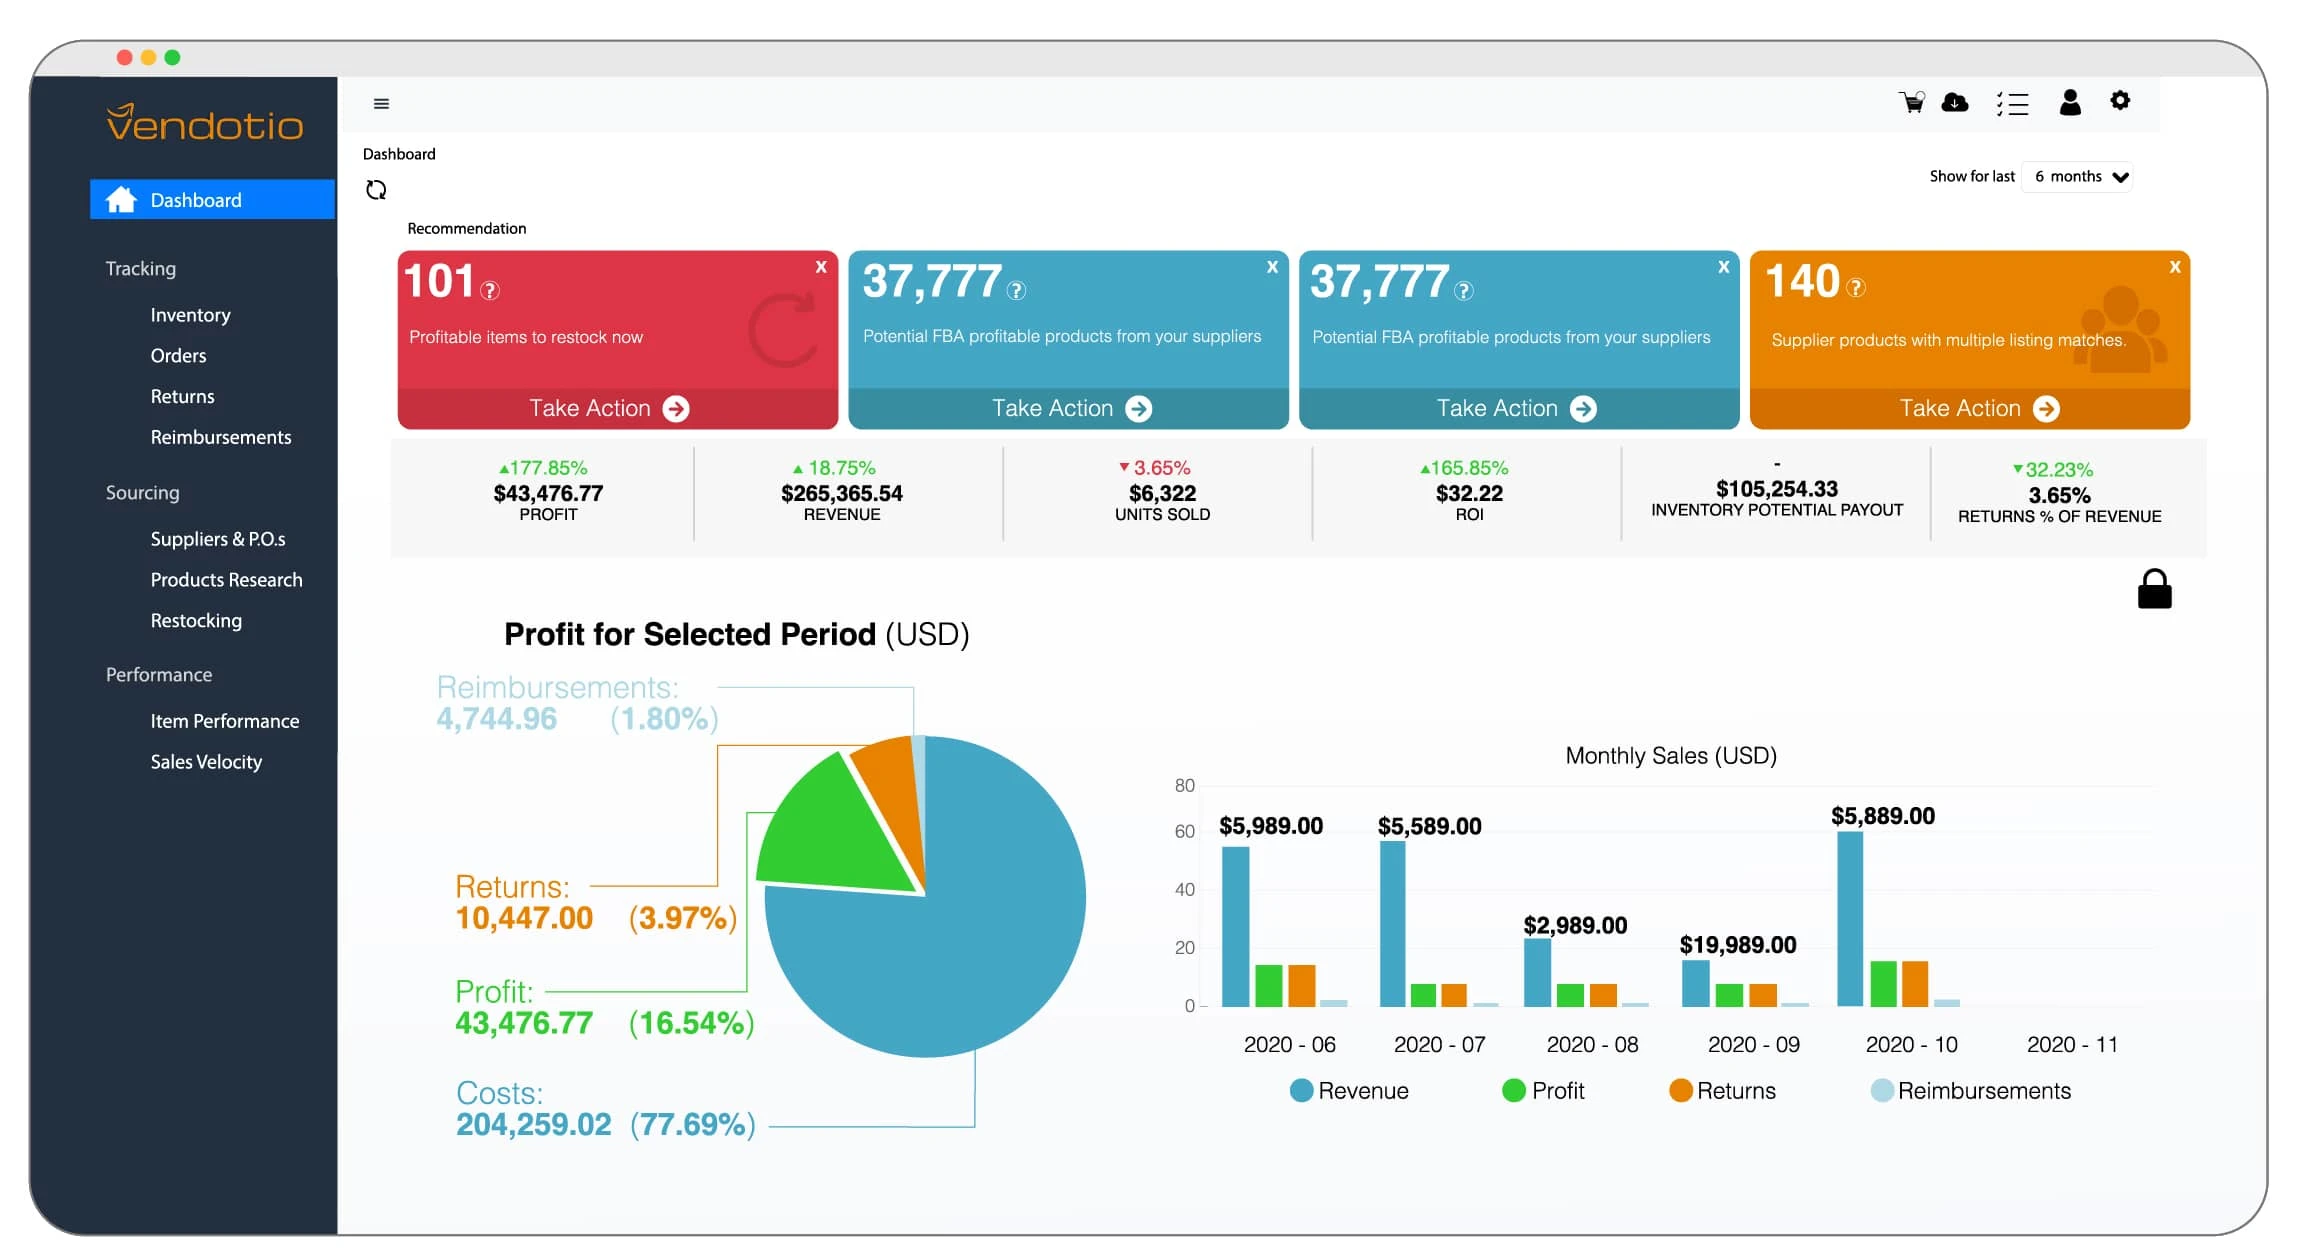
Mockup of Dashboard
Scott DS Young
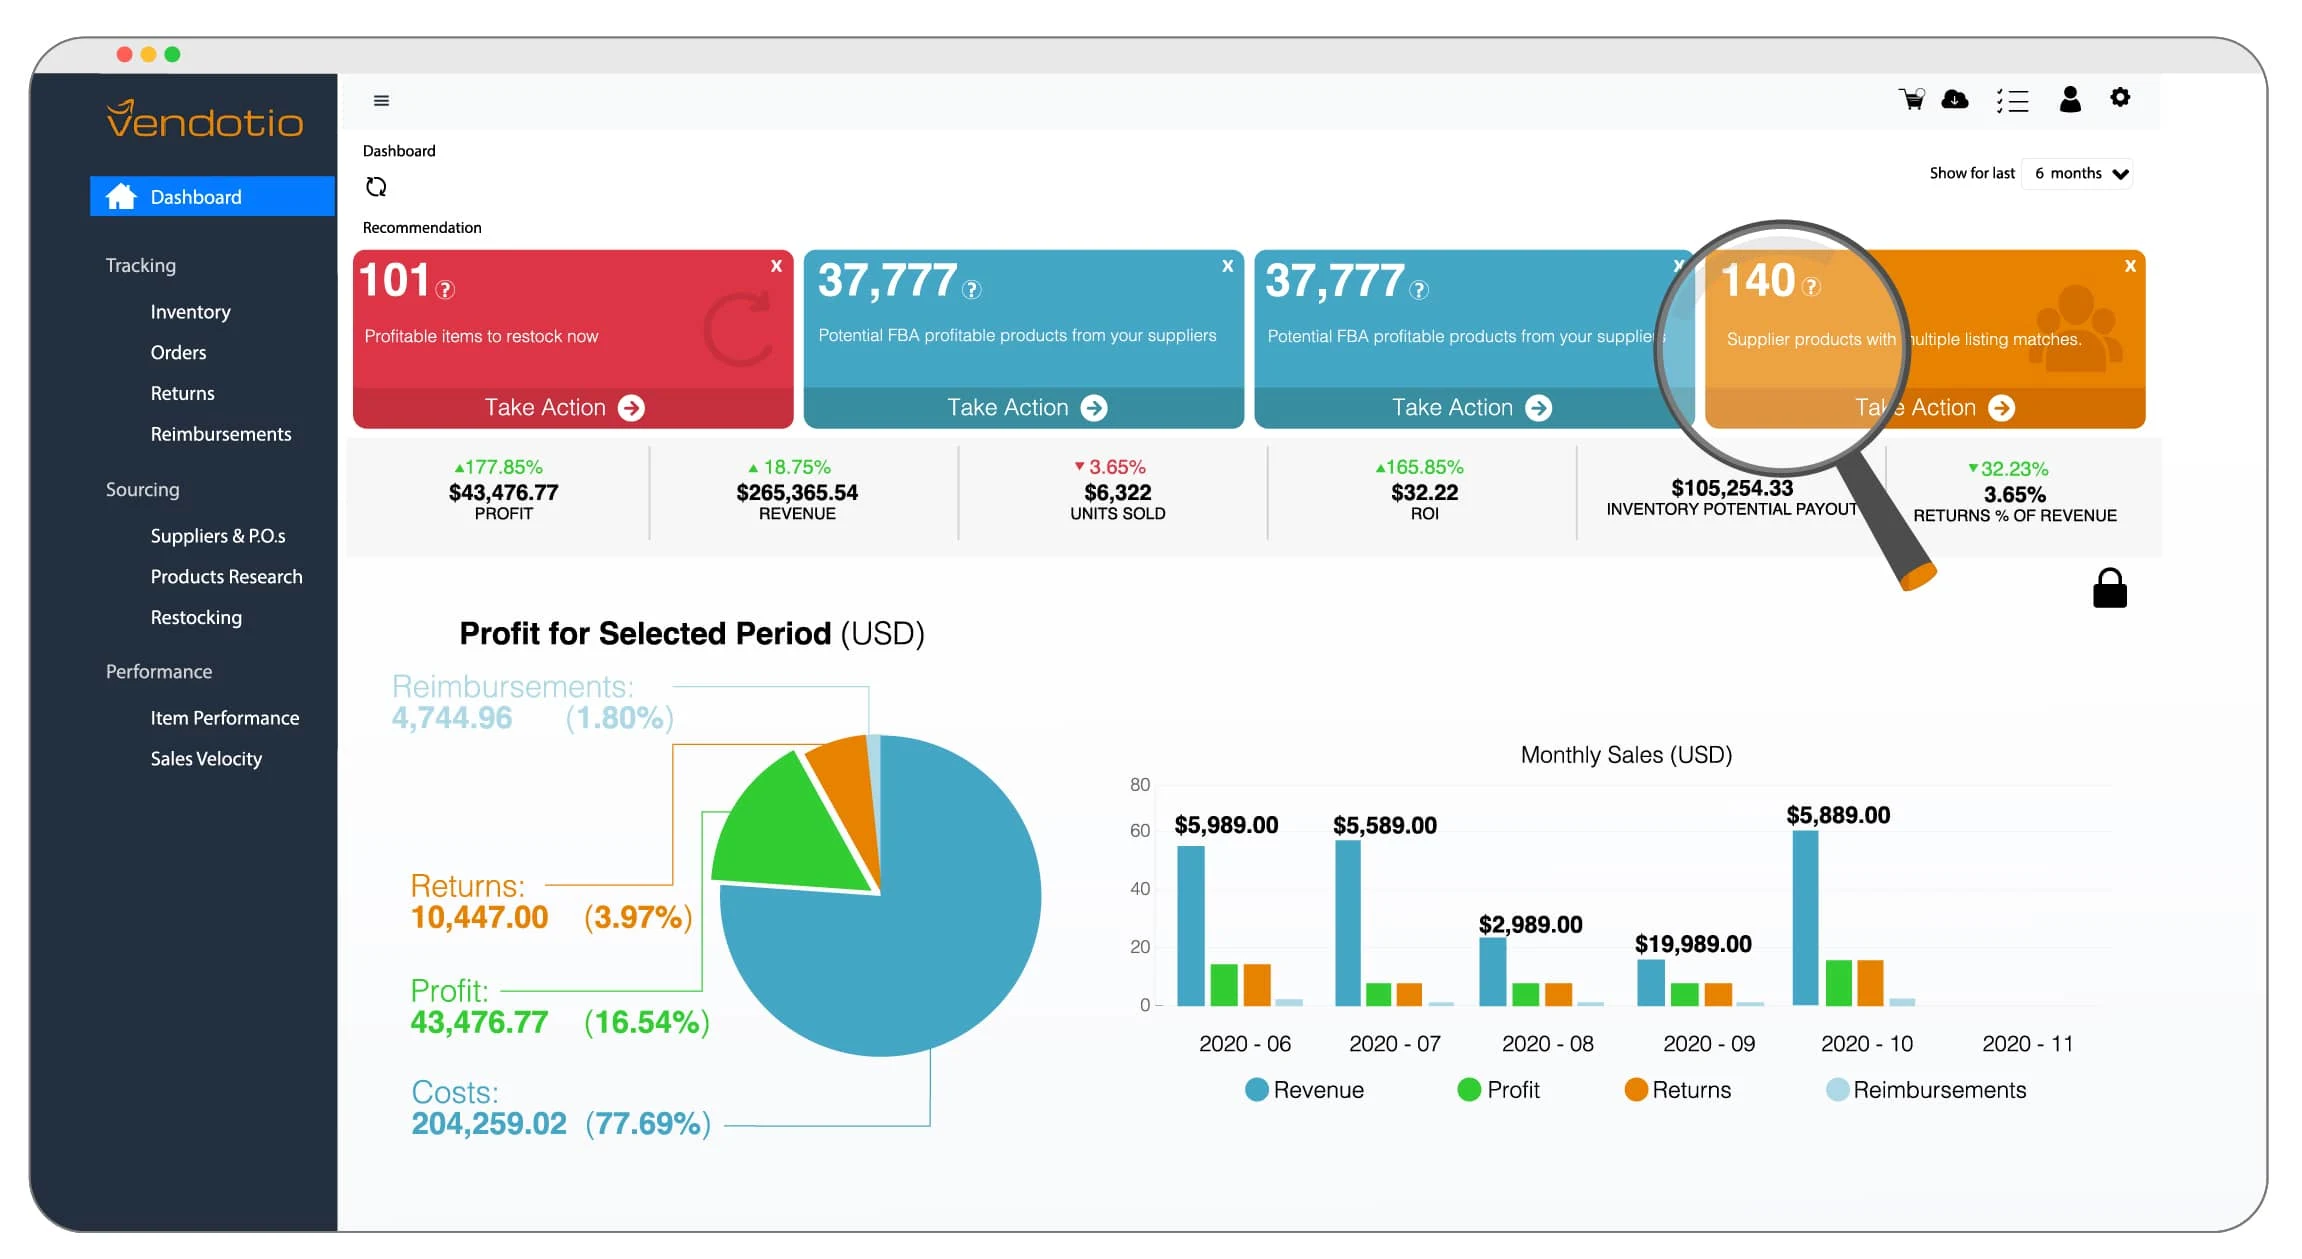
To support Vendotio’s goal of illustrating the analytics dashboard that visualized and engaged the user. I created a set of illustrated infographics and designed both light and dark mode dashboard views, by following their brand guidelines and refining concepts based on provided content descriptions, I delivered visuals that enhance user experience and bring clarity to their platform.
This was used on the company website
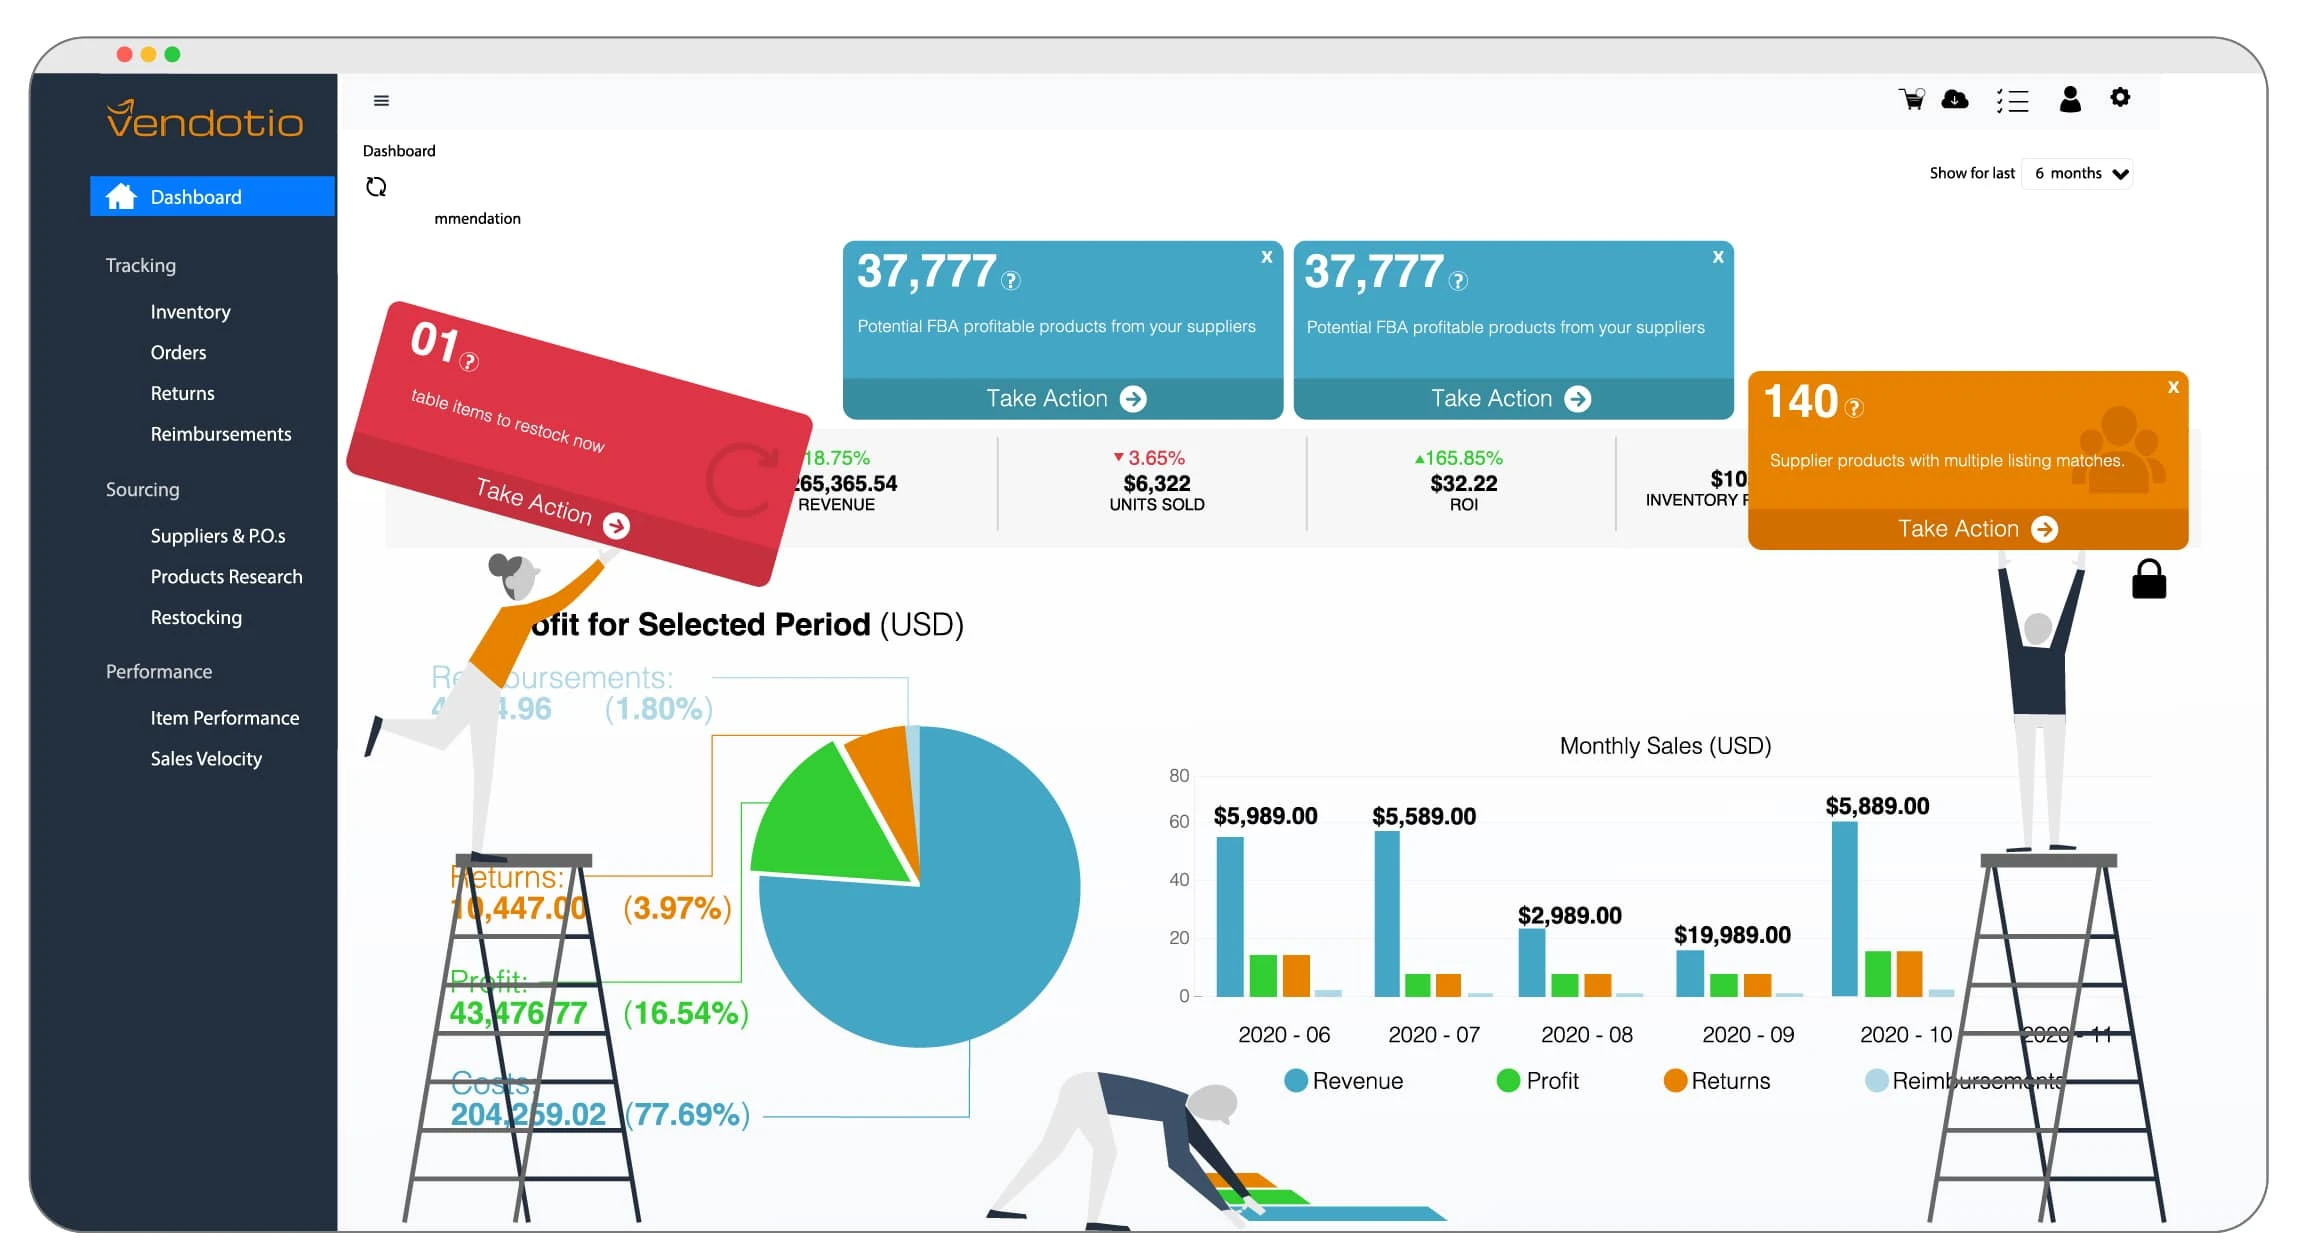
This was used in social media posts
Like this project
Posted Mar 2, 2025
Designed illustrated infographics and light/dark mode dashboards for Vendotio, enhancing data visualization and user experience within brand guidelines.
Likes
0
Views
9
Timeline
Feb 2, 2025 - Mar 15, 2025