Demo project: Small-business KPI dashboard

NewCo Studio


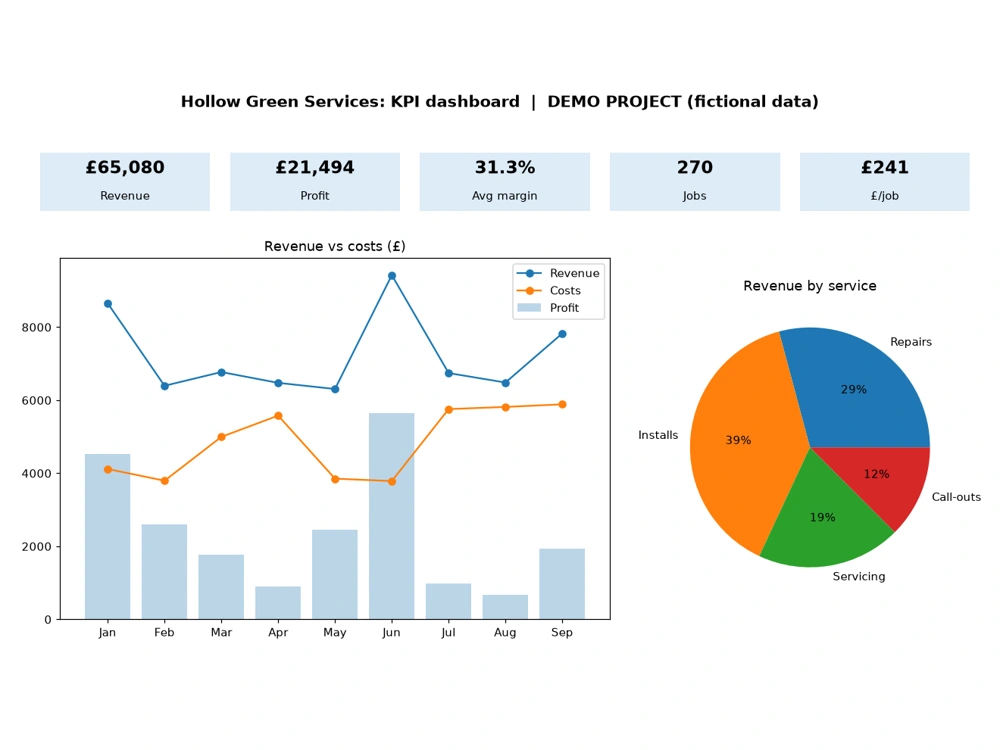
Demo project (fictional business and data, no real client). A KPI dashboard for a trade business, built as a spreadsheet that opens in Excel or imports into Google Sheets. Monthly data feeds live formulas for profit, margin, jobs and revenue per job, plus a line chart of revenue against costs and a pie chart of revenue by service. Update the monthly rows and every figure and chart refreshes automatically.
Like this project
Posted Oct 22, 2026
Demo project (fictional business and data, no real client). A spreadsheet KPI dashboard for a trade business, opens in Excel or Google Sheets.