Sales Performance Analysis

Noorullah J

Problem
Develop an interactive dashboard for our superstore, facilitating analysis of sales metrics, profitability, and product category performance across geographical regions. The dashboard should include visuals depicting top-selling states, profit margins, and sales trends over time intervals, enabling efficient inventory management and data-driven marketing strategies.
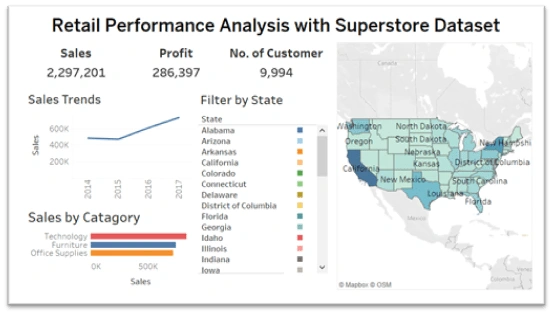
Solution
This interactive dashboard offers a comprehensive view of your Superstore's performance, supporting data-driven decisions for growth.
Key Features:
Top Selling States: Identify profitable regions for targeted marketing efforts.
Profitable Product Categories: Focus on high-margin categories for inventory and promotions.
Sales Trends: Track performance over time to identify growth opportunities.
Interactive features:
Dynamic Map: Explore regional sales and profitability with interactive filters.
Profitable Products: Analyze top-performing categories with detailed breakdowns.
Customizable Trends: Track sales across timeframes and filter by category or region.
Actionable Recommendations: Receive data-driven suggestions for inventory and marketing.
Conclusion:
This dynamic dashboard transforms data into actionable insights, facilitating efficient inventory management, strategic marketing, and continuous growth for your Superstore.
Like this project
Posted May 15, 2024
Transform your Superstore's data into actionable insights with our interactive dashboard, driving growth through strategic decisions.
Likes
0
Views
12


Web Scraping and Data Extraction for Research Project
Excel Automation for Efficient Survey Analysis