Nextjs Dashboard with Mapbox, Supabase & Redux
Daniel Afaqi
Verified
Disclaimer: All product designs, visuals, and media are the intellectual property of Azimuth. © 2025 Azimuth. All rights reserved.
🎤 Project Overview
AzimuthLive is a game-changing platform developed for a US-based startup to transform the way artists, managers, and venues coordinate concert tours. Built with the goal of bringing precision and intelligence to the live entertainment industry, AzimuthLive uses cutting-edge data infrastructure and interactive design to optimize touring routes across the United States.
With dynamic geospatial visualization, real-time data tracking, and advanced analytics, this platform empowers users to make smarter, faster decisions for concert scheduling—saving time, reducing costs, and maximizing audience reach.
This platform isn't just a tool; it’s a touring command center. It is the desktop web application & it is not focused on mobile version, for that there is a seperate mobile app.
🛠️ My Role & Project Scope
I was brought on board to design and develop an immersive, interactive web interface that would become the cornerstone of AzimuthLive’s tour routing system. My responsibilities included:
Architecting a modern, scalable frontend with a strong focus on user experience and visual clarity.
Building real-time interactivity through map-based routing, live data feeds, and animations.
Collaborating with the startup team to bring complex data and mapping functionality to life through seamless UI/UX.
✨ Key Features Delivered
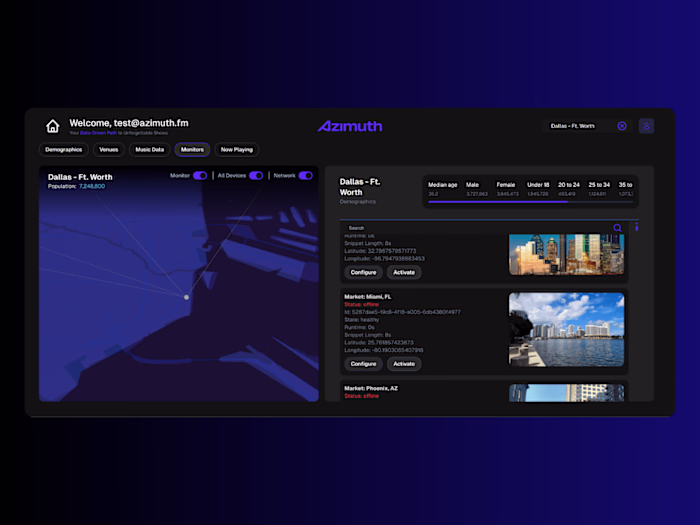
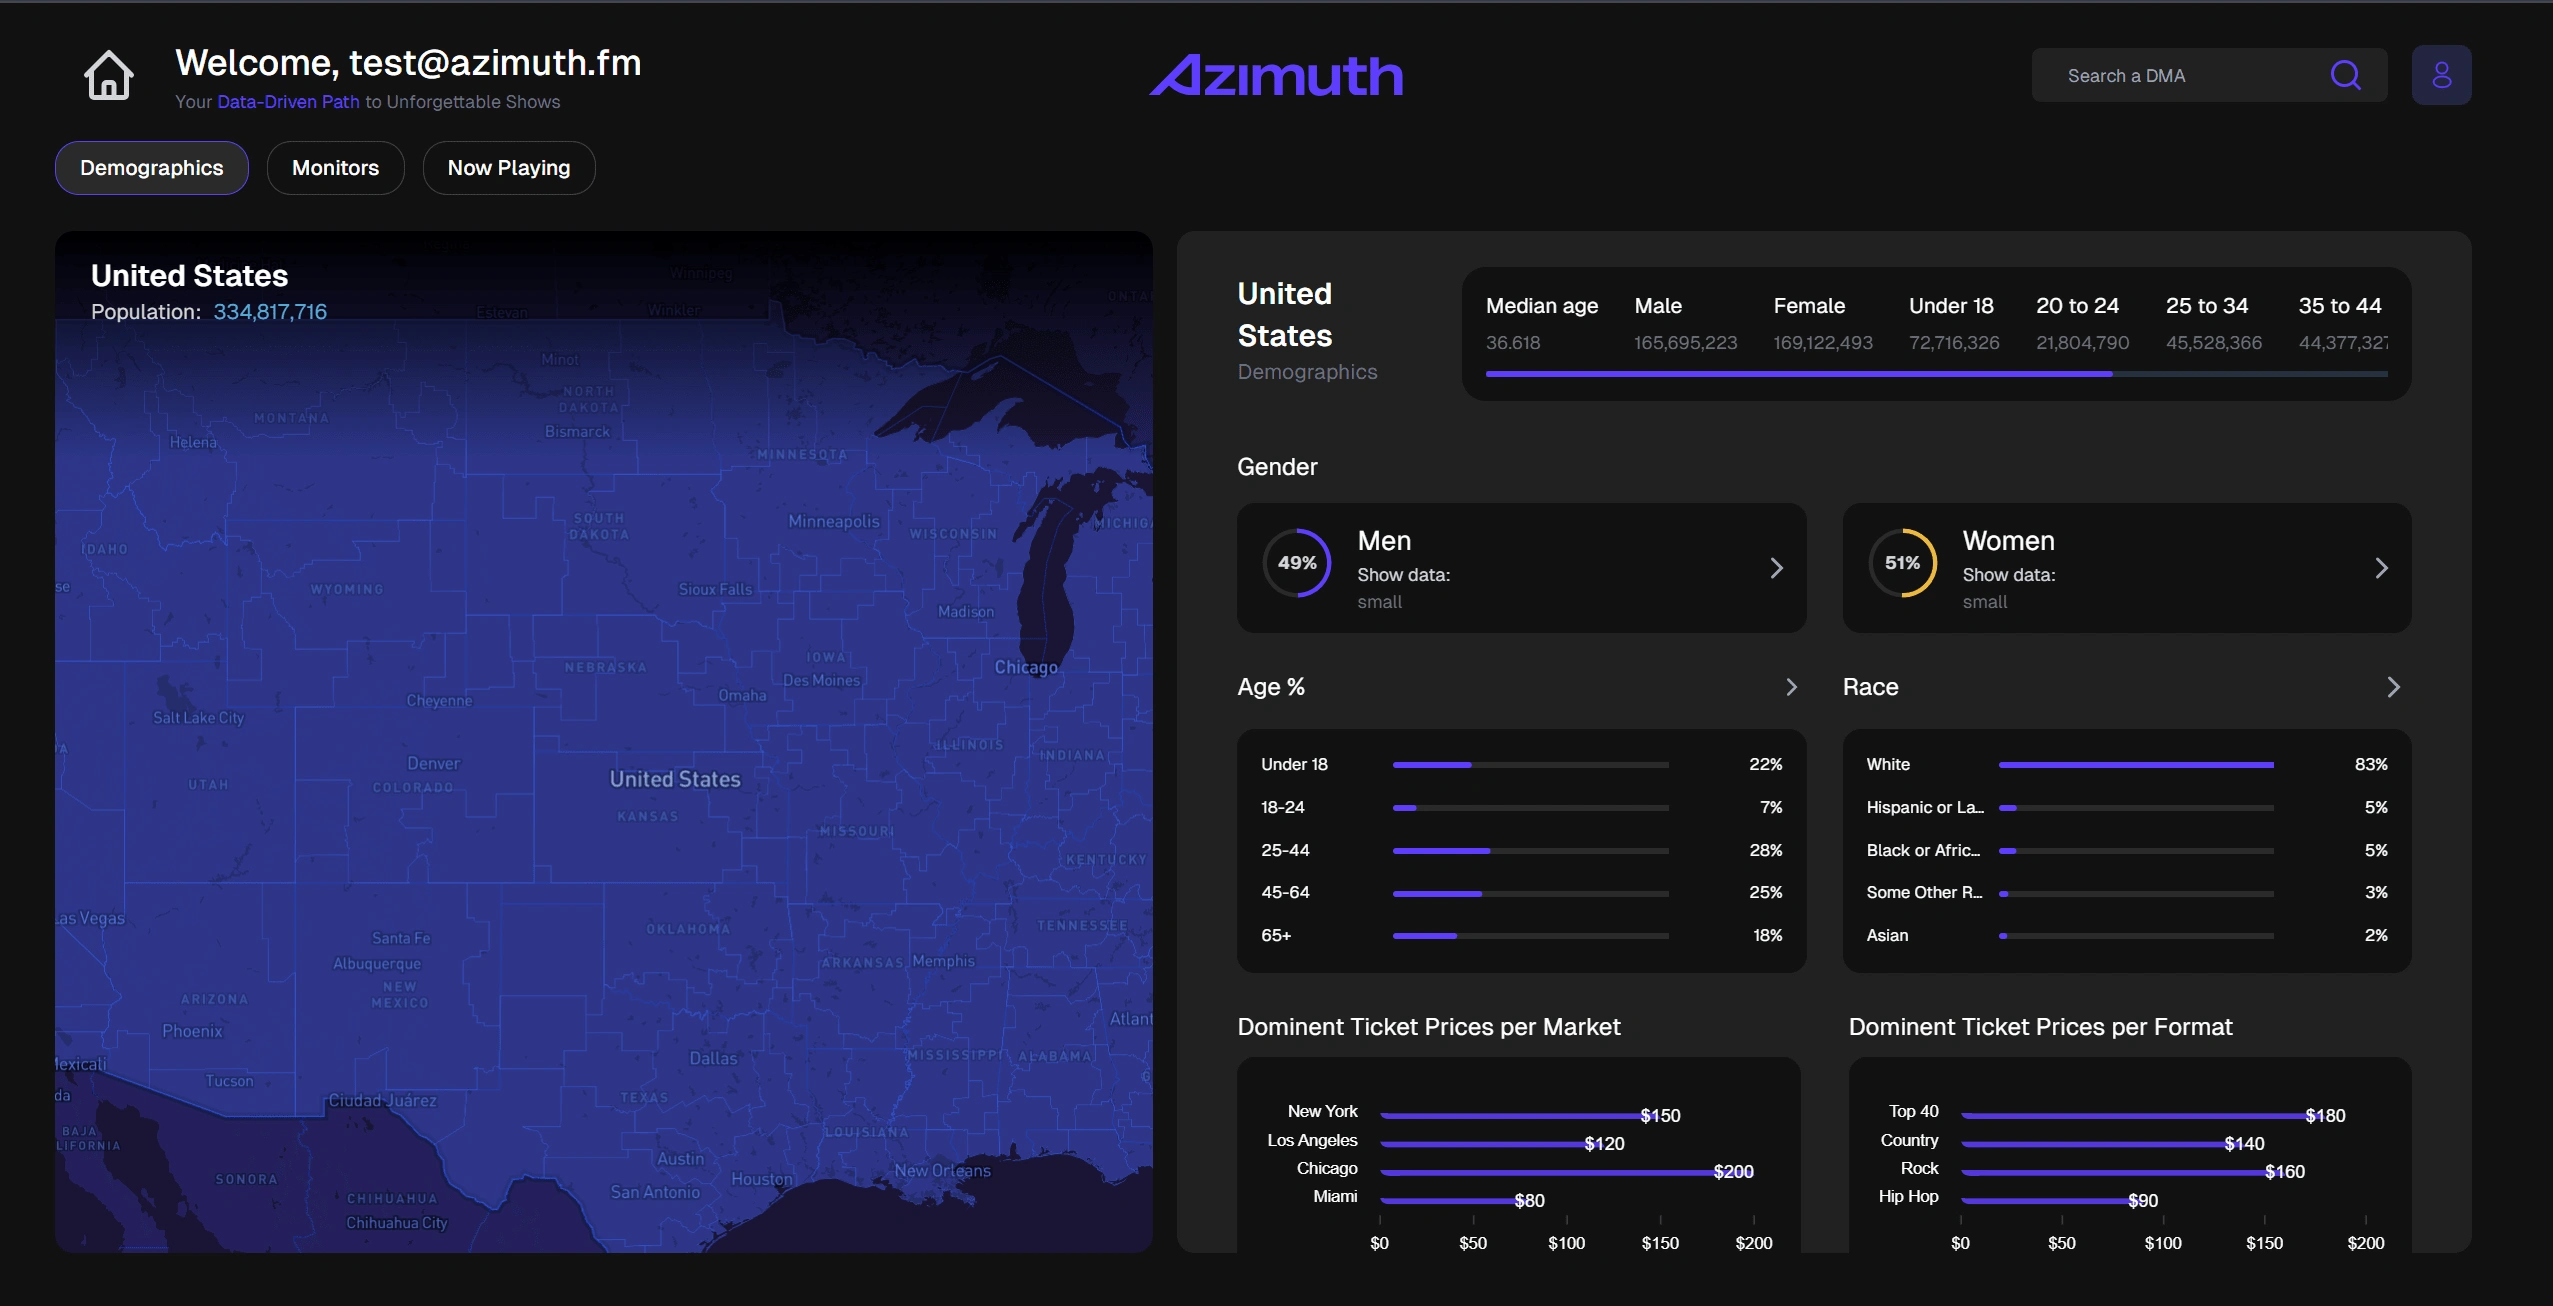
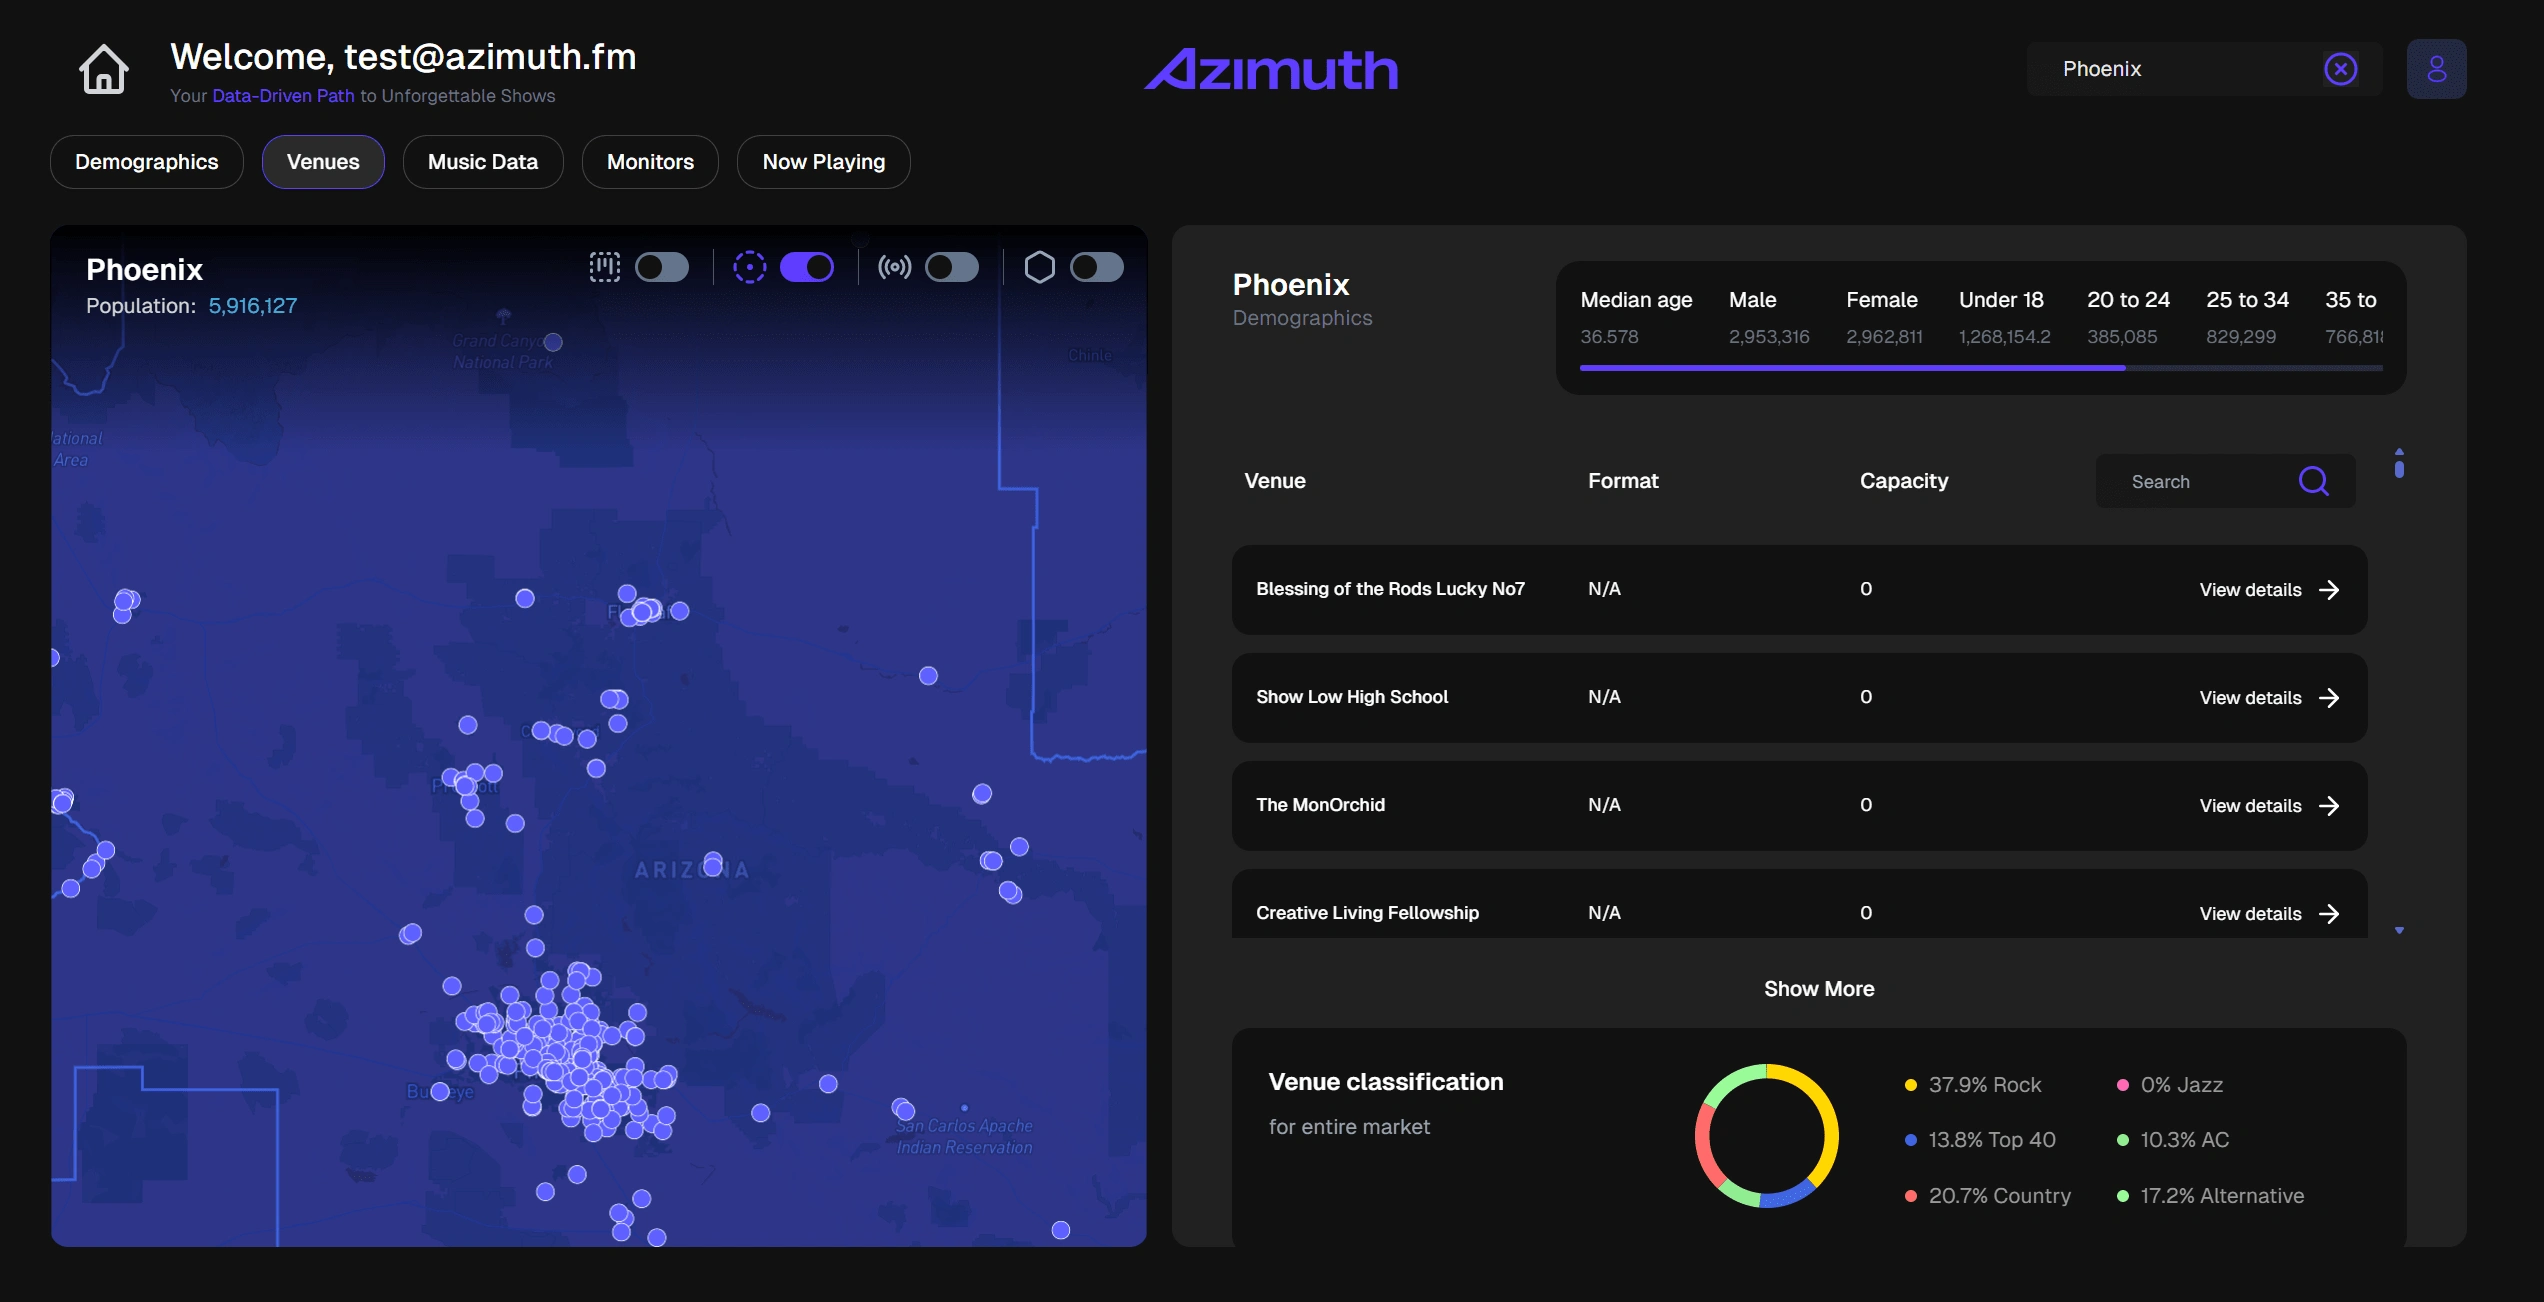
Interactive US Map with DMA Segmentation: Users can zoom into Designated Market Areas and assess concert viability based on region-specific data.
© 2025 Azimuth. All rights reserved.
AI-Driven Touring Route Visualizations: Custom algorithms help generate the most efficient routes based on audience data, availability, and artist preferences.
Custom Cluster Map Visualization Implementation
© 2025 Azimuth. All rights reserved.
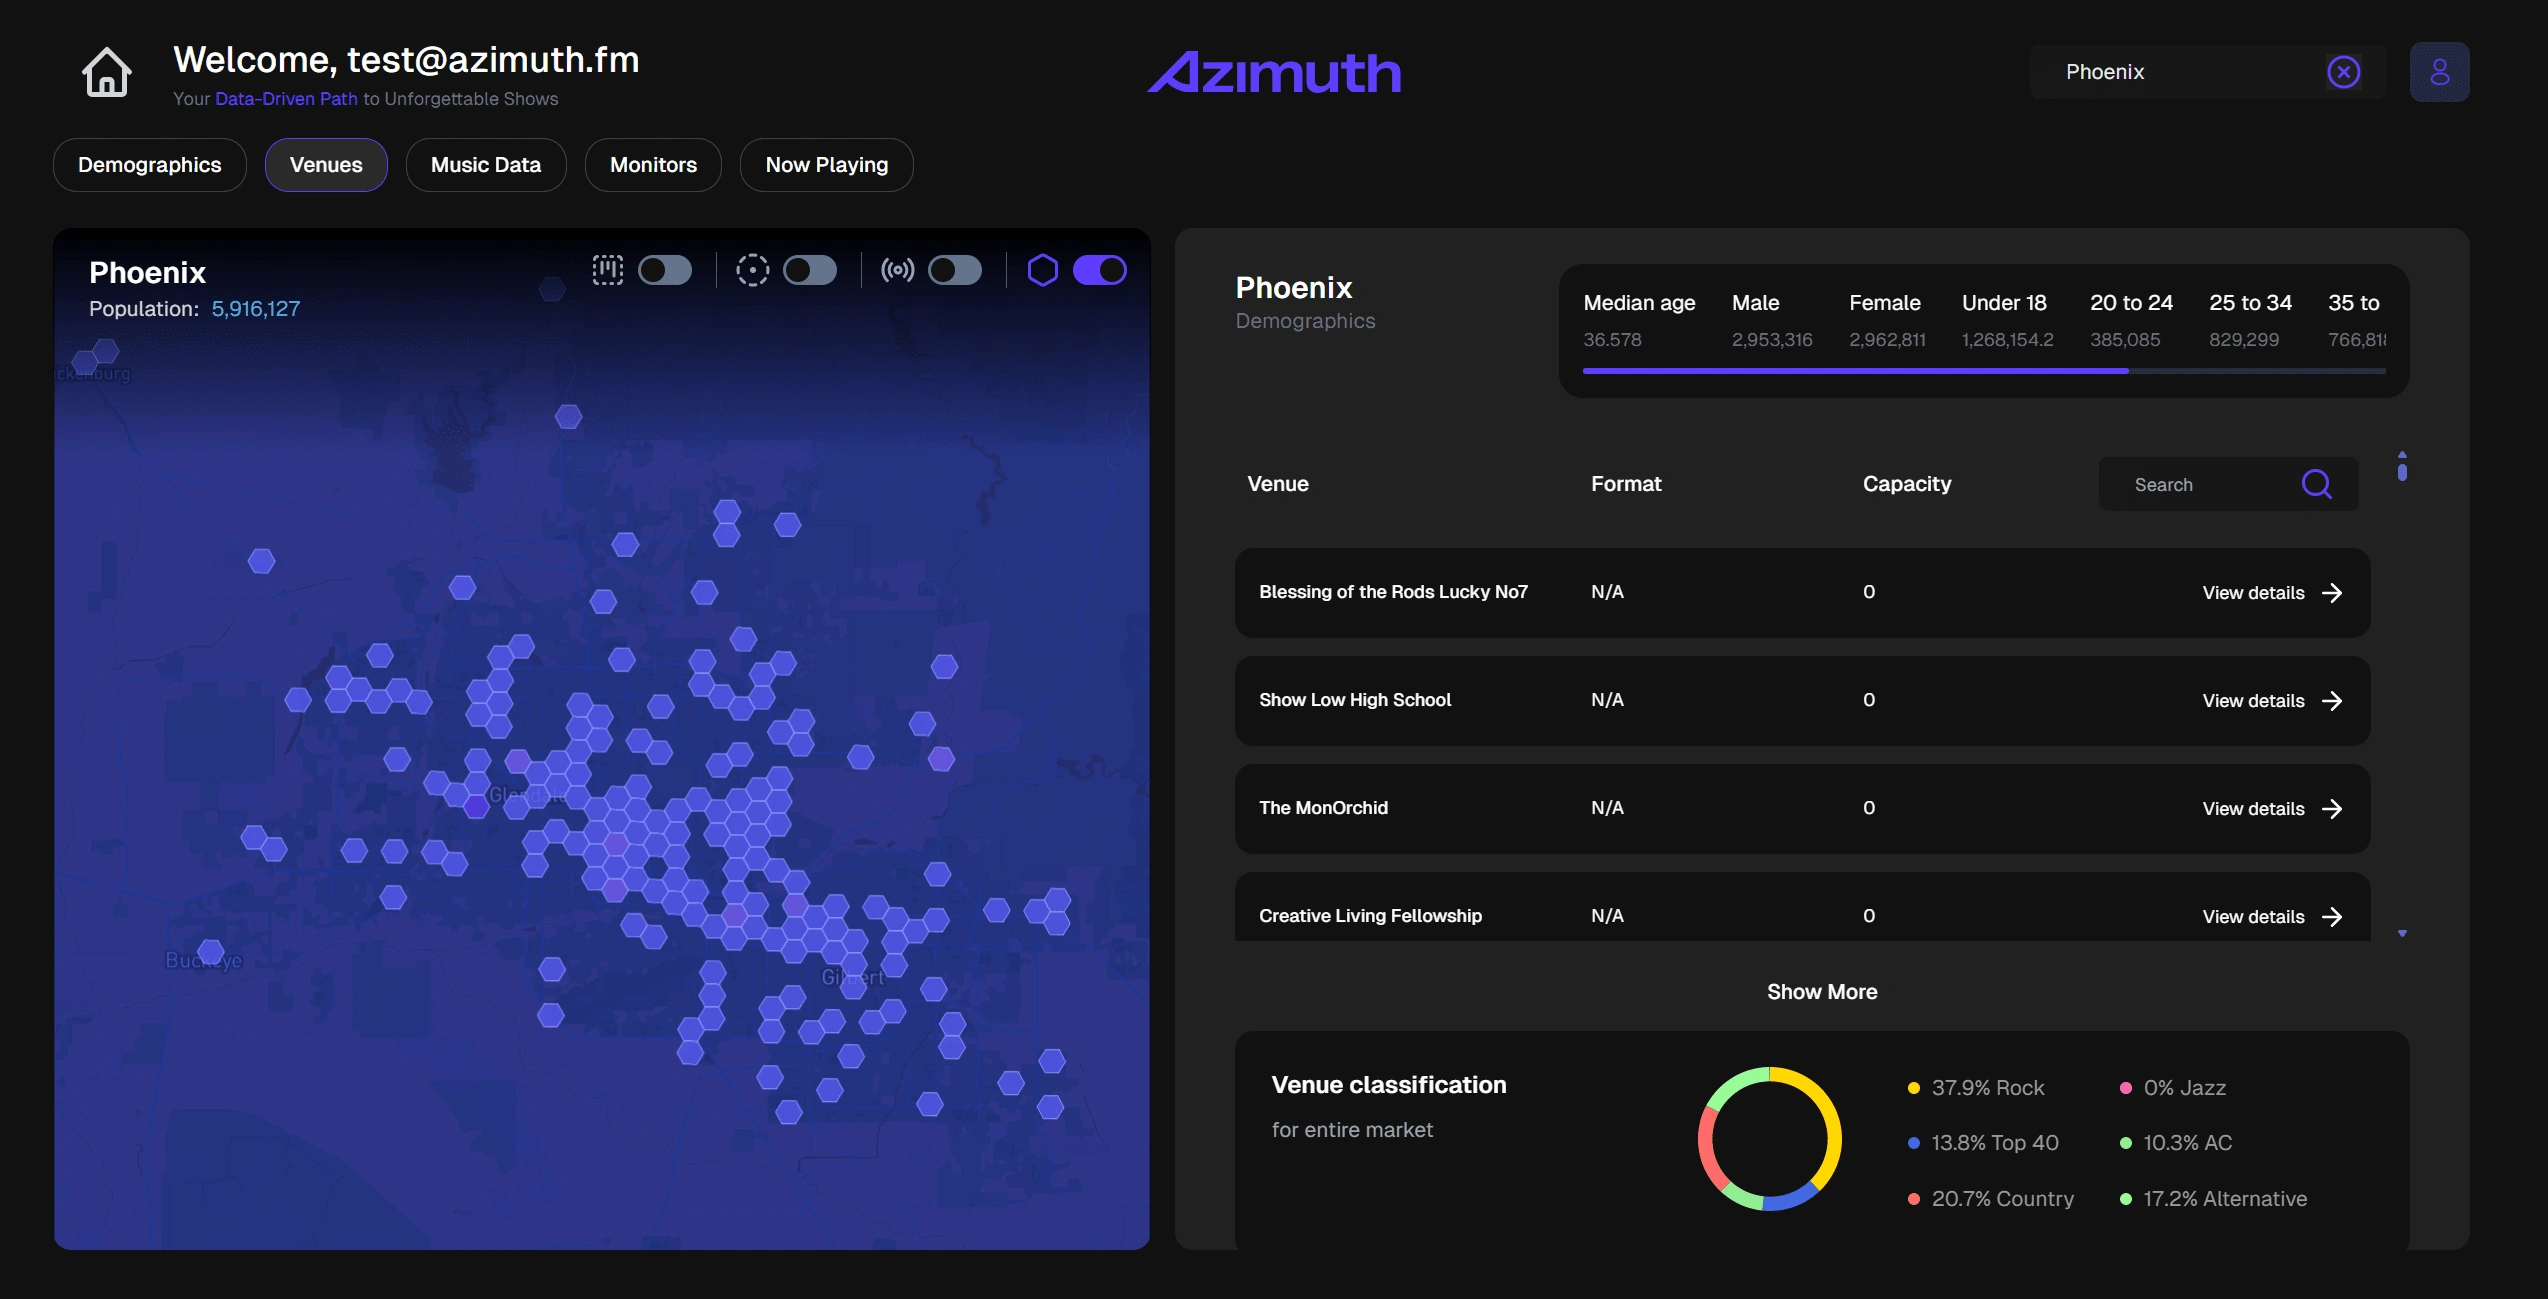
HexBin based Data Visualization
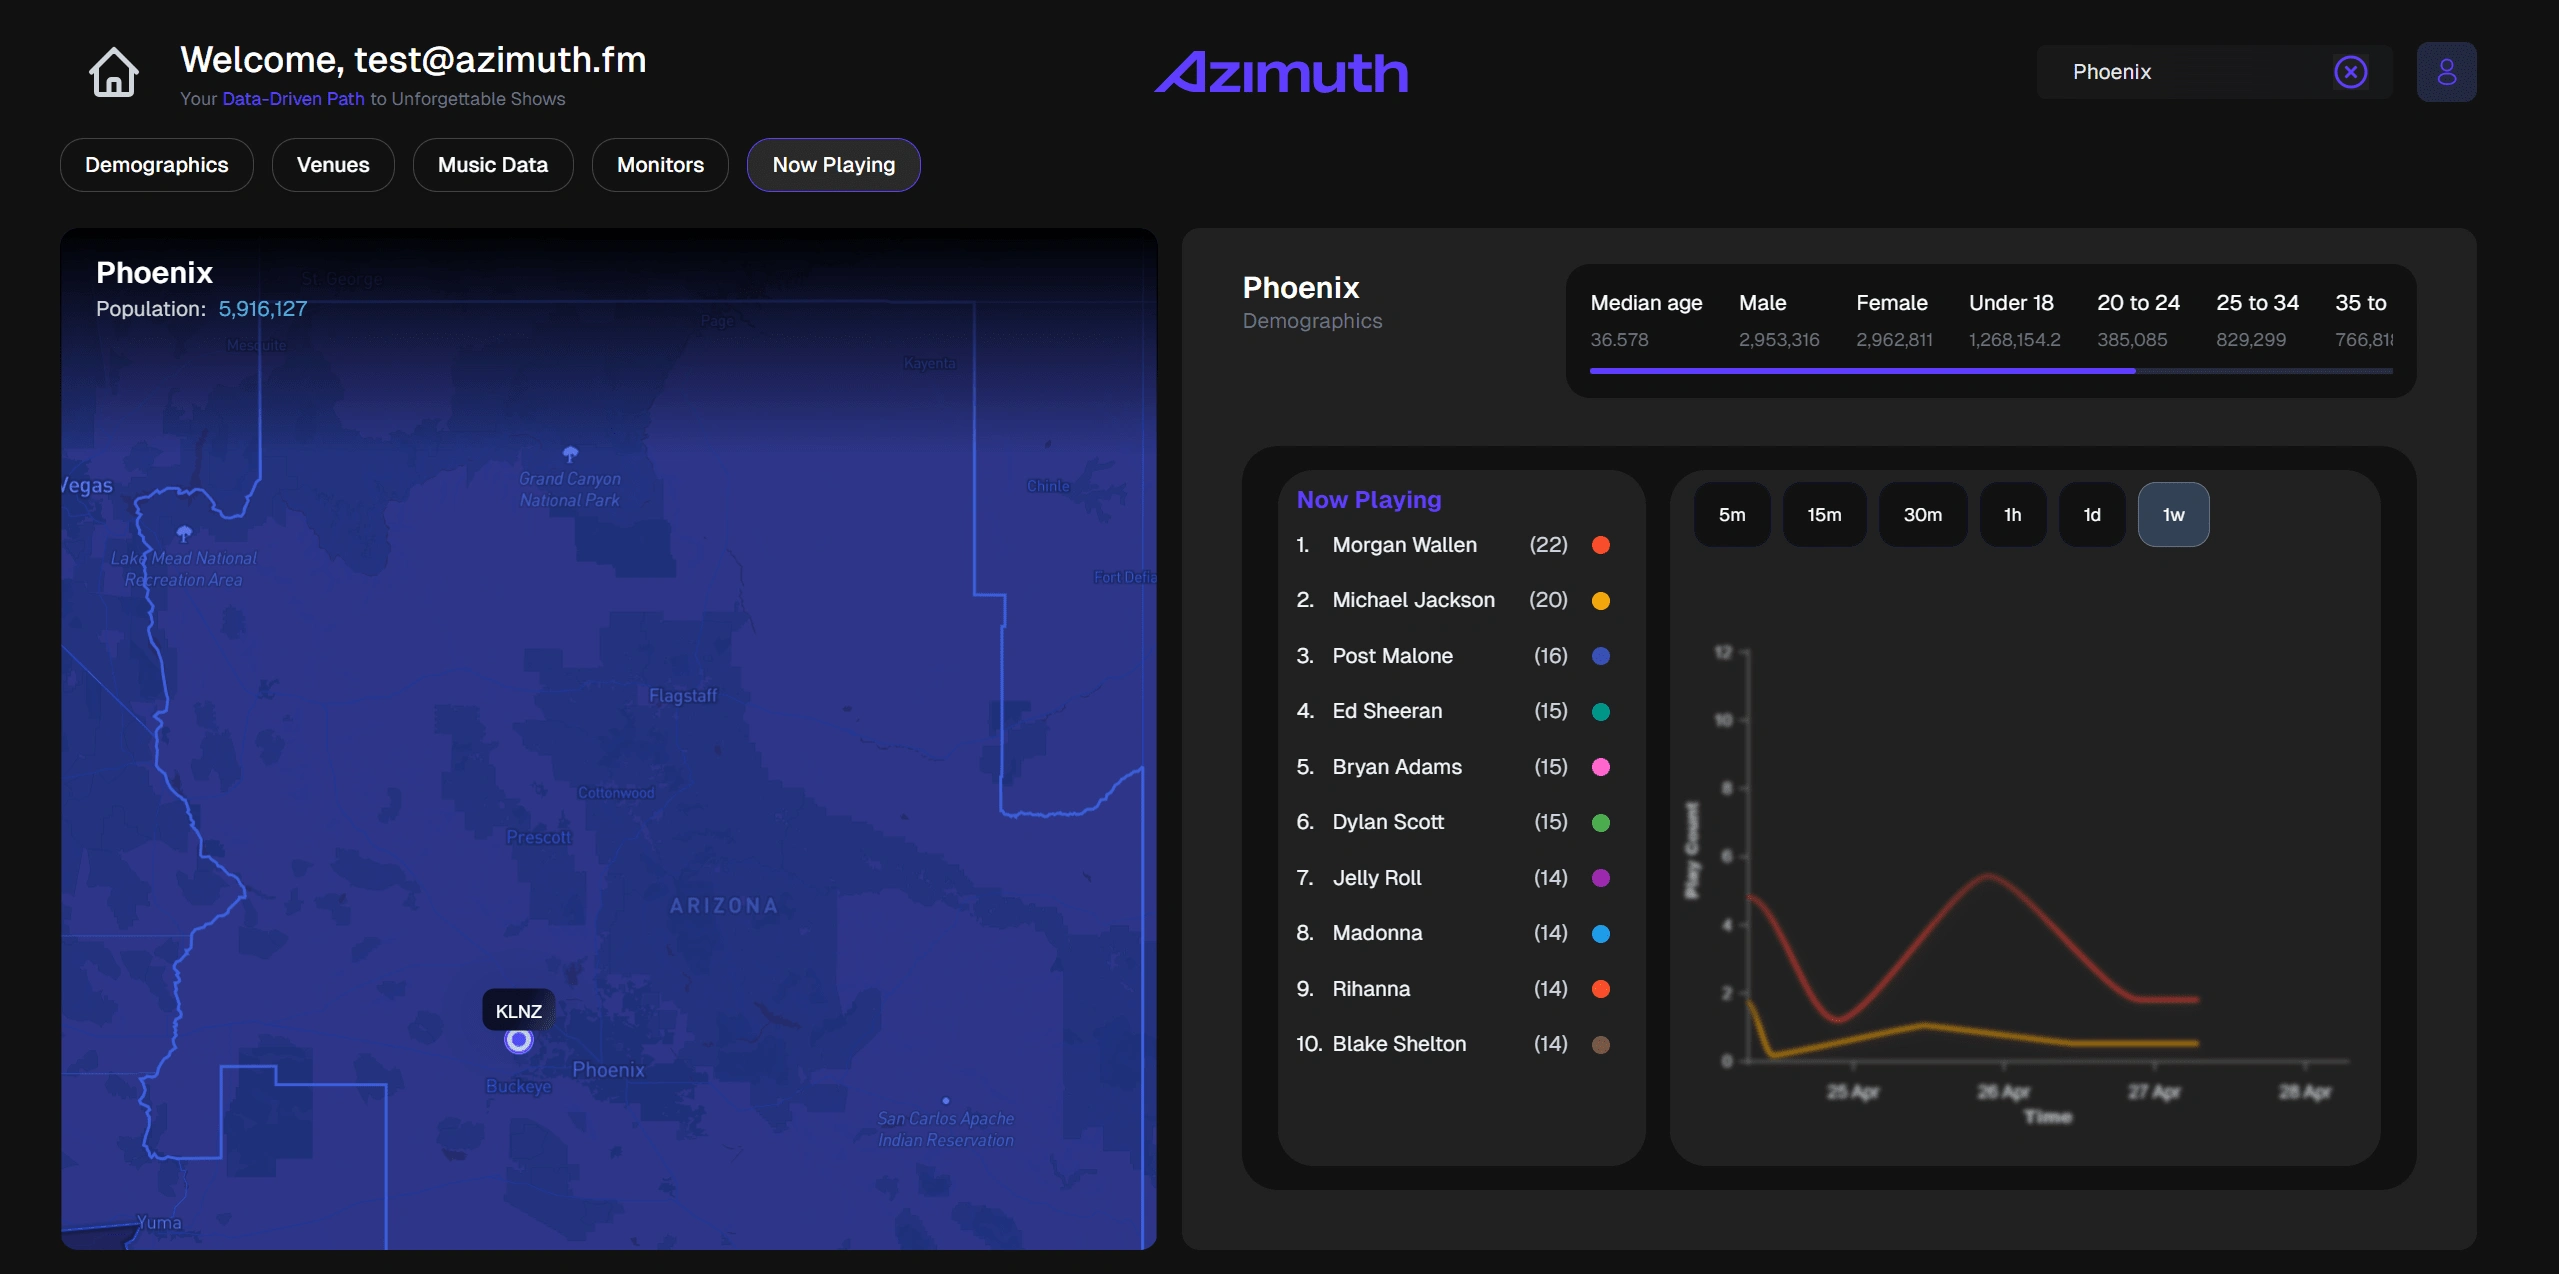
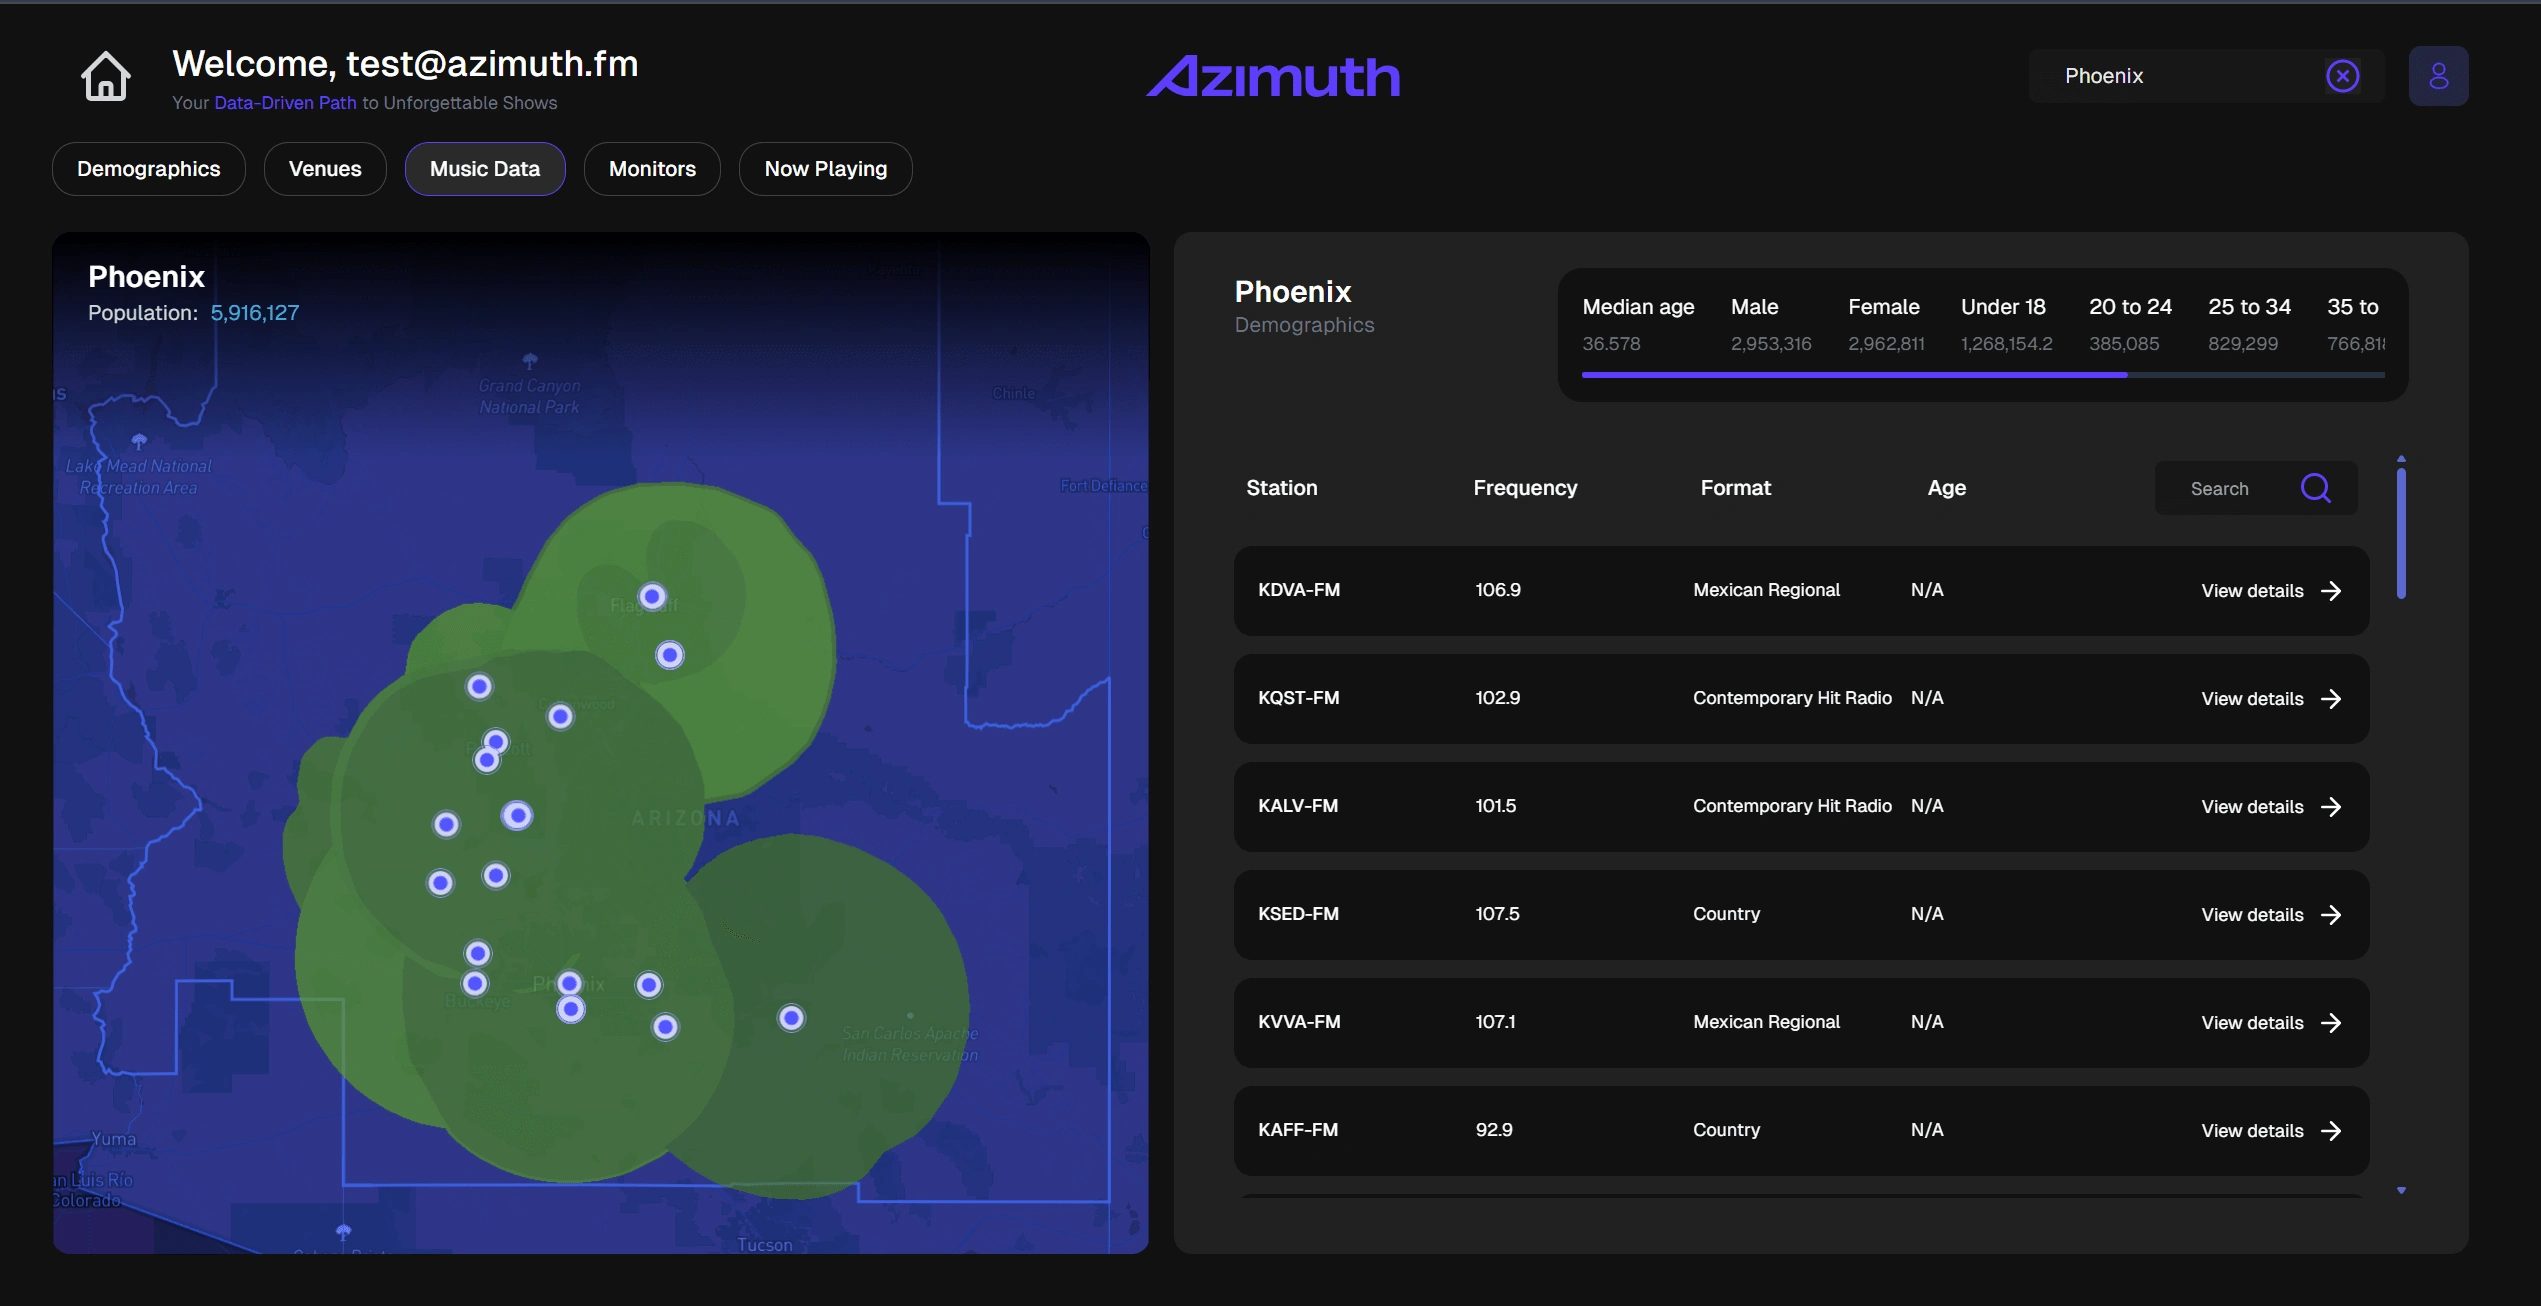
Live Map Events & Audio Streaming Integration: Real-time feedback shows where concerts and radio events are live, giving immediate context to route decisions.
© 2025 Azimuth. All rights reserved.
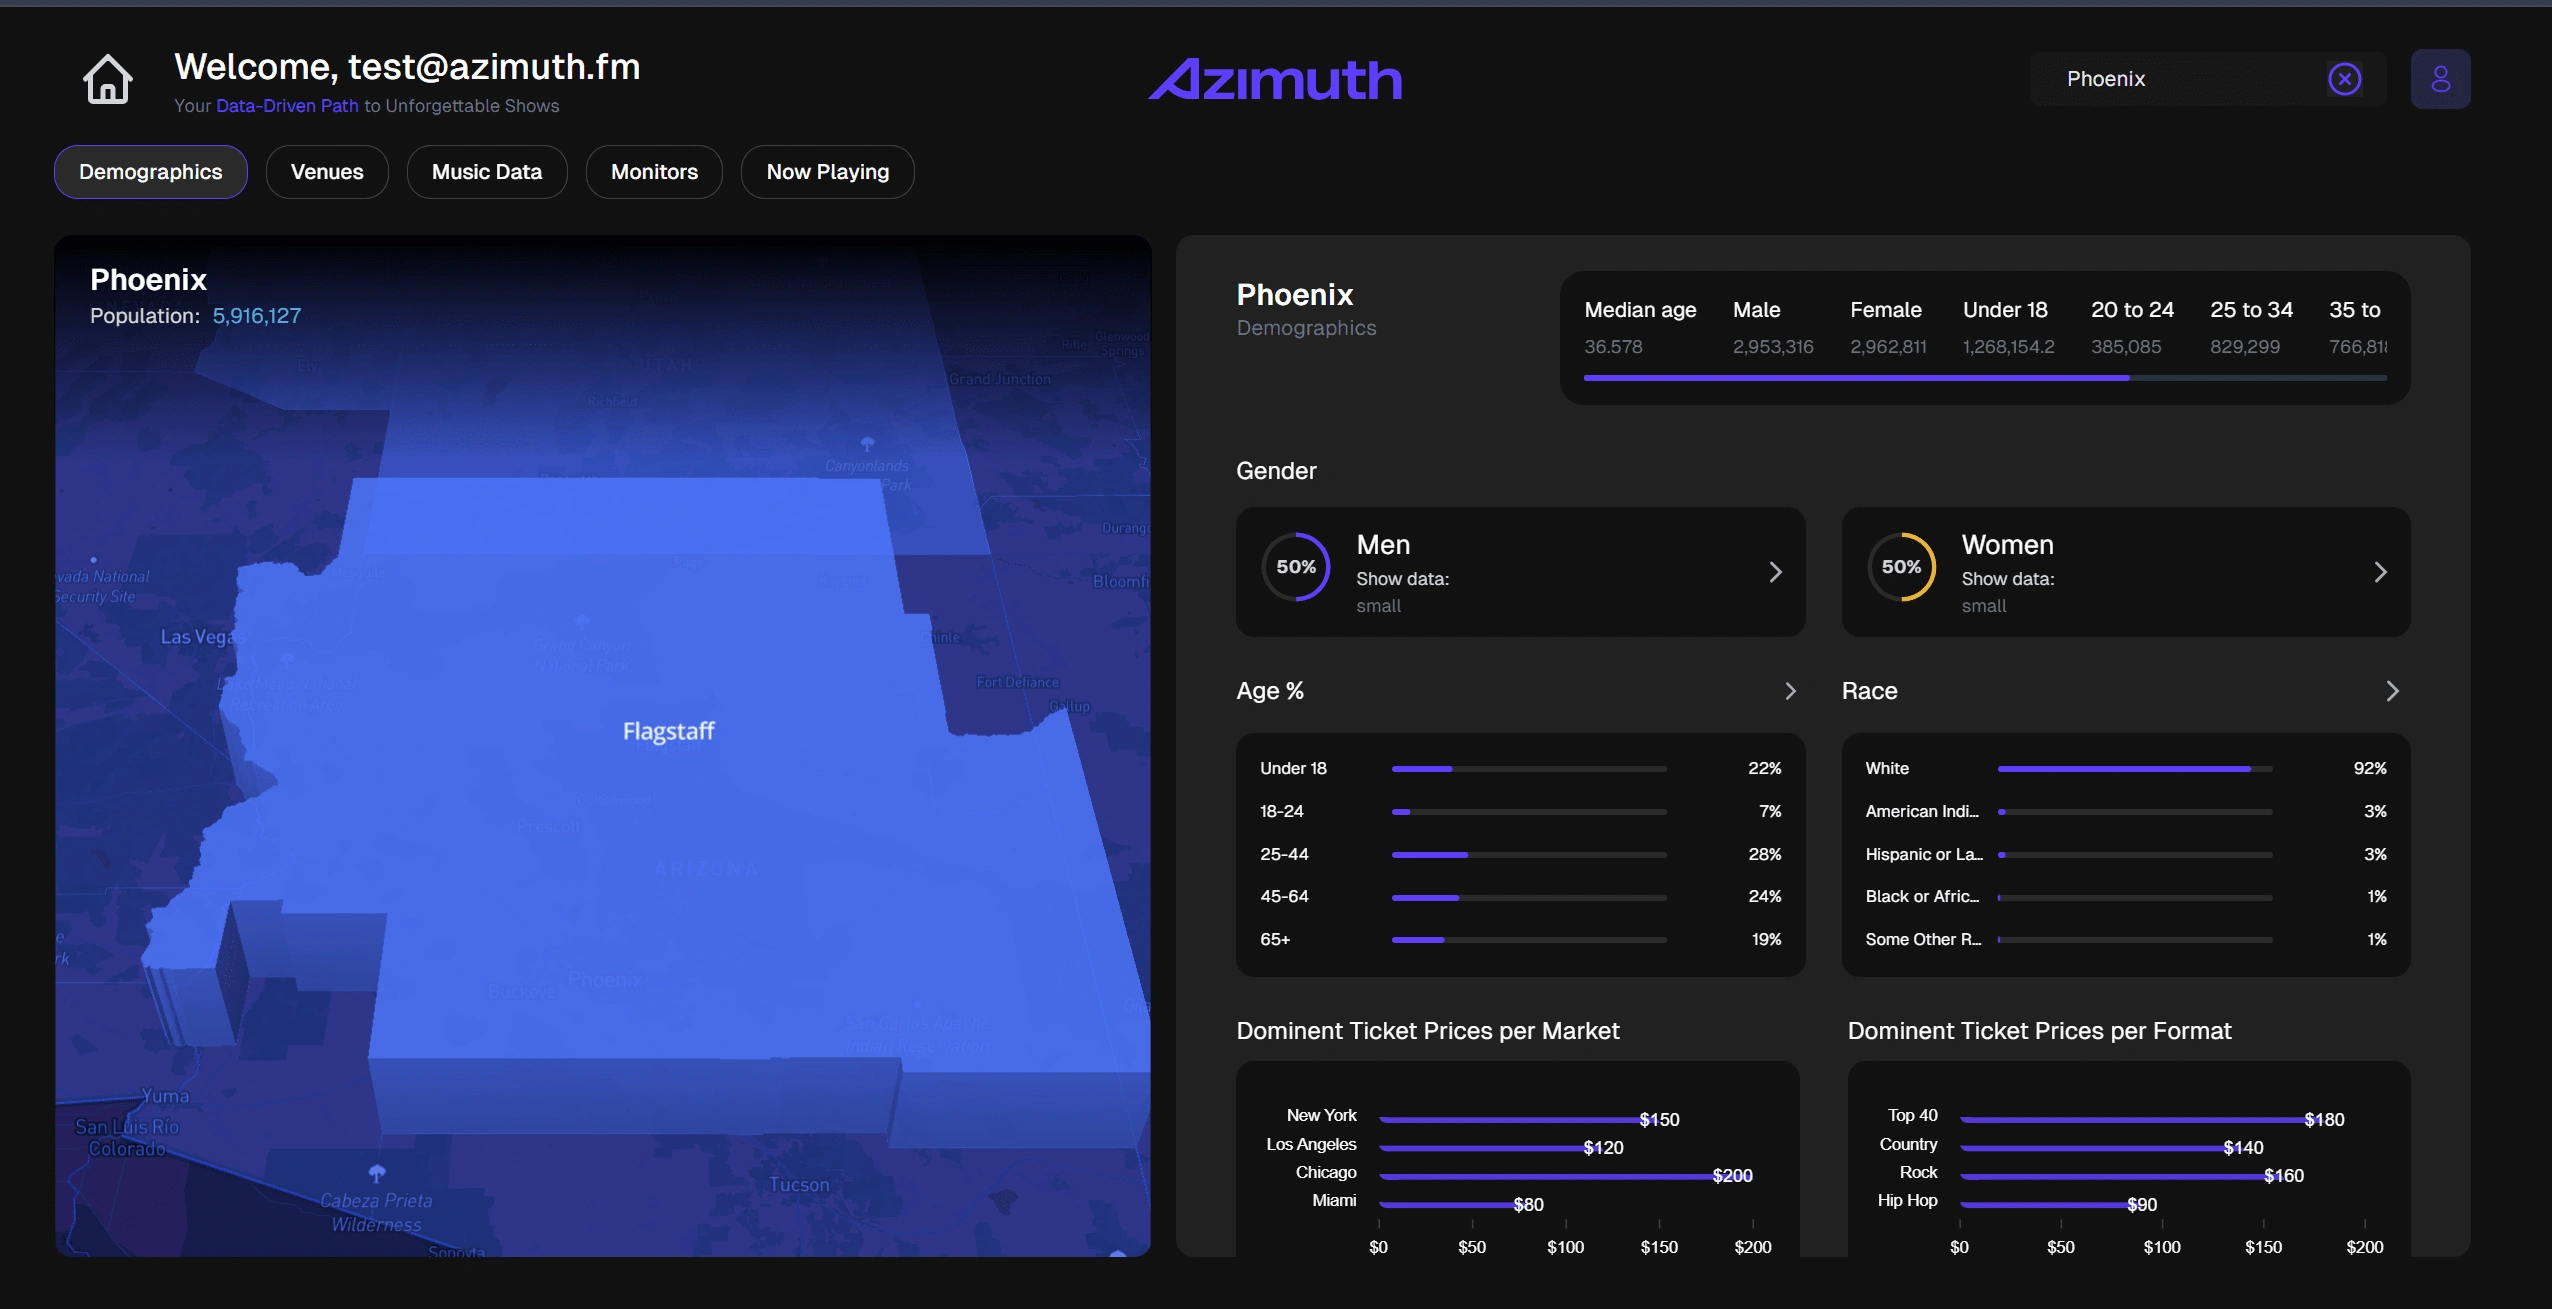
Real-Time Graphs & Dashboards: Insight-rich visuals on audience engagement, ticket trends, and tour performance.
Responsive & High-Performance UI: Optimized for performance across all devices with smooth transitions and fast load times.
© 2025 Azimuth. All rights reserved.
Engaging Animations & Visual Storytelling: Every user interaction is paired with fluid animations that enhance understanding and usability
© 2025 Azimuth. All rights reserved.
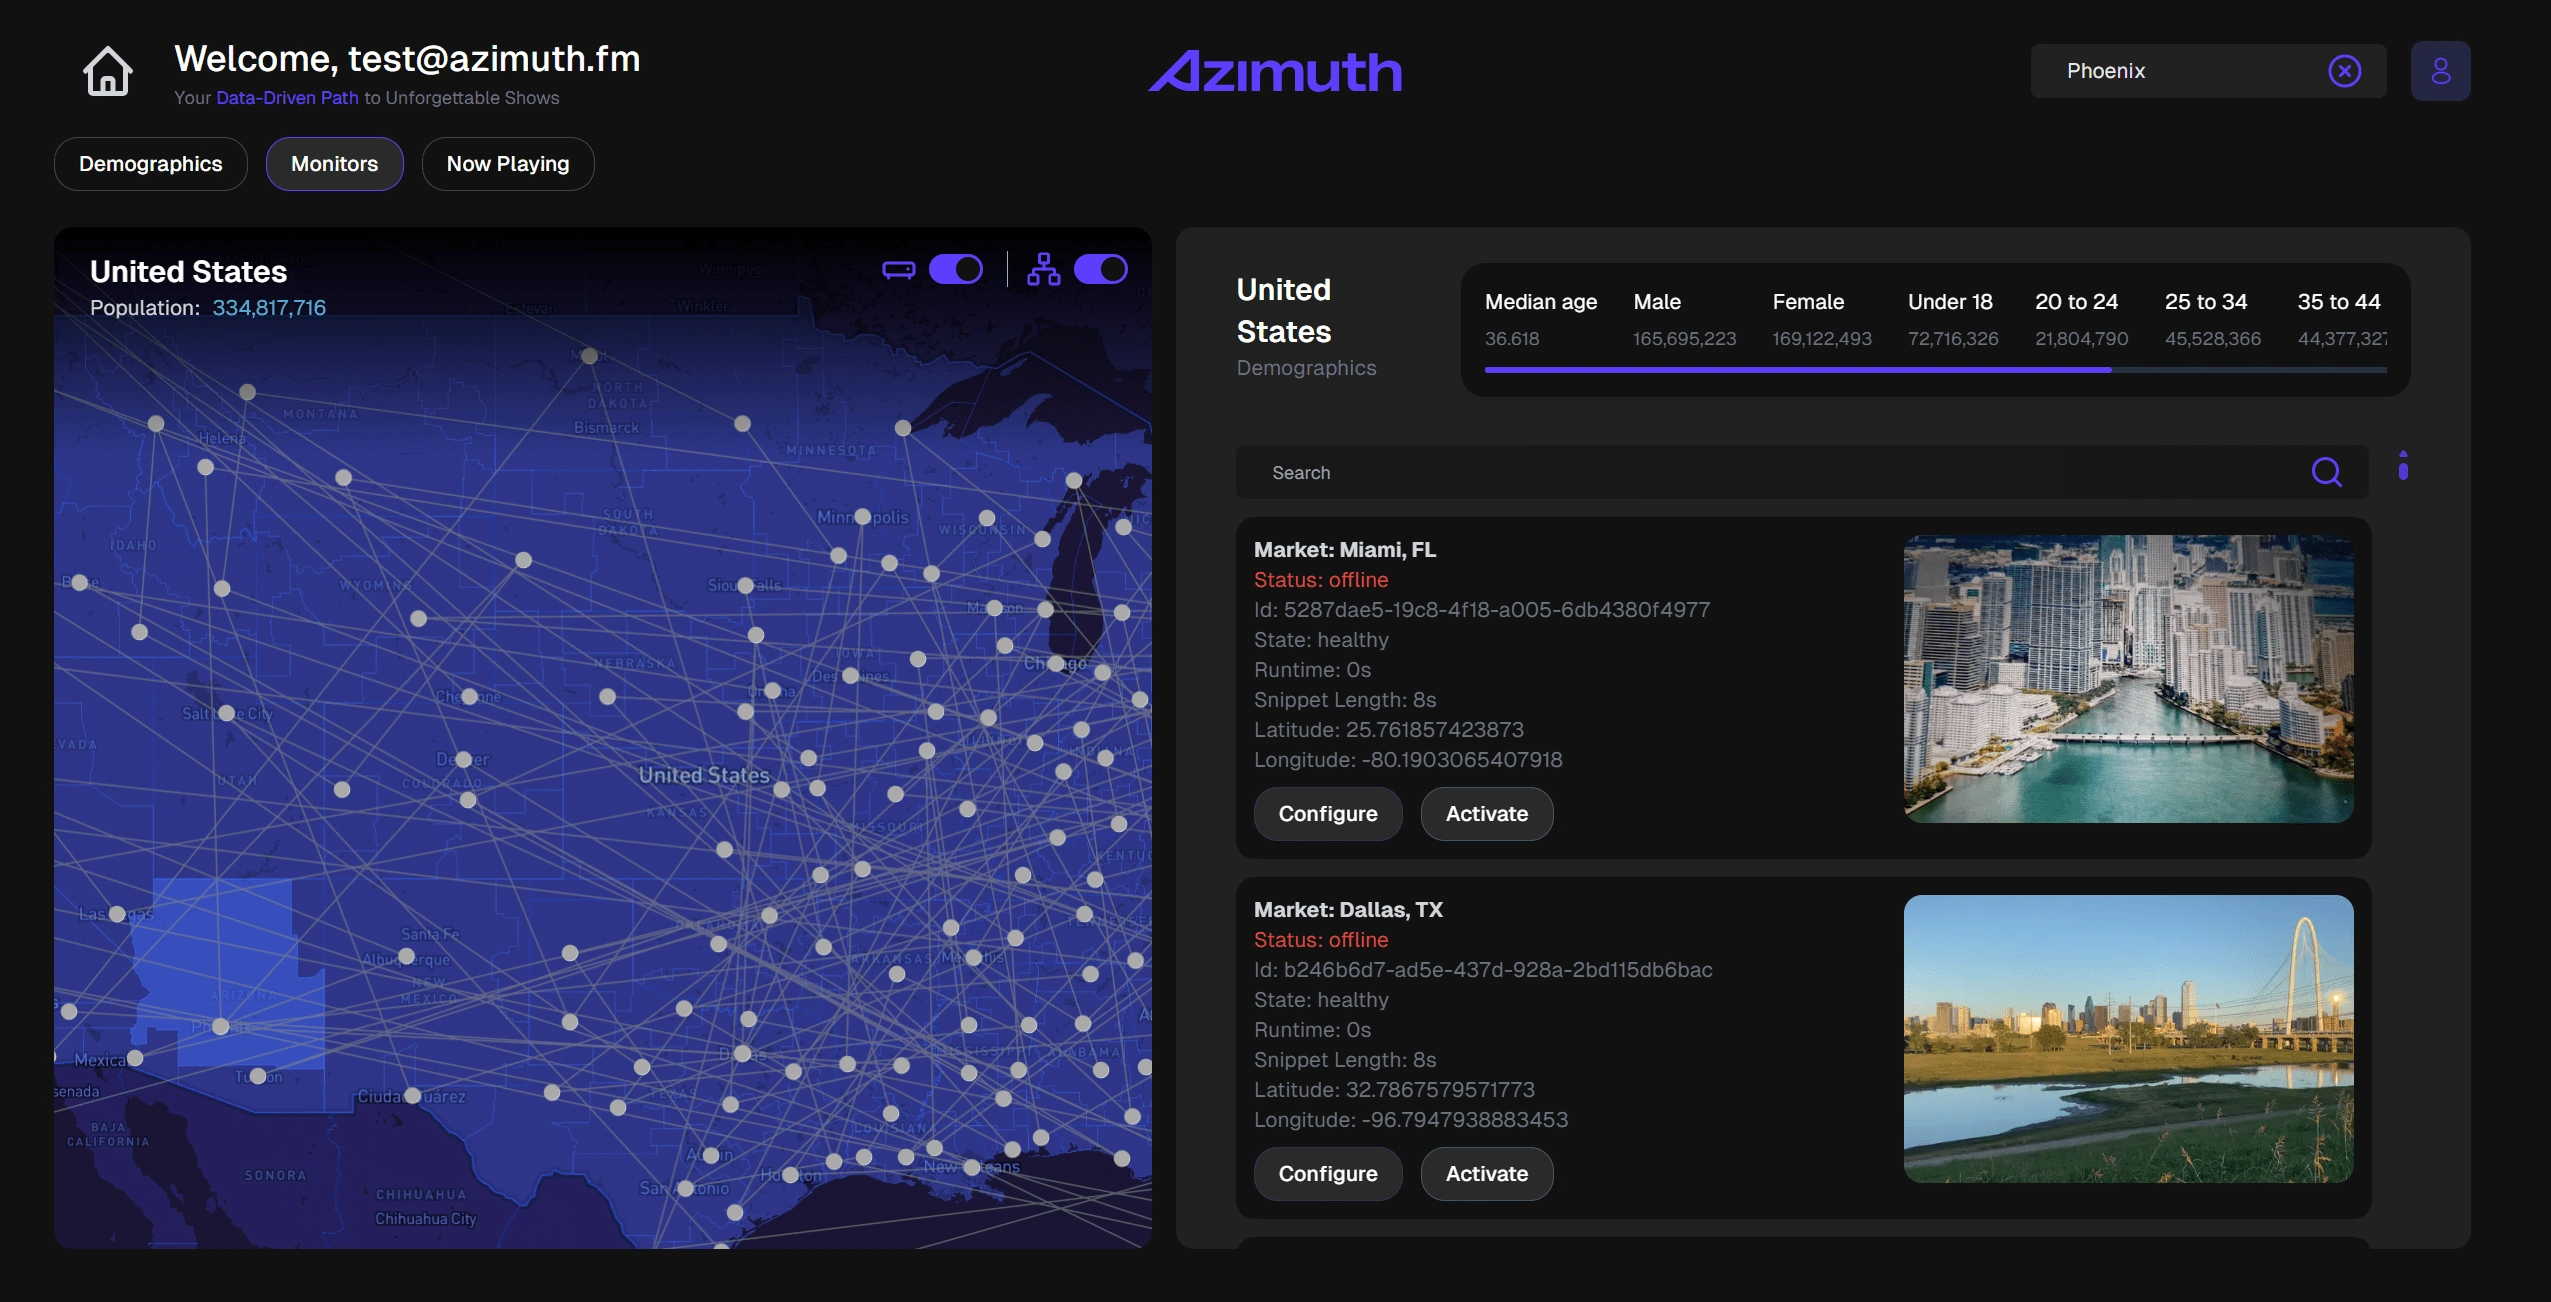
Coverage Maps Visualization Implementation
⚙️ Tech Stack & Implementation
To bring this vision to life, I used a powerful tech stack designed for speed, scalability, and flexibility:
Next.js – For high-performance server-side rendering and routing.
Redux – To manage the state of complex UI interactions efficiently.
Mapbox – For advanced mapping, location data rendering, and geospatial interactions.
D3.js – To create animated and interactive data visualizations.
Supabase – Real-time backend and database solution with instant data syncing.
Lodash – For optimized data manipulation and logic handling.
Custom Animations – Built from scratch to deliver rich, cinematic transitions and storytelling.
AWS EC2 Machine - For deployment used Nginx revese proxy with AWS EC2 machines for running backend proxies and next.js application.
🔄 Current Status & What’s Next
AzimuthLive is currently in active development, with exciting updates in the pipeline:
A Smart Analytics Dashboard with deeper insights into ticket sales, fan demographics, and tour logistics.
More AI-enhanced tools for route recommendations and venue performance prediction.
A potential mobile-first companion app for tour managers on the go.
✅ Why Hire Me?
If you're looking to build an interactive, data-rich product that demands both technical precision and creative finesse—I can help bring your vision to life.
With extensive experience in Next.js, React, Mapbox, D3.js, Supabase, and scalable systems, I don’t just write code—I craft digital experiences that are intuitive, impactful, and performance-driven.
📩 Let’s Build Something Bold Together
Whether you're launching a data-powered SaaS product, need help building real-time dashboards, or want to turn complex ideas into beautiful UIs—I’d love to help.
👉 Hire me on Contra to bring your next project to life with confidence and creativity.
Wanna connect?
Like this project
What the client had to say
Still working with Danyial, and will continue to work with him, he is a front end monster, put it in front of him and he will figure it out and deliver EVERY TIME!
Barry Griffin, Azimuth
Dec 5, 2024, Client
Posted Feb 23, 2025
AzimuthLive is a desktop web platform that uses real-time data, maps, and analytics to optimize concert tour routing across the US.
Likes
10
Views
343
Timeline
Nov 25, 2024 - Dec 5, 2024
Clients
Azimuth