Azimuth Dashboard
Daniel Afaqi
Verified

Company: Azimuth
Website: https://azimuthlive.ai/
Company Overview
Azimuth is a data infrastructure and analytics company dedicated to making music data more affordable and accessible to everyone.
Project Title
Interactive Concert Touring Data Visualization with D3.js and Mapbox
Project Overview
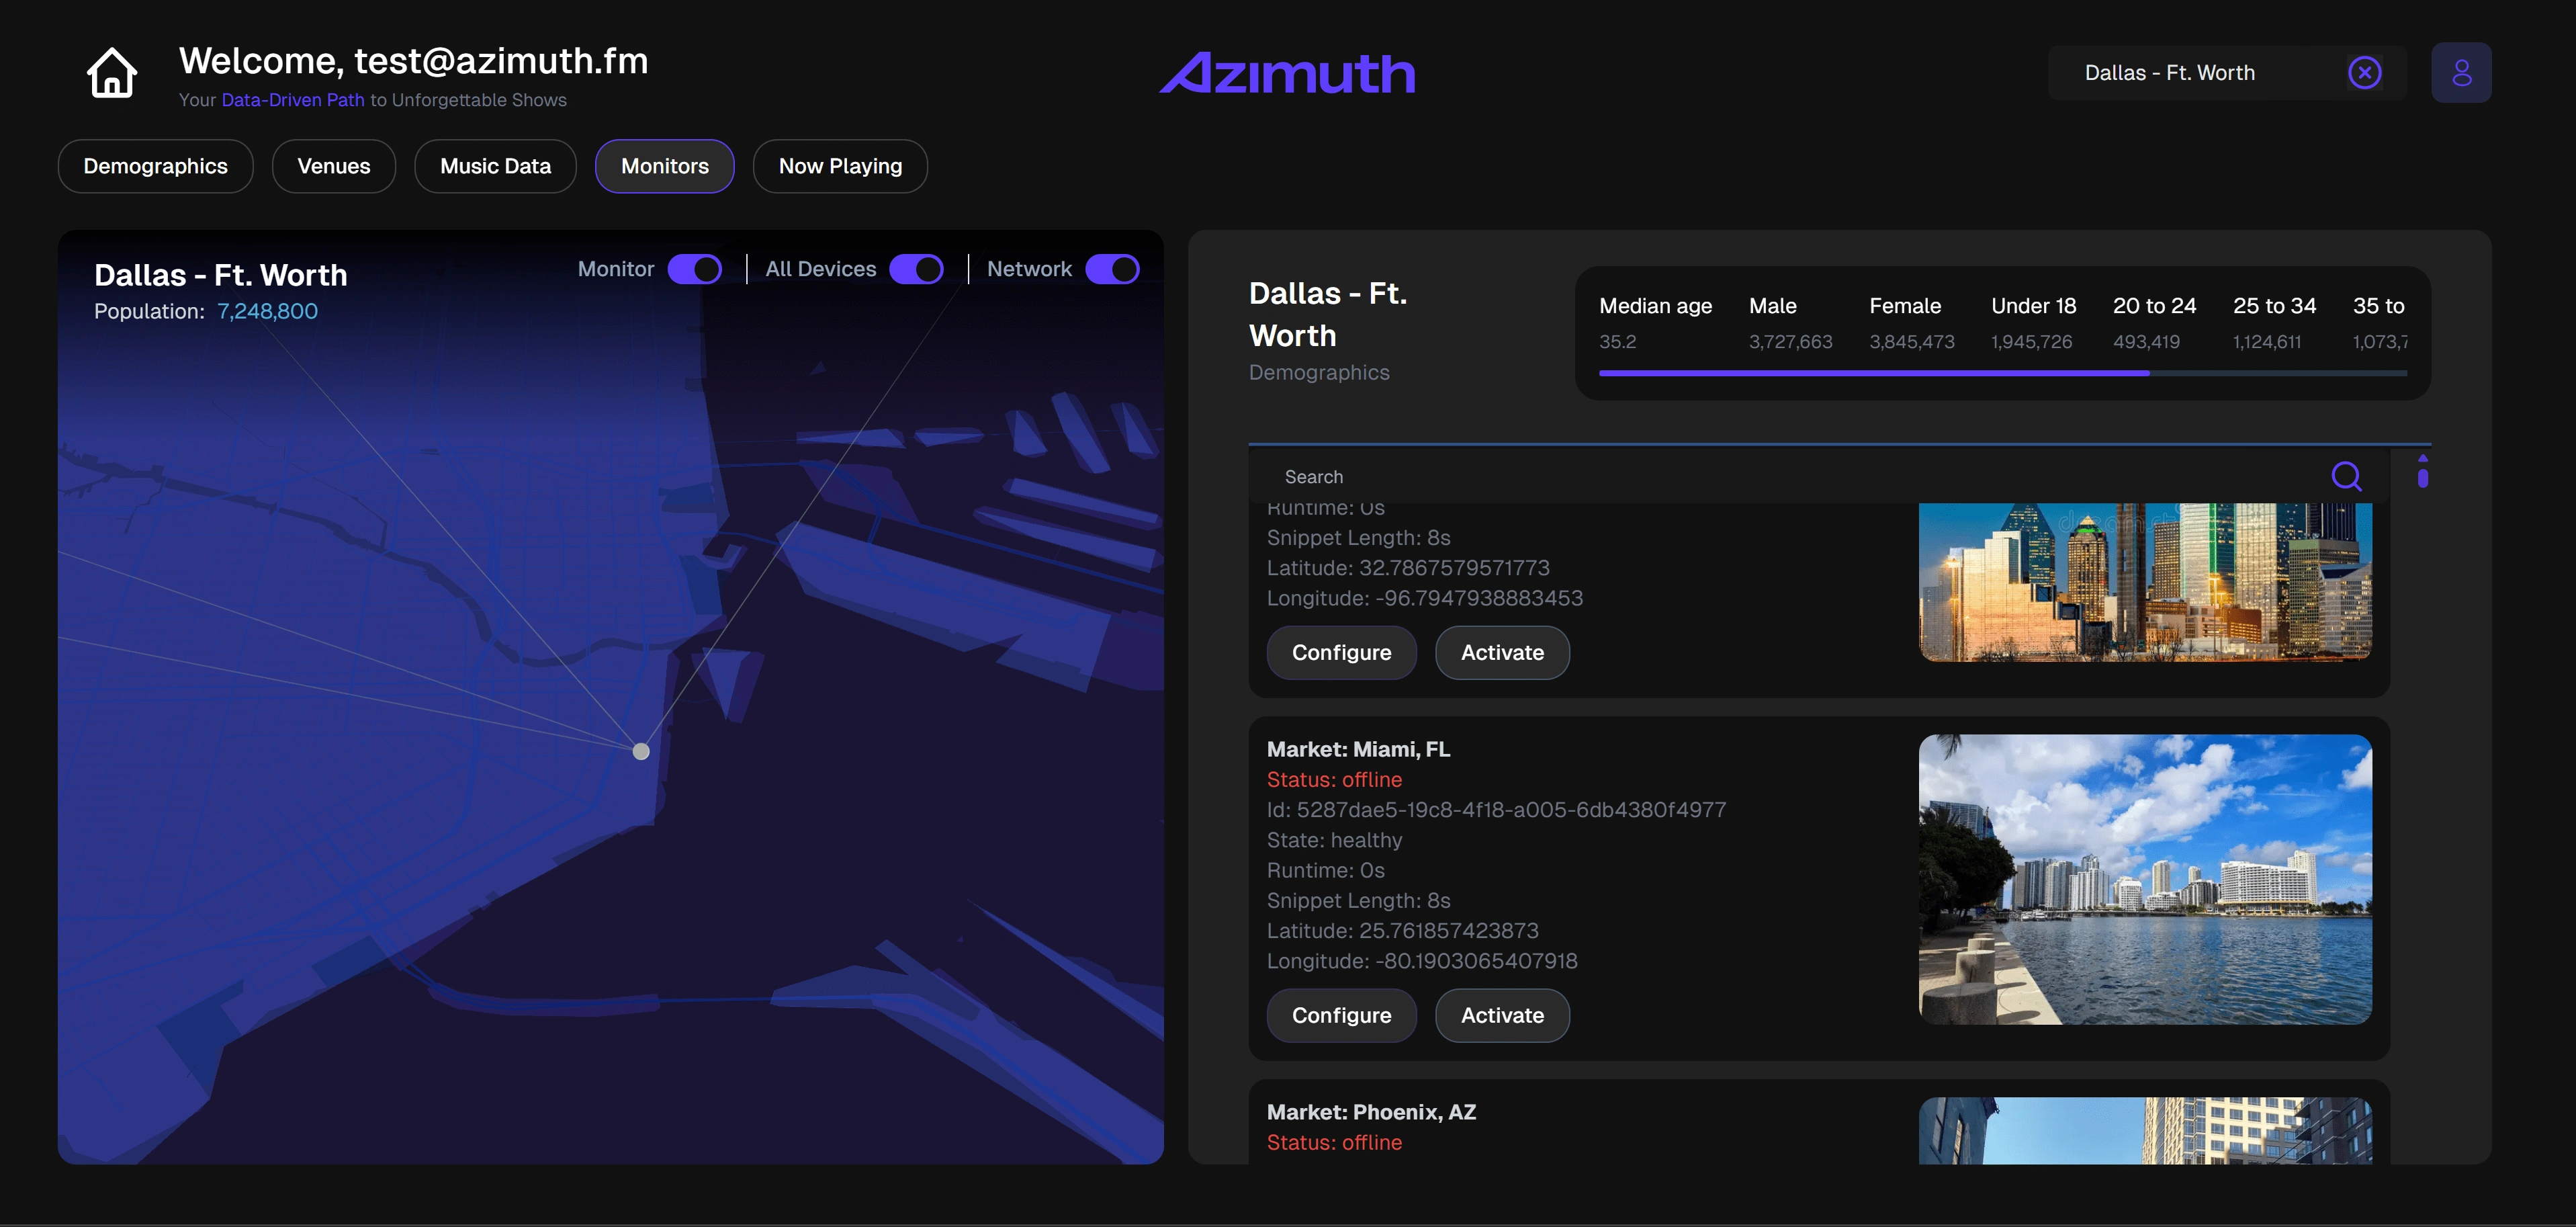
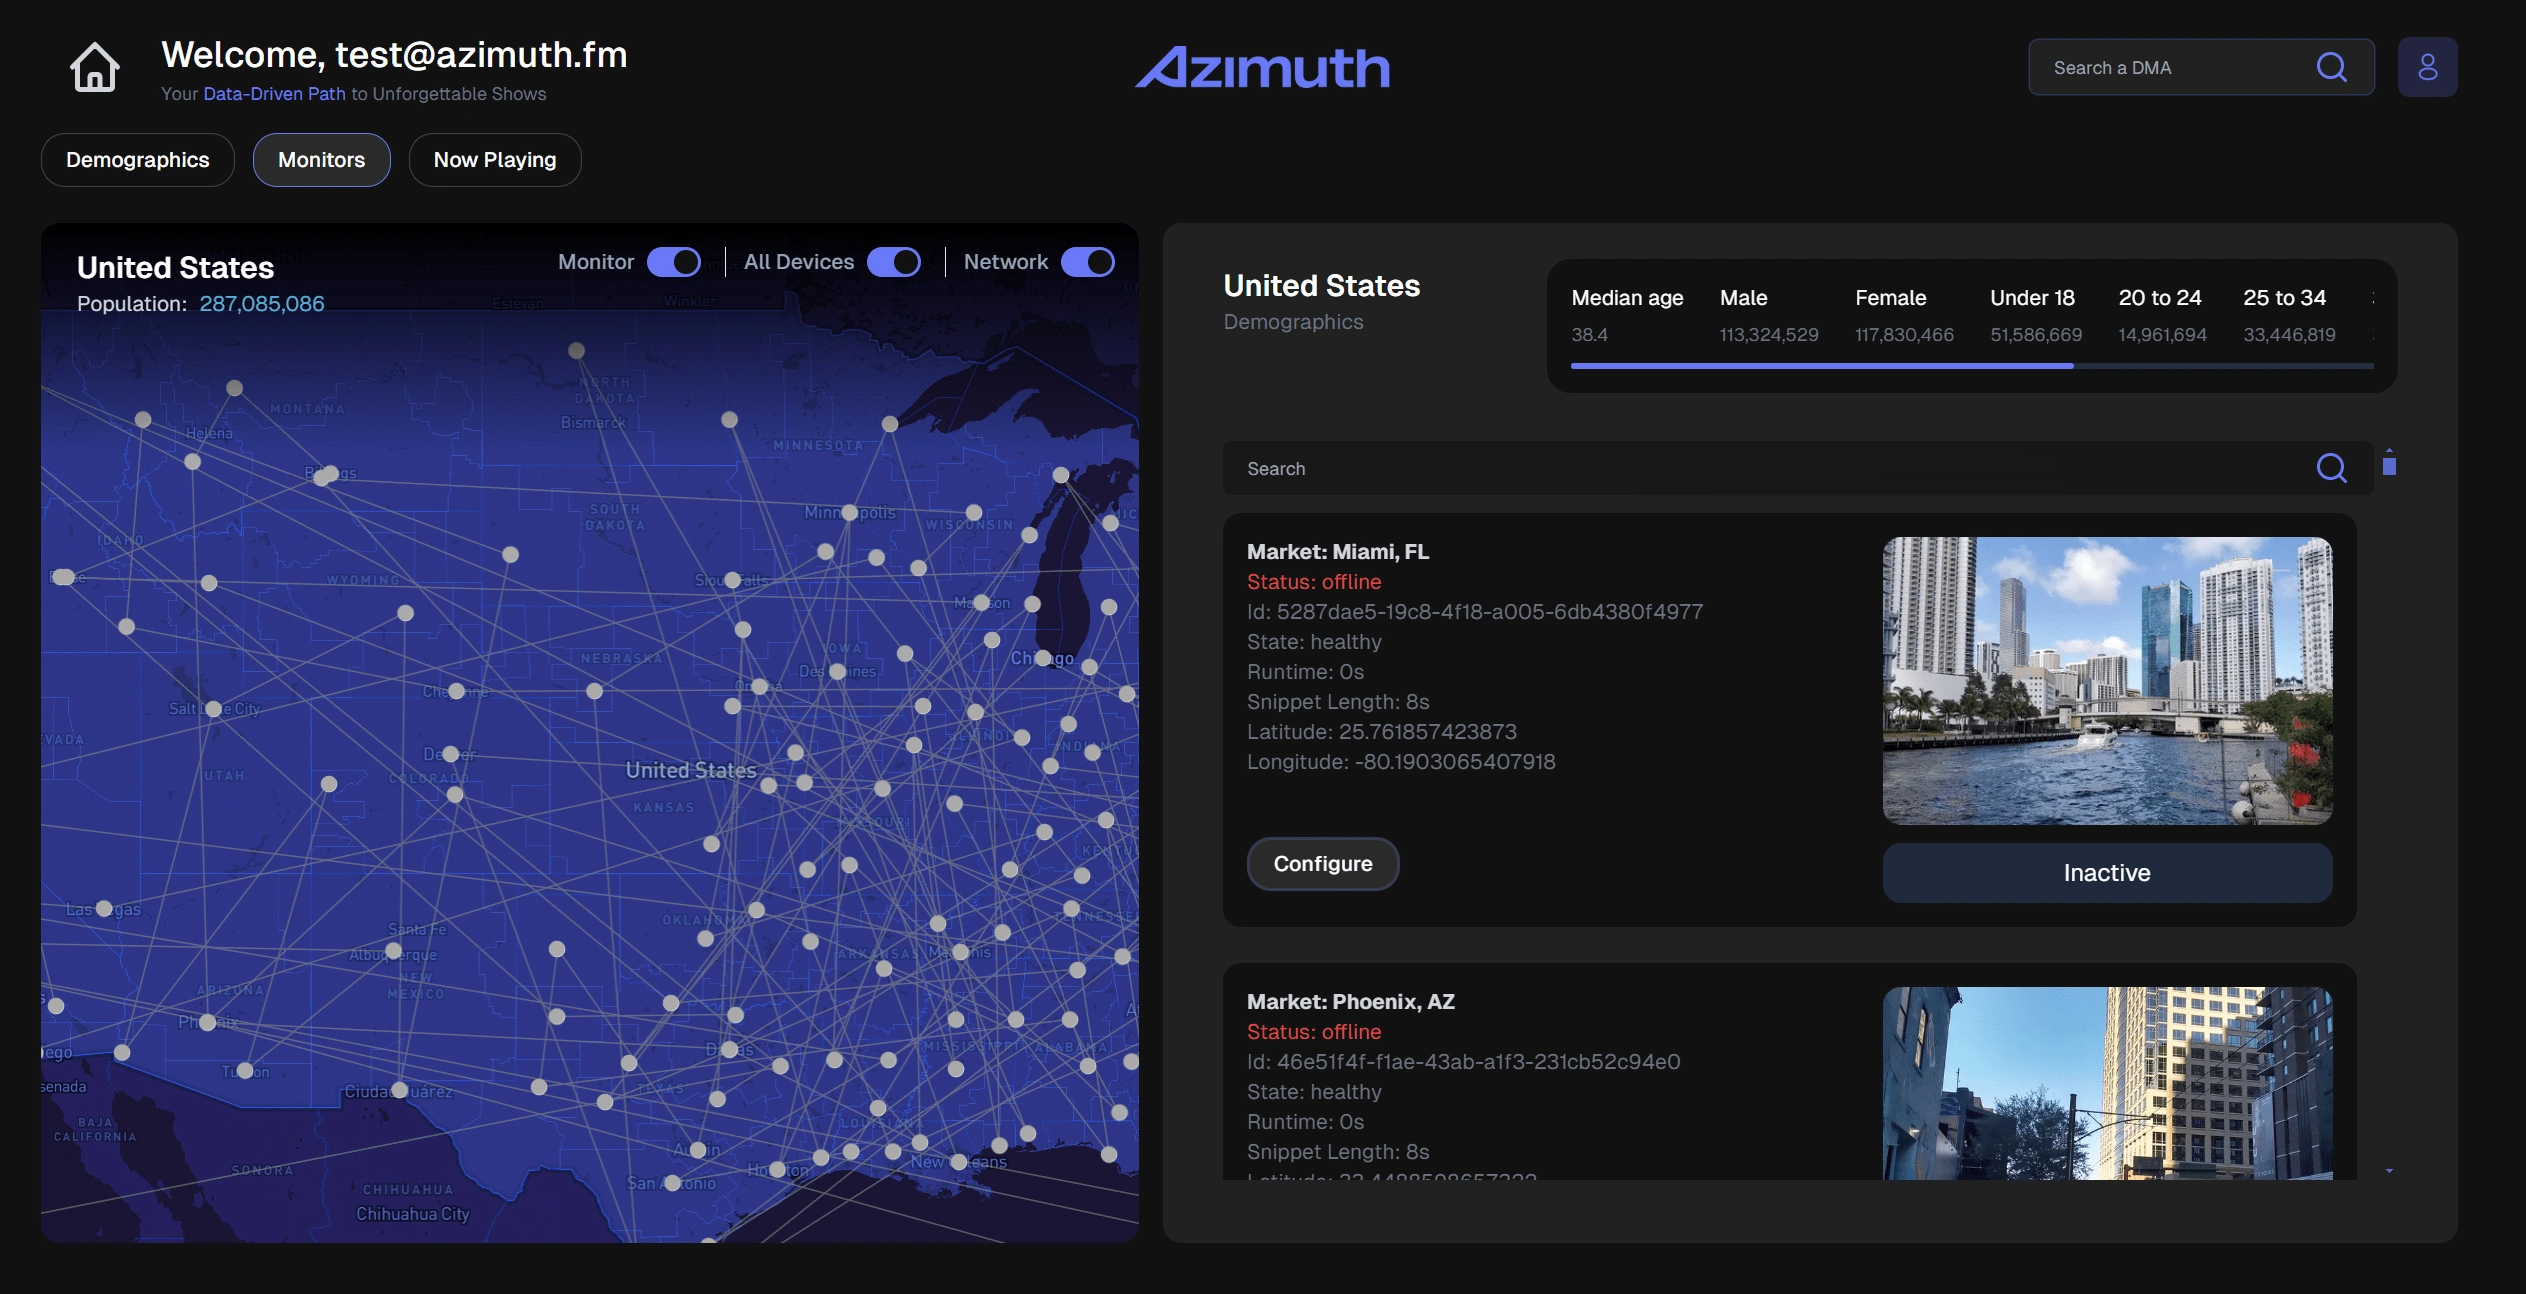
This project involves building an interactive UI to showcase Azimuth’s concert touring data visualization system. Using finalized Figma designs, the goal is to develop a responsive, animation-rich interface centered on a U.S. map and Designated Market Areas (DMAs). The UI will feature data-driven visualizations, dynamic animations, and interactive elements to enhance user engagement.
Key technologies include D3.js, Mapbox, and modern front-end frameworks, with a focus on performance optimization to ensure smooth, real-time interactions. This project is ideal for developers who are passionate about bringing complex data to life through engaging UI/UX design.
Challenges
Developing a Mapbox-powered dashboard with 3D animations using D3.js, Three.js, and real-time event-driven animations.
Processing and visualizing geospatial and music data dynamically.
Solutions Implemented
✅ Advanced Geospatial Music Data Visualization – Utilized D3.js, Three.js, and Mapbox to create complex animations and interactive visual elements.
✅ Persistent Map Data with Redux – Integrated Redux and Redux Toolkit for efficient state management and data persistence.
✅ Real-time Mapbox Animations – Implemented animations that respond dynamically to live concert venue data and real-time interactive graphs.
✅ 3D Text & Model-Based Rendering – Designed interactive 3D models for visualizing various Designated Market Areas (DMAs).
Results
🚀 Interactive Data Transformation – Converted raw geospatial and music data into engaging, easy-to-understand insights.
⚡ Optimized Performance – Ensured smooth animations and real-time updates for an immersive user experience.
📡 Seamless Real-time Data Sync – Integrated live event data to dynamically update concert venue activities and audience metrics.
🎯 Enhanced User Interaction – Developed an intuitive UI/UX that enables users to explore and analyze DMAs with interactive controls.
🔧 Scalable & Maintainable Codebase – Used Redux Toolkit for efficient state management, ensuring long-term maintainability.
✅ Stakeholder Satisfaction – Delivered a production-ready solution that met Azimuth’s requirements, showcasing the power of D3.js, Mapbox, and Three.js for advanced data visualization.
This project highlights the potential of data-driven web applications to transform complex datasets into visually compelling, interactive experiences. 🚀
Like this project
What the client had to say
Rock star!!
Barry Griffin, Azimuth
Mar 27, 2025, Client
Posted Mar 28, 2025
3D data visualization of music, artist and radio data across US. Built realtime map events on top of 3D layers & objects and realtime graphs.
Likes
0
Views
14
Timeline
Feb 24, 2025 - Mar 27, 2025
Clients
Azimuth