
Olusegun Daniel
Data Analyst | Data Coach | Academic Researcher | Automation
Profile in progress
Olusegun is building their profile!


Learning no-code automation to work smarter and deliver faster results for my clients
Starting this week with growth in mind. I’ve begun a new course on No-Code Automation with Beyond Age Tech Academy.
As a data analyst, I’m learning how to simplify complex workflows, automate repetitive tasks, and deliver faster results for my clients. This skill will help me create smoother, more efficient systems that save time and improve performance.
I’ll be sharing my progress as I apply these new tools to real projects in the coming weeks.
0
10
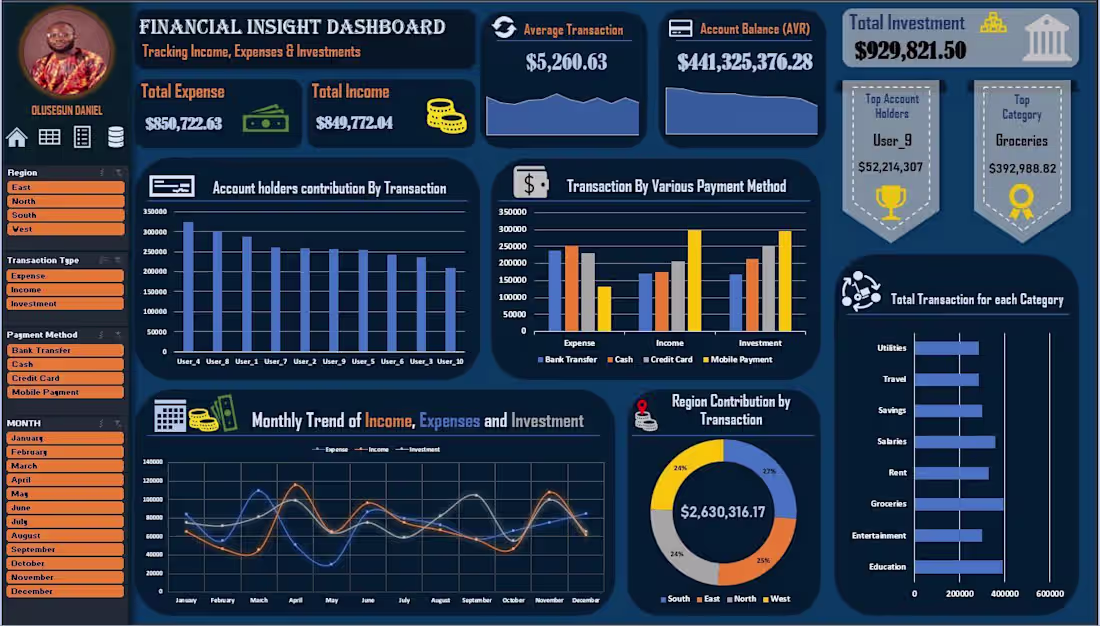
Excel Financial Dashboard Project
I designed an interactive financial dashboard in Excel to analyze and visualize income, expenses, and investments. The dashboard includes key performance indicators and charts that help users understand financial trends and make informed decisions.
Key Recommendations:
Keep track of high-expense months.
Reduce spending in major categories.
Maintain consistent investments for growth.
👉 For more details, visit the link below:
https://github.com/Gensegzy1/Finance-Insight
3
4
45
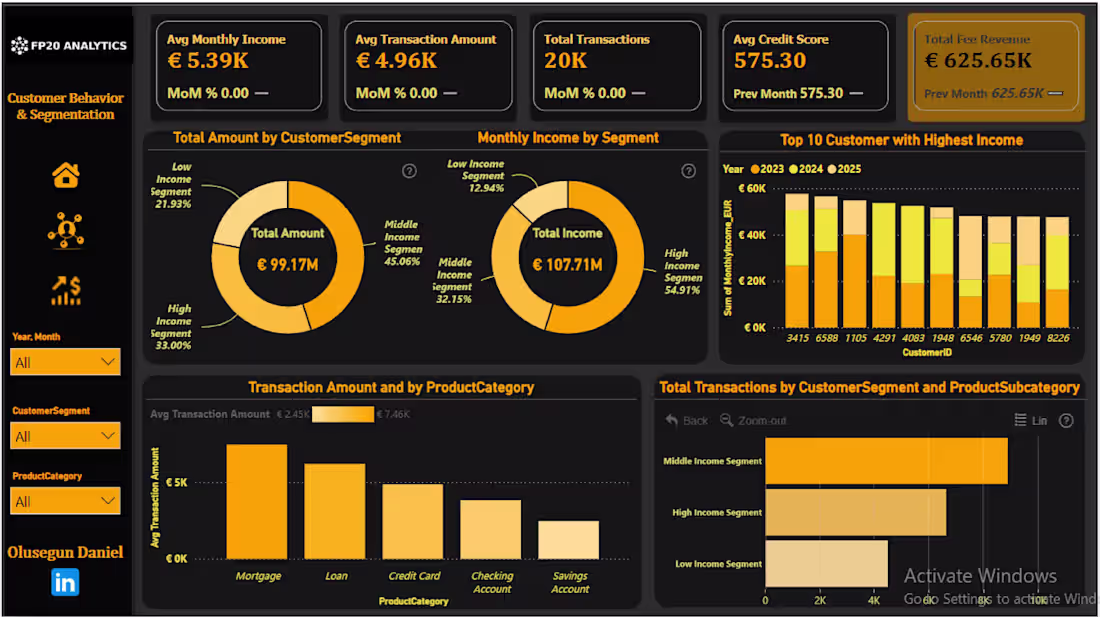
Banking Analytics Dashboard
A dashboard analyzing 20,000+ banking transactions to uncover insights on customer behavior, revenue trends, and branch performance.
Built with ZoomCharts Drill Down visuals, conditional formatting, and trend indicators, it offers an interactive and intuitive exploration experience.
Highlights:
Overview: Key KPIs and revenue trends
Customer Insights: Segment behavior and income patterns
Revenue & Trends: Transaction, branch, and channel performance with time-series and map visuals
Features:
✔️ MoM KPIs with trend indicators
✔️ ZoomCharts for interactive drilldowns
✔️ Conditional formatting for outliers
✔️ Smart narratives and clean design
Impact:
Empowers stakeholders to identify top customer segments, track revenue shifts, and assess branch and channel performance for smarter, data-driven decisions.
3
2
22