
Ogbuewu Rosemary
Data Analysis and Dashboards with Excel and Power BI
New to Contra
Ogbuewu is building their profile!
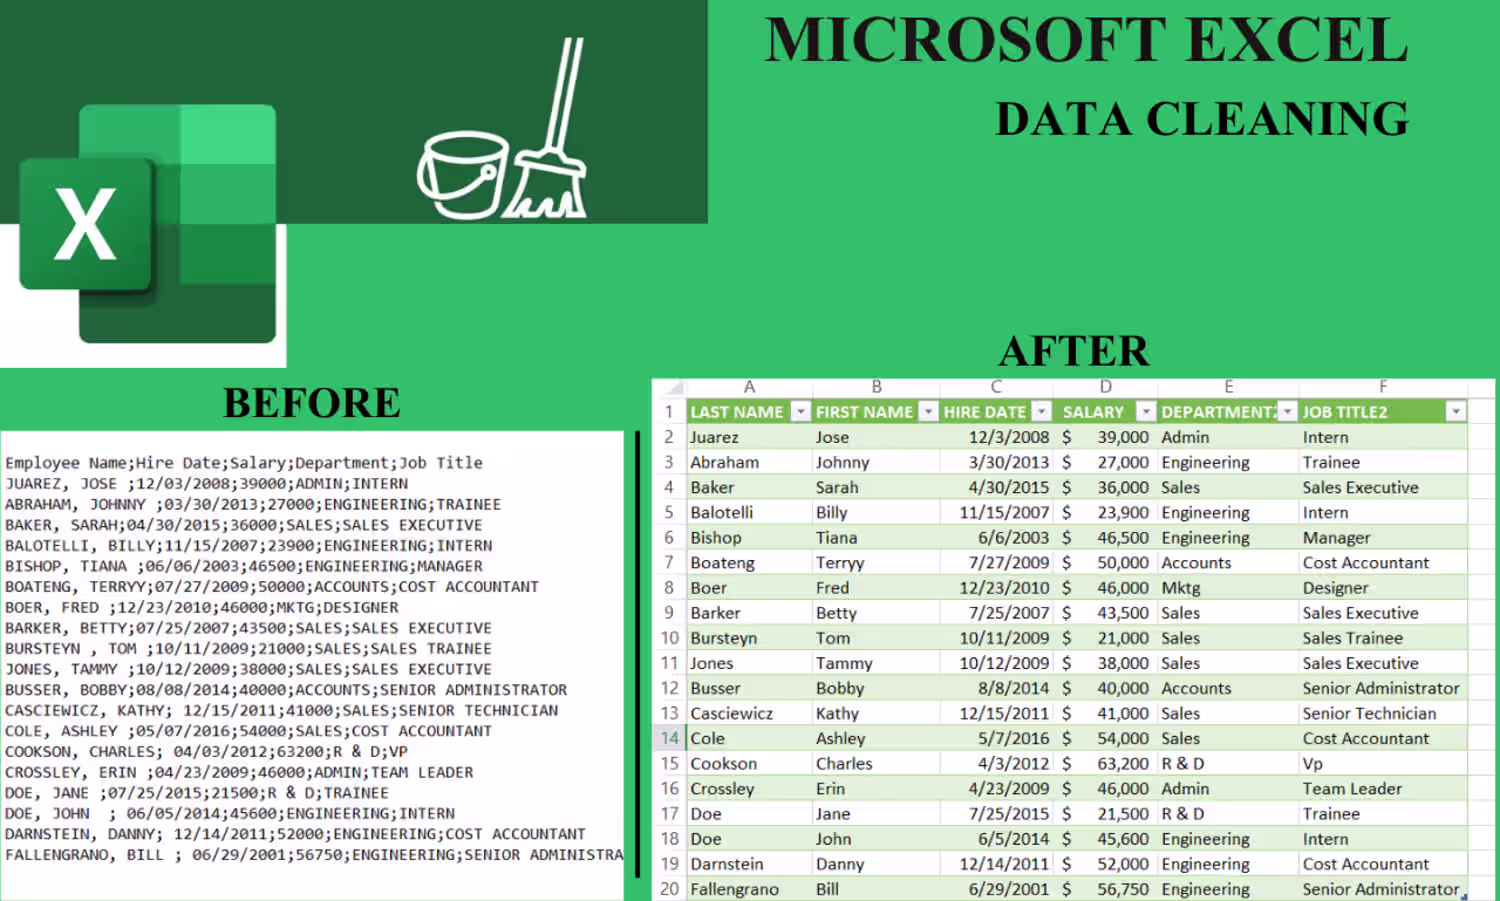
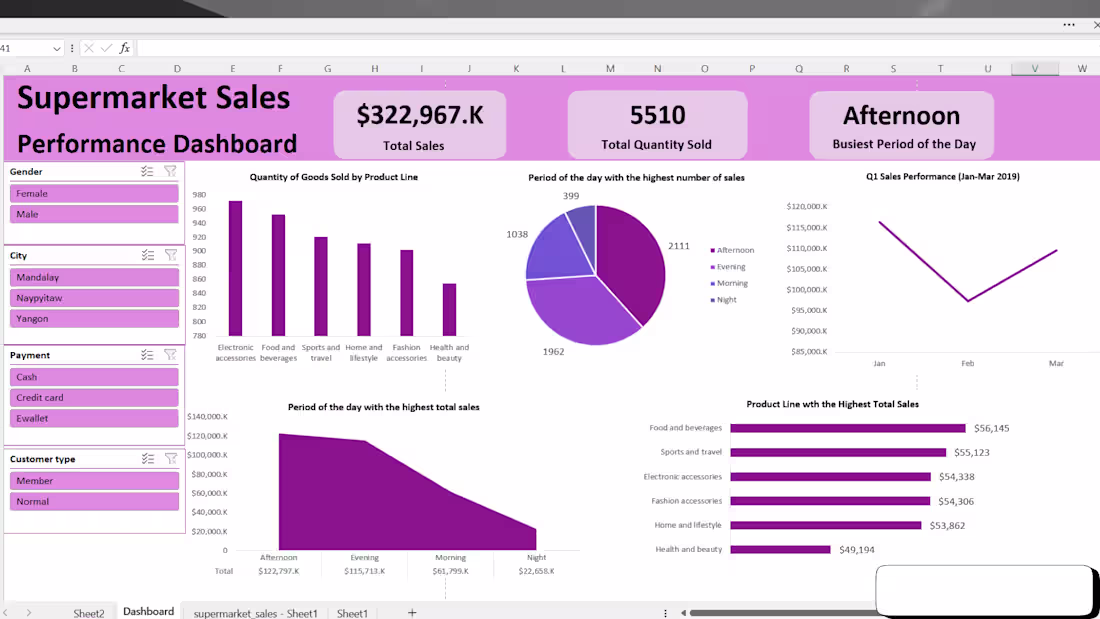
Sales Performance Dashboard (Excel)
I built this dashboard to help a business quickly understand how its sales are performing across products, locations, and time.
The goal was simple: turn scattered sales data into a single view that answers key questions: Which products drive revenue? Where are we growing? What needs attention?
Using clear visuals and KPIs, the dashboard highlights trends, top-performing product lines, and revenue contributions, making it easy for managers to spot opportunities and make informed decisions without digging through raw data.
This project demonstrates how data visualization can transform everyday sales data into actionable business insights.
2
3
33