
noelia caceres
Data analyst | Business Analyst | BI Developer
Ready for work
noelia is ready for their next project!

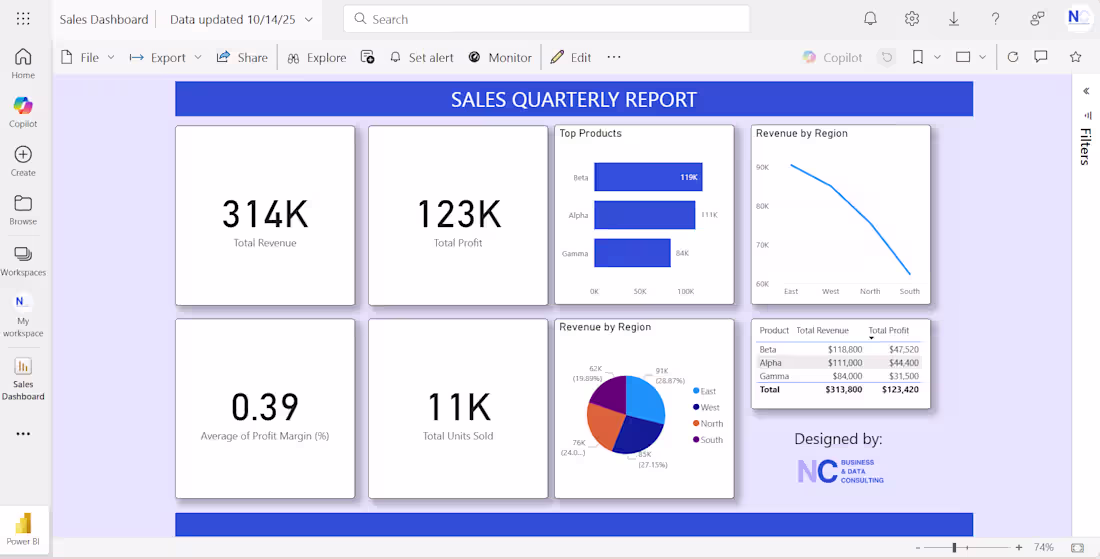
Project: Sales Overview Dashboard
Description:
Designed an interactive Power BI dashboard to track sales, profit, and performance by product and region.
✅ Built KPIs to summarize key metrics
✅ Created trend and product insights with visual storytelling
Tools: Power BI | Data Modeling | DAX | Data Visualization
0
55
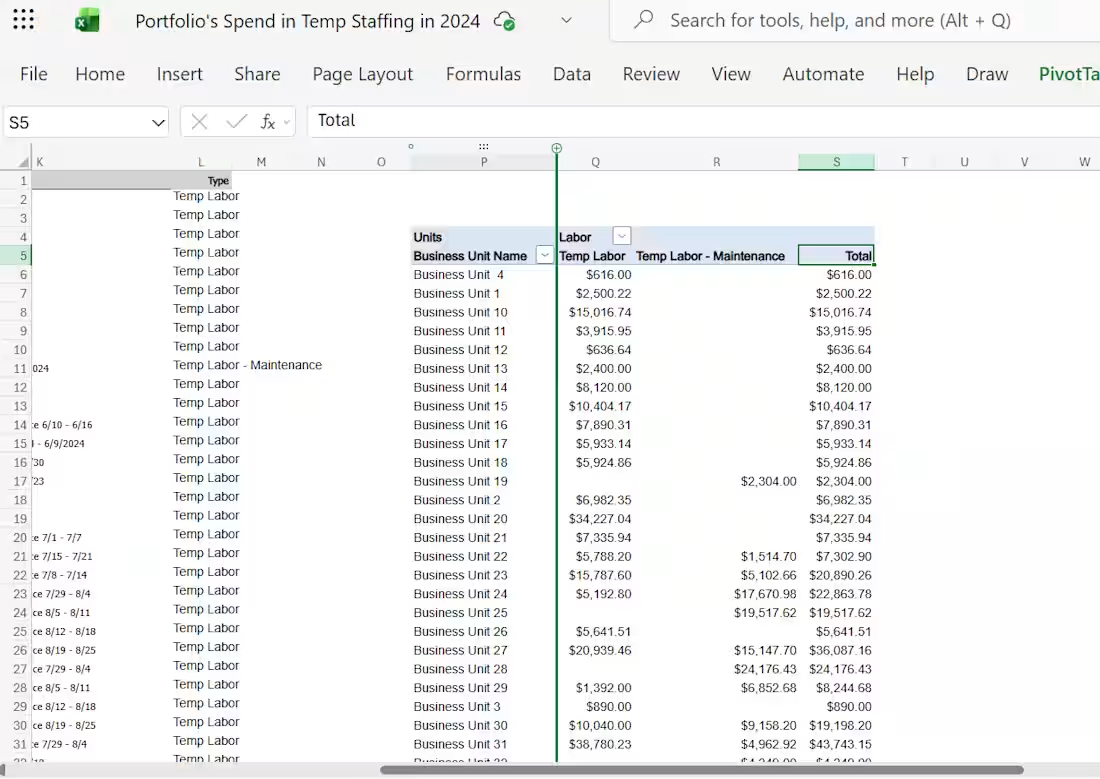
📊 Staffing Spend Analysis by Business Unit
Developed an Excel model to analyze staffing expenses across business units.
✅ Broke down total spend by department and category
✅ Identified cost trends and optimization opportunities
Tools: Excel | Data Modeling | Cost Analysis
1
54
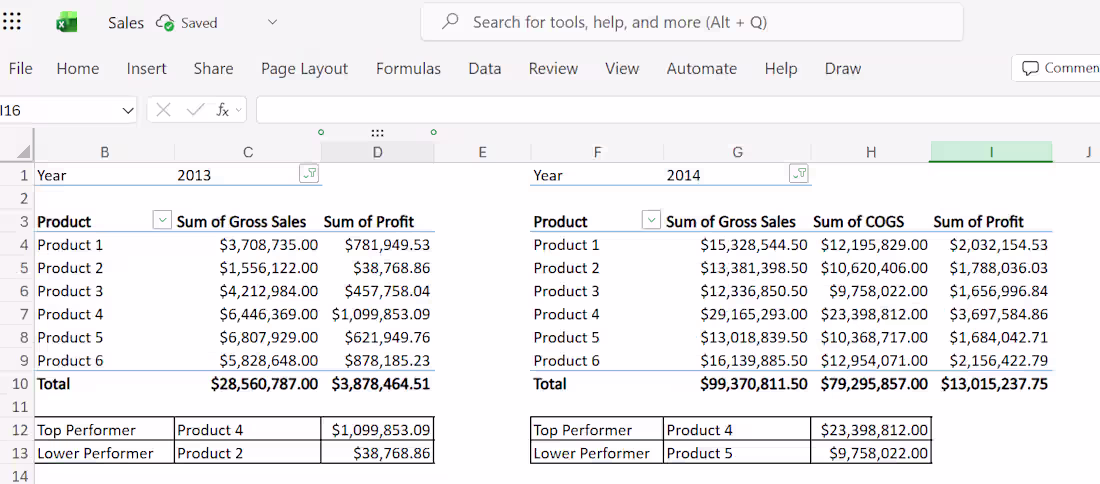
Project Title:
Sales data analysis
Built an Excel dashboard to compare product performance across 2013–2014.
✅ Identified top and low performers using profit data
✅ Highlighted trends in sales, COGS, and profitability
Tools: Excel | Pivot Tables | Data Analysis
0
41
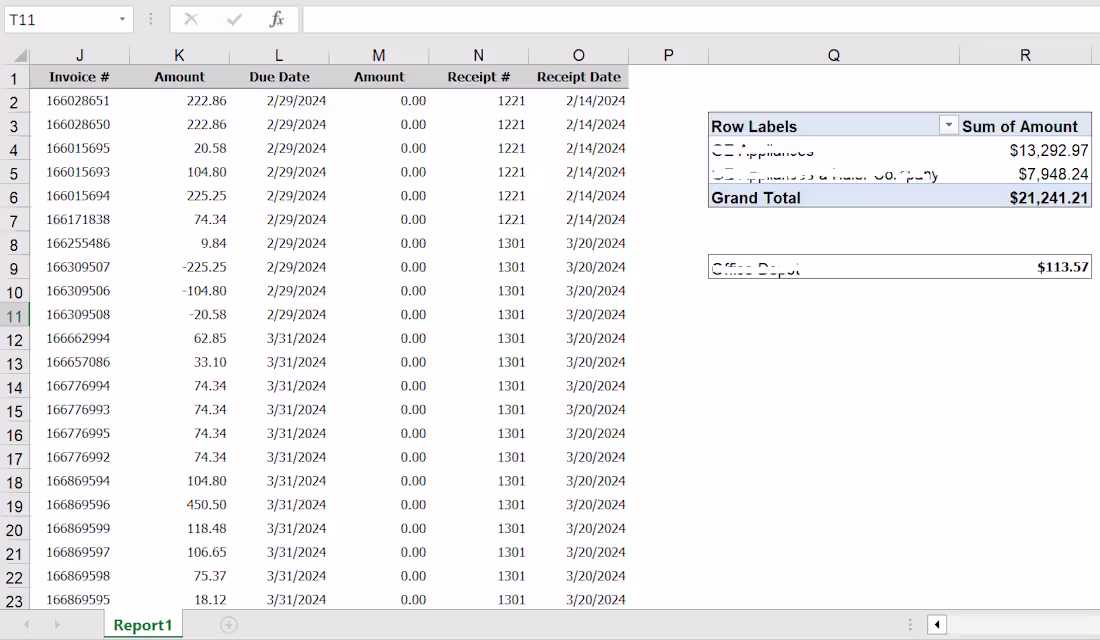
💼 Project Title:
Quick Excel Analysis for Fast Business Insight
🧾 Description:
Completed a fast-turnaround Excel data analysis to have a quick understand key trends in operational data.
🔍 Key Features:
Data cleaning and validation
Summary tables
Pivot tables with filters for flexible analysis
🛠 Tools Used:
Microsoft Excel, Pivot Tables, Formulas.
0
31
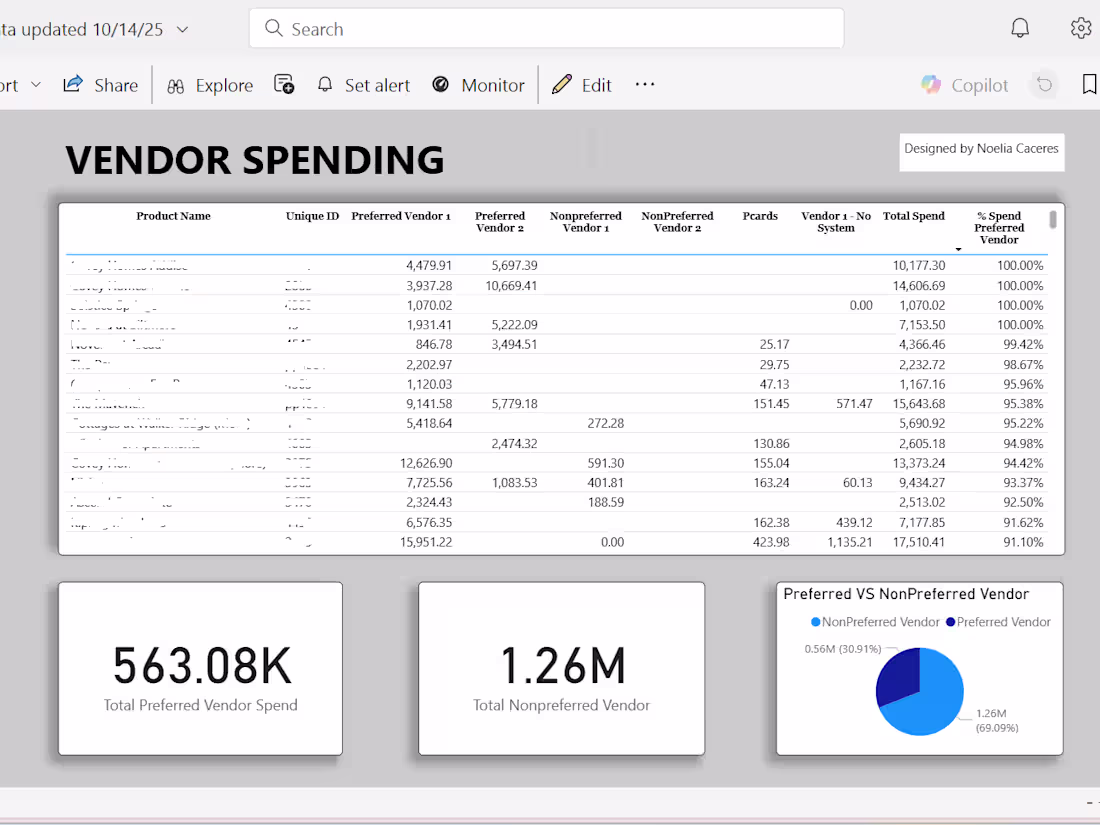
💼 Project Title:
Power BI Vendor Spend Report for Cost Insights
🧾 Description:
Developing a Vendor Spend Report in Power BI to help the procurement and finance teams monitor expenses, identify top vendors, and uncover cost-saving opportunities across departments.
🔍 Key Features:
Total spend by business unit
Preferred vs. non-preferred vendor breakdown
Compliance insights: shows which business units need to increase usage of compliant vendors
Spend comparison between compliant and non-compliant vendors
🛠 Tools Used:
Power BI, DAX, Power Query, MS Excel.
2
1
50