
Nicolas Silva
Excel Dashboard & Administrative Process Specialist
New to Contra
Nicolas is building their profile!

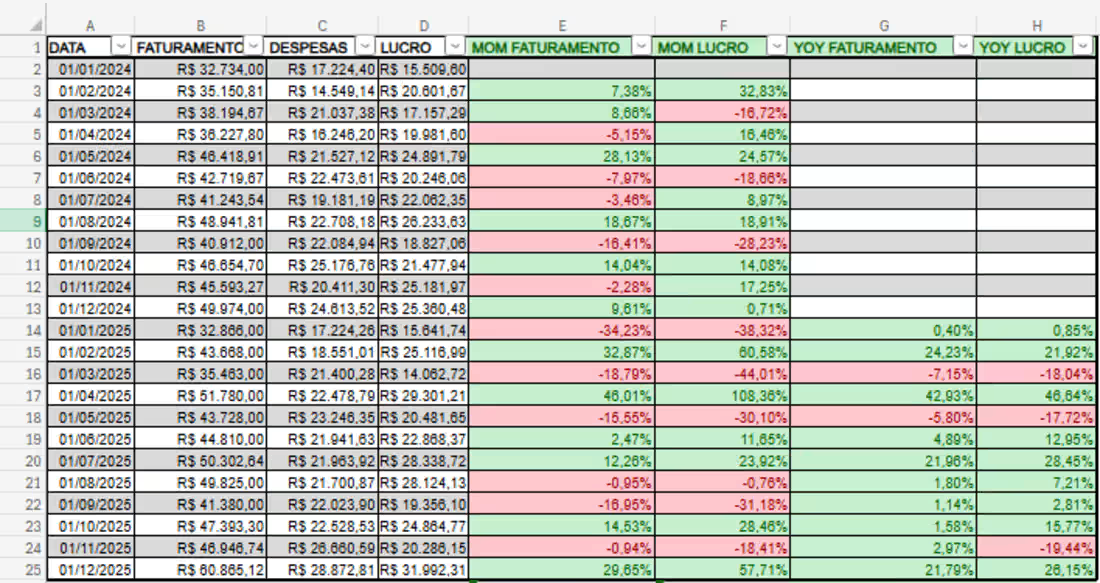
Excel spreadsheet designed to track revenue, expenses, and profit over time. The model includes monthly performance analysis, MoM (Month-over-Month) and YoY (Year-over-Year) comparisons, helping identify trends and support financial decision-making.
0
7
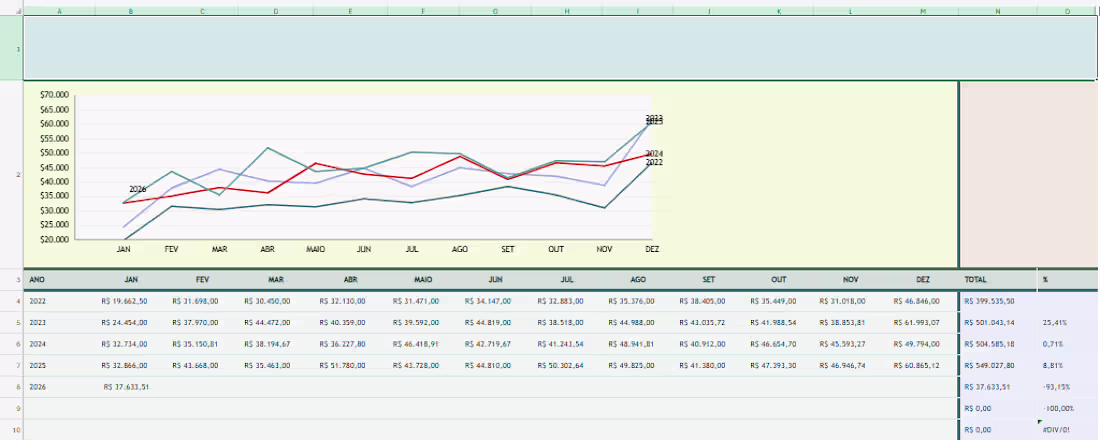
Financial dashboard created in Excel to track monthly performance, revenue trends, and key indicators. The spreadsheet organizes financial data and provides visual charts to support analysis and decision-making.
2
19