
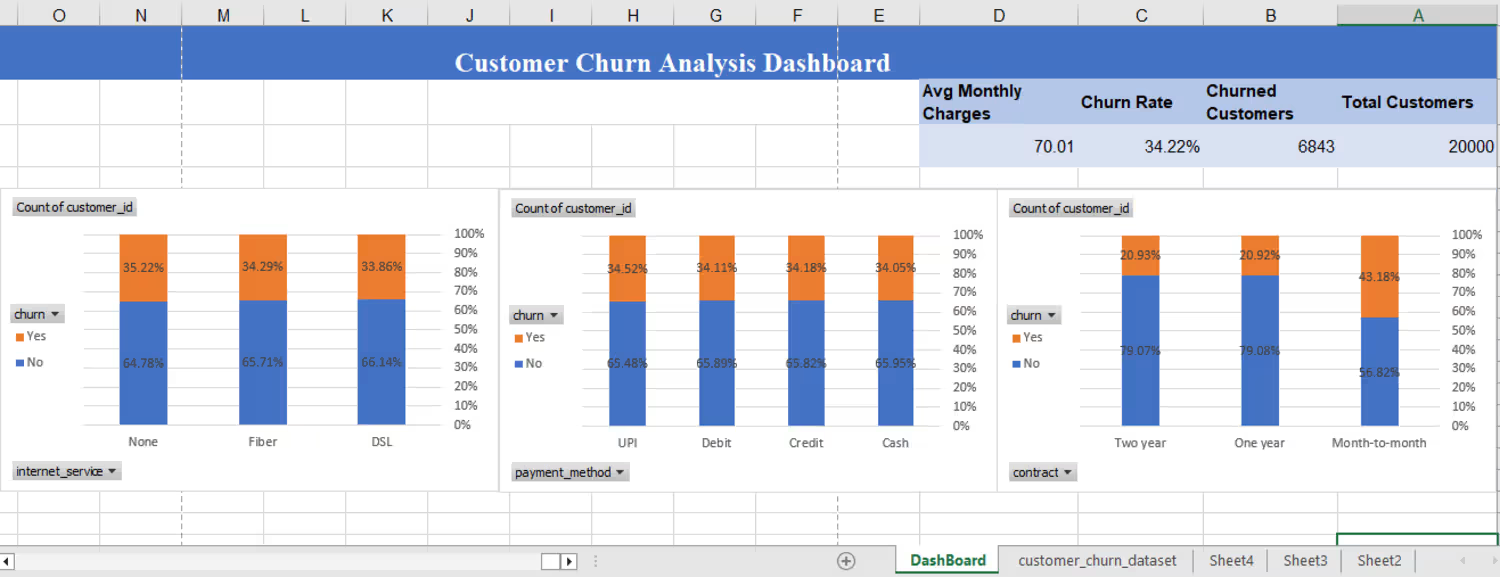
Sephora Product Analysis Dashboard | Power BI
Analyzed Sephora product data using Power BI and Power Query to identify product availability, pricing trends, and discount patterns. Cleaned and transformed the dataset, then built an interactive dashboard to compare product categories and brands, track out-of-stock products, and uncover key business insights through KPIs and visualizations.
0
8
Customer Churn Analysis – Excel
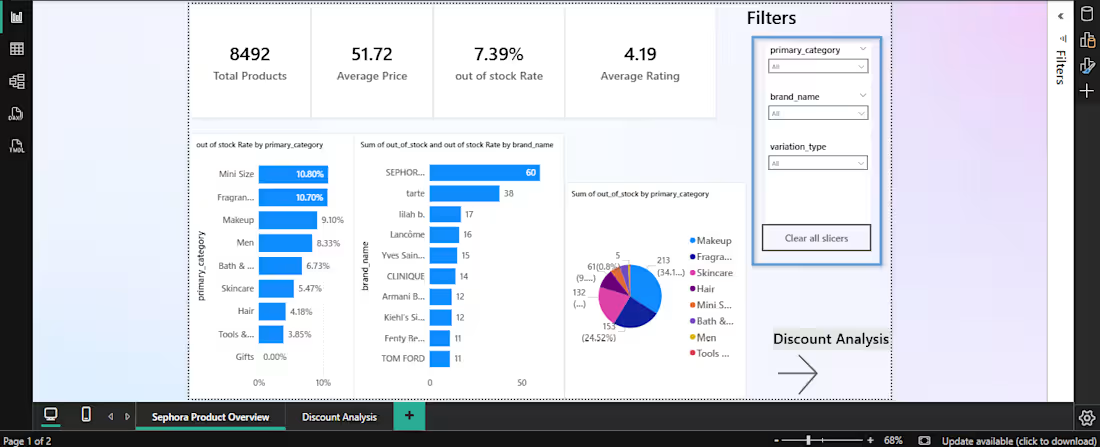
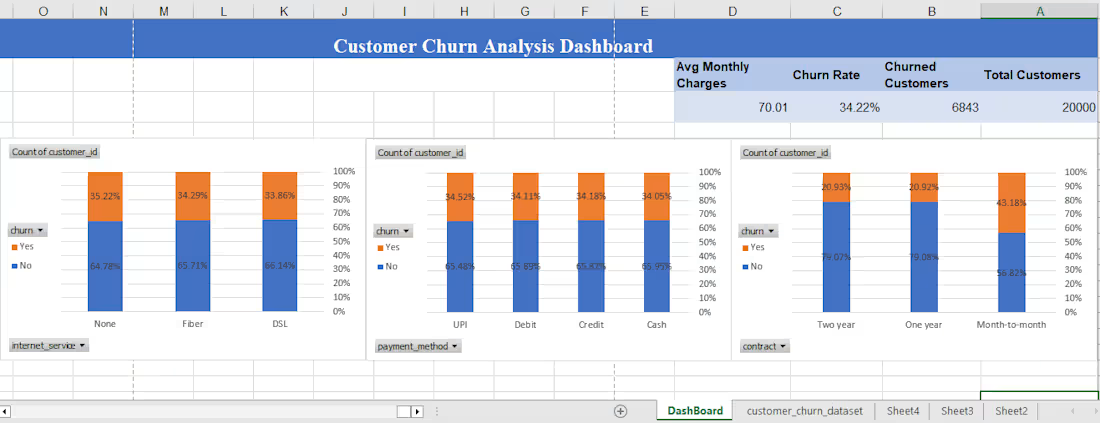
Analyzed 20,000 customer records to identify key patterns associated with customer churn and provide actionable retention insights.
Cleaned and validated the dataset with no duplicates or missing values.
Calculated key KPIs including total customers, churned customers, churn rate, and average monthly charges.
Analyzed churn by contract, payment method, and internet service.
Identified month-to-month contracts as the strongest churn indicator, with a 43.18% churn rate.
Provided data-driven recommendations to support customer retention.
Tools: Microsoft Excel, PivotTables, Data Analysis, Data Visualization
0
31
Sales & Profit Analysis Dashboard
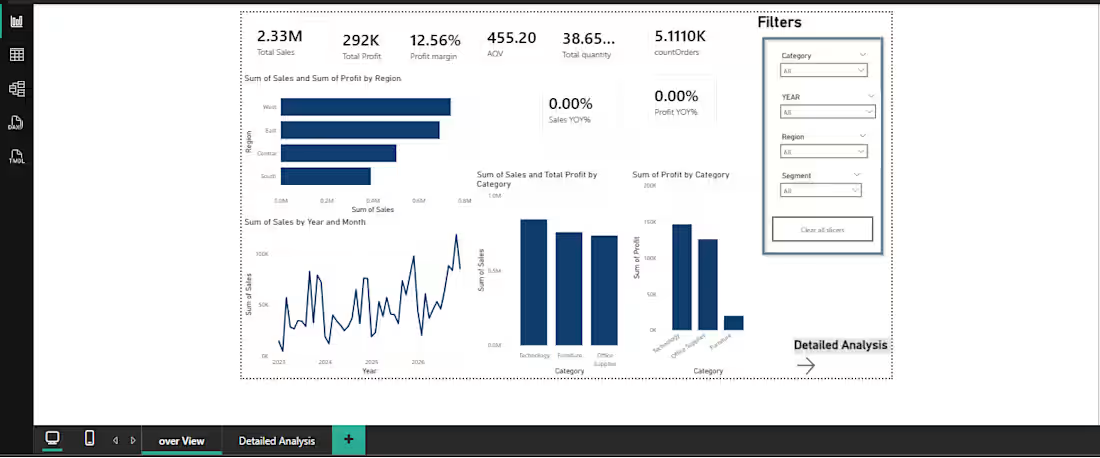
Interactive Power BI dashboard designed to analyze sales and profitability performance and provide clear business insights.
Analyzed sales and profit performance across categories and sub-categories.
Created KPIs for Total Sales, Total Profit, Order Count, and Profit Margin.
Built interactive visualizations with slicers and filters for better data exploration.
Implemented time intelligence analysis, including Sales YoY and Profit YoY.
Created a structured data model using a Calendar table and relationships.
Used DAX measures to calculate KPIs and business metrics.
Added tooltips and interactive elements to improve dashboard usability.
Tools: Power BI, DAX, Excel
0
24