The network for creativity
Join 1.25M professional creatives like you
Connect with clients, get discovered, and run your business 100% commission-free
Creatives on Contra have earned over $150M and we are just getting started
Back to feedPost
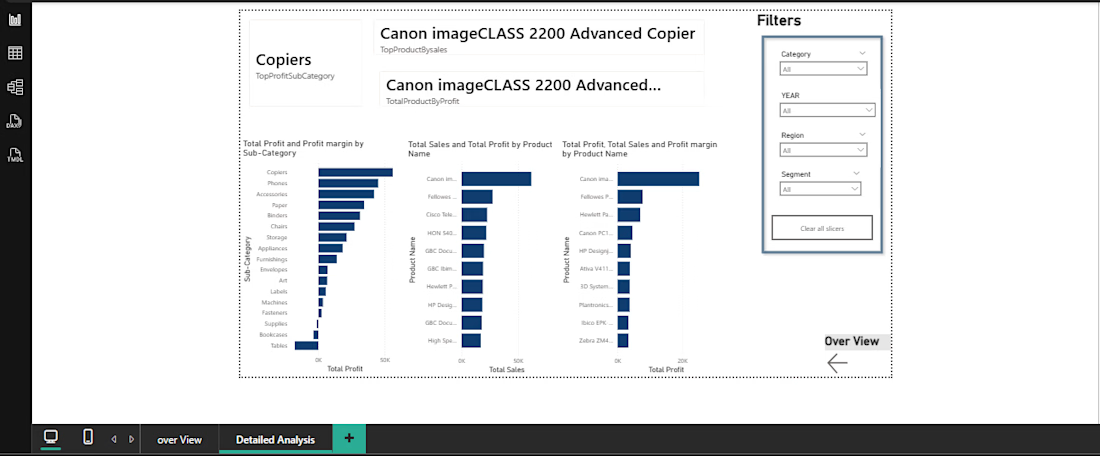
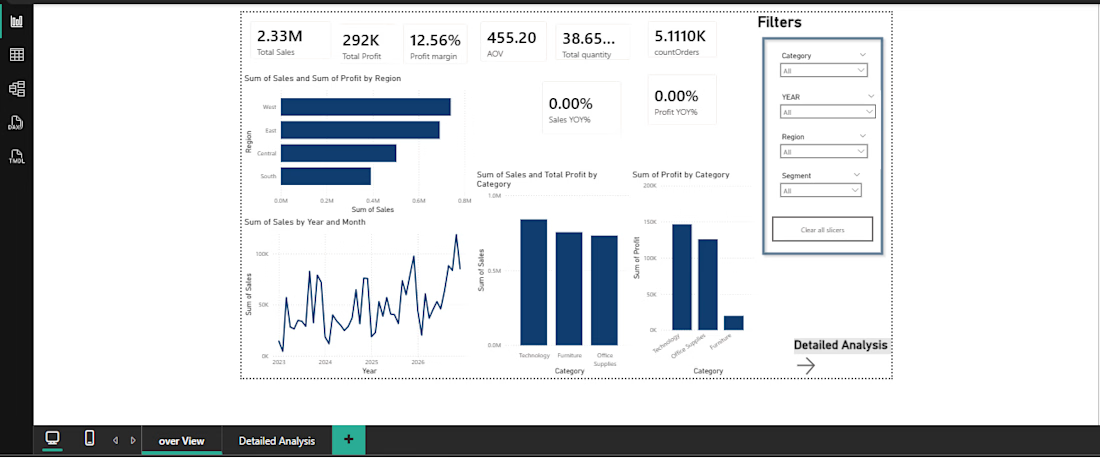
Sales & Profit Analysis Dashboard
Interactive Power BI dashboard designed to analyze sales and profitability performance and provide clear business insights.
Analyzed sales and profit performance across categories and sub-categories.
Created KPIs for Total Sales, Total Profit, Order Count, and Profit Margin.
Built interactive visualizations with slicers and filters for better data exploration.
Implemented time intelligence analysis, including Sales YoY and Profit YoY.
Created a structured data model using a Calendar table and relationships.
Used DAX measures to calculate KPIs and business metrics.
Added tooltips and interactive elements to improve dashboard usability.
Tools: Power BI, DAX, Excel


The network for creativity
Join 1.25M professional creatives like you
Connect with clients, get discovered, and run your business 100% commission-free
Creatives on Contra have earned over $150M and we are just getting started







Related posts

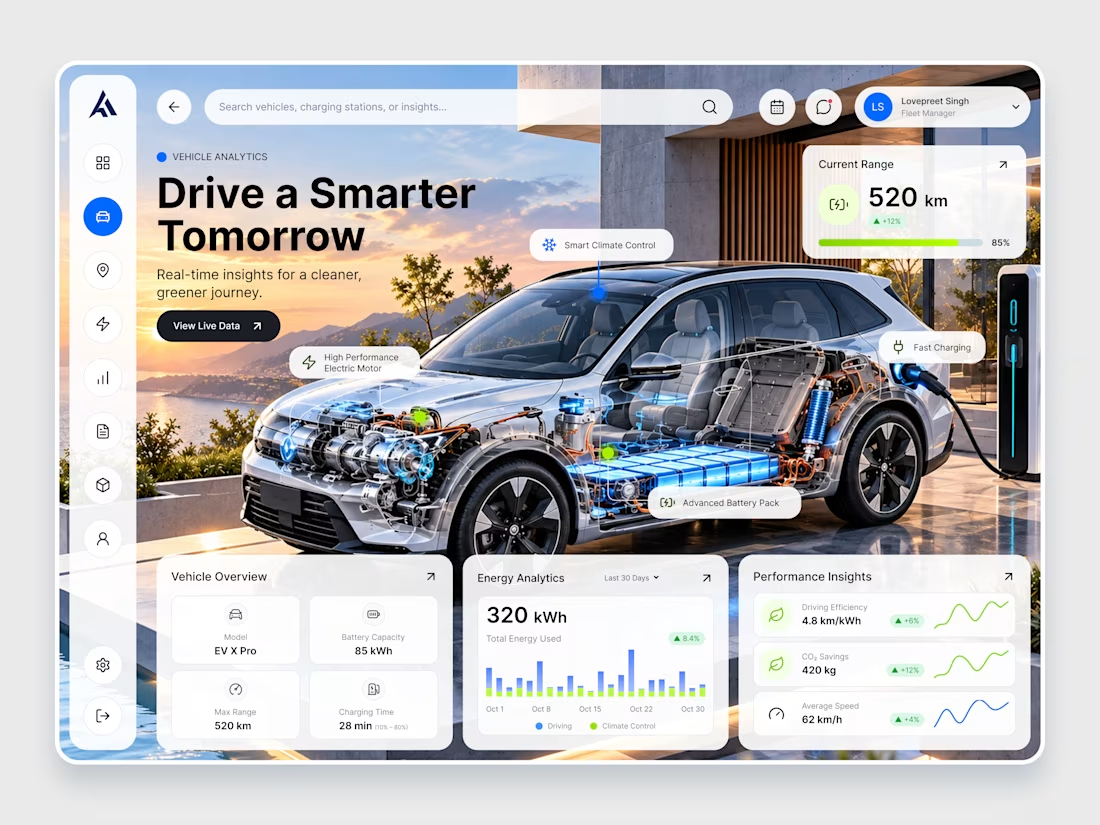
EV X Pro — Futuristic EV Analytics & Dashboard Design
Introducing EV X Pro, a futuristic electric vehicle analytics dashboard designed to make every journey smarter, cleaner, and more efficient. ⚡
Featuring a premium automotive visual, real-time battery insights, energy consumption analytics, charging performance, driving efficiency metrics, and an intuitive dashboard interface, this concept combines modern UI/UX design with next-generation electric mobility.
Designed with a clean glassmorphism aesthetic, vibrant blue accents, and minimal data visualizations, EV X Pro delivers a seamless experience for monitoring vehicle performance and sustainable driving.



That's really unique & futuristic dashboard 🔥🔥🔥🔥🔥

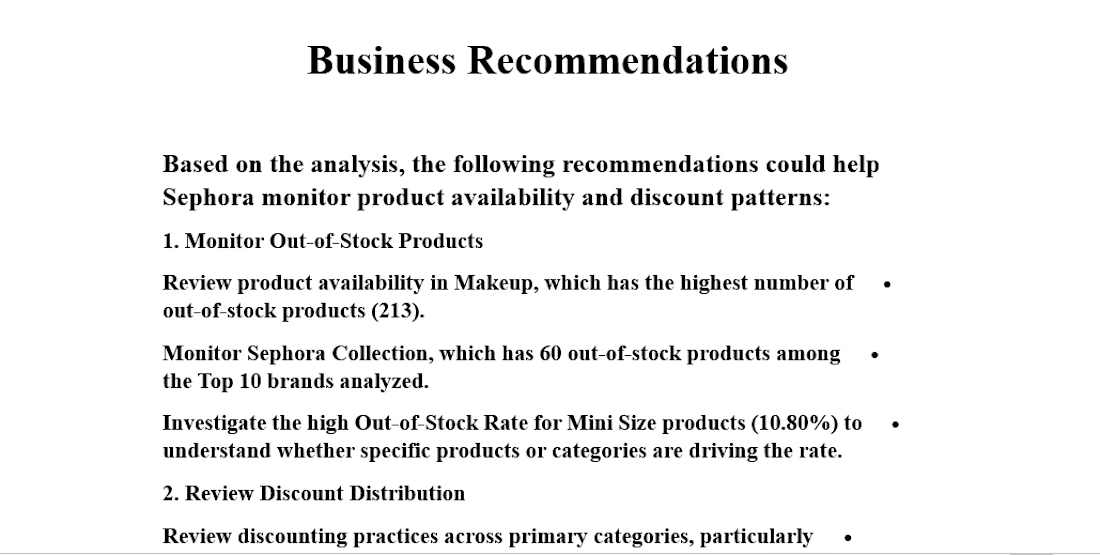
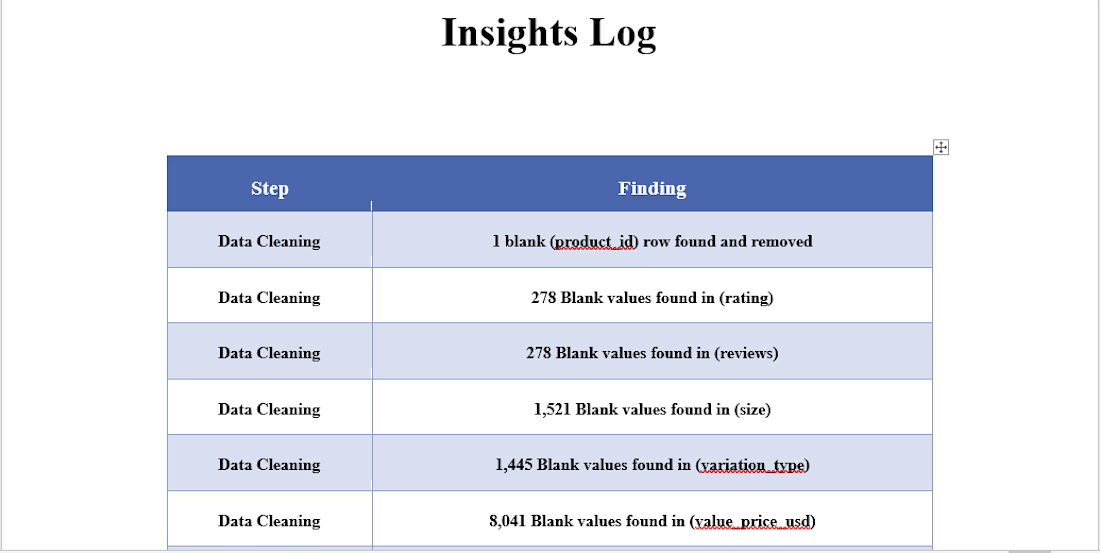
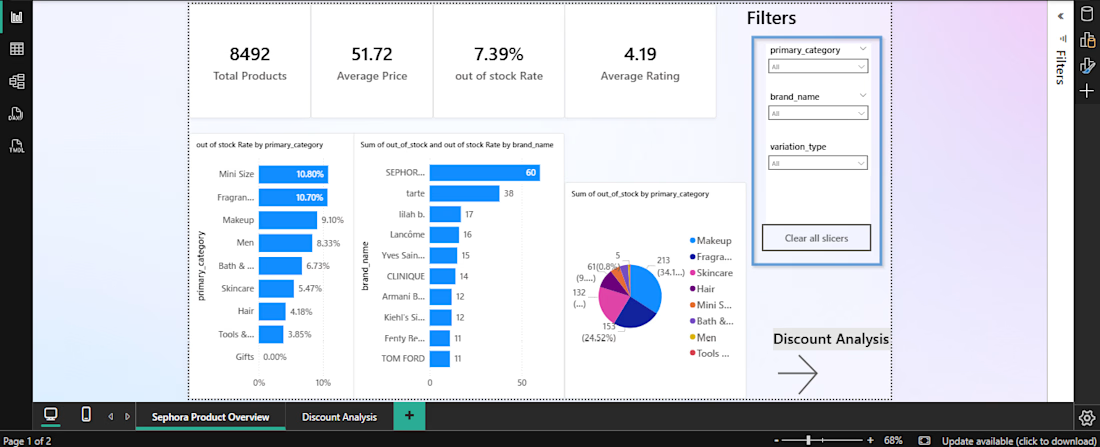
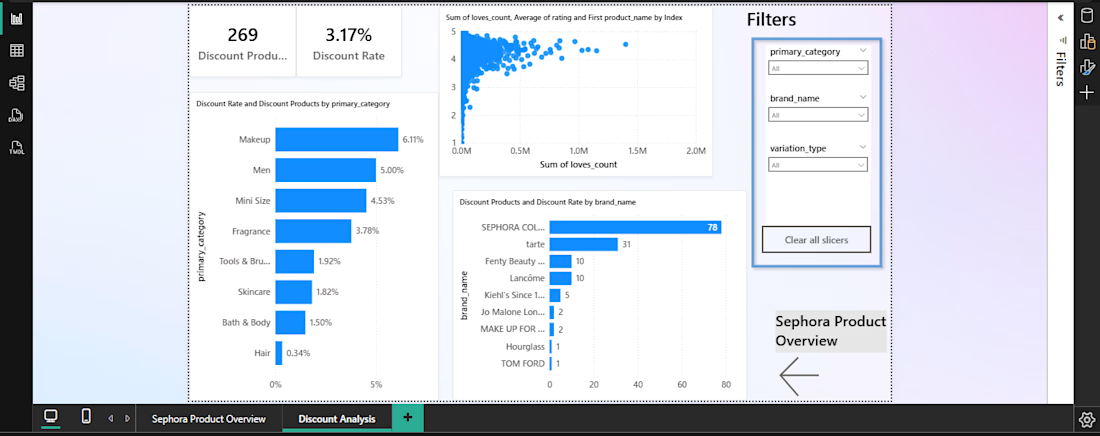
Sephora Product Analysis Dashboard | Power BI
Analyzed Sephora product data using Power BI and Power Query to identify product availability, pricing trends, and discount patterns. Cleaned and transformed the dataset, then built an interactive dashboard to compare product categories and brands, track out-of-stock products, and uncover key business insights through KPIs and visualizations.

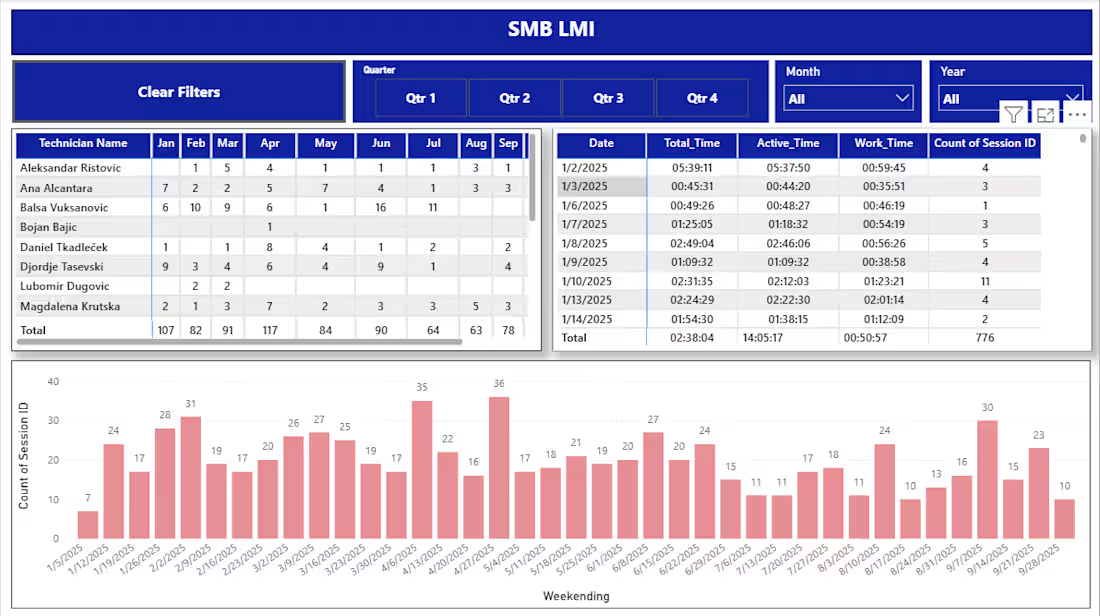
Developed an interactive Power BI SMB Business Care Dashboard to monitor customer support operations across Email, Cases, Voice, Chat, and LMI channels. Built dedicated report pages with interactive filters and data visualizations to track agent performance, analyze service activity, and provide actionable insights for operational decision-making.