
Nagendra Naik
Data Analyst & Data Entry Specialist | Excel | Power BI | SQ
New to Contra
Nagendra is ready for their next project!
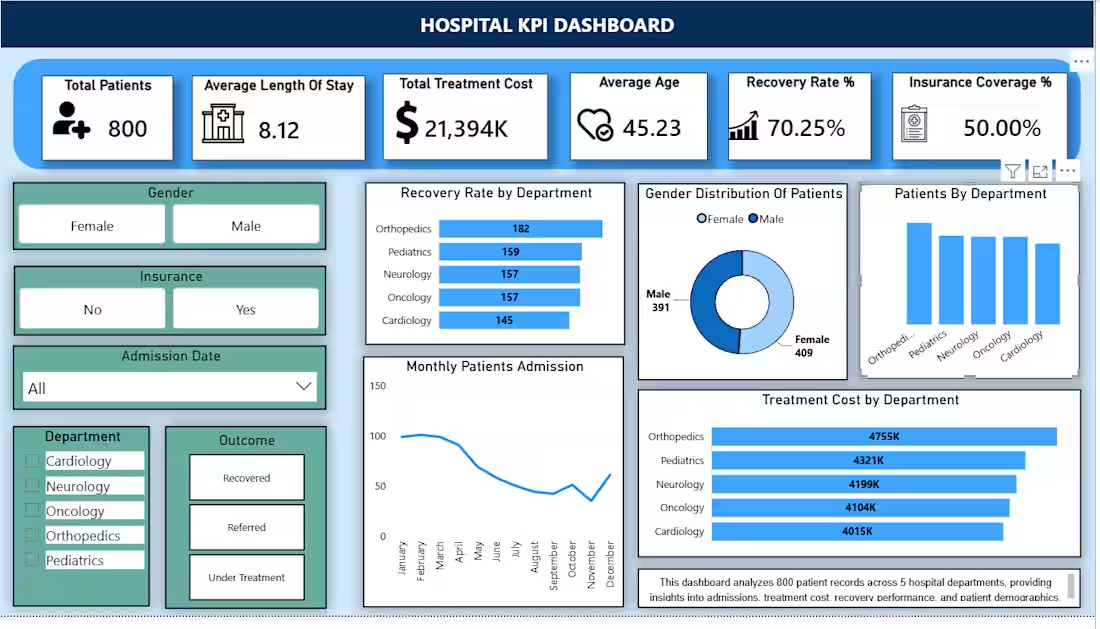
Hospital Patient Analytics
Dashboard |
Power BI
•
Designed an interactive healthcare dashboard analyzing
patient demographics, treatment costs, and recovery trends for at-a-glance
monitoring of patient outcomes.
Combined KPI cards and slicers so non-technical stakeholders could filter by demographic or treatment type without needing to write a query
0
9
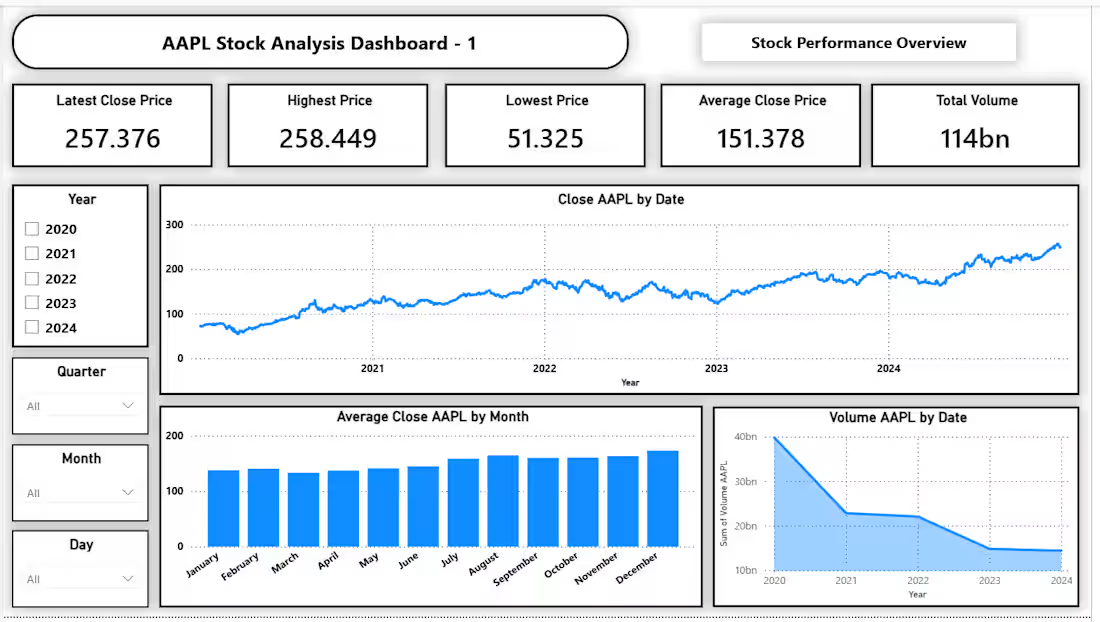
AAPL Historical Stock Analysis Dashboard | Power BI
Developed an interactive stock market dashboard to analyze Apple (AAPL) stock performance from 2020–2024.
Key Features:
Stock performance overview with key financial KPIs
Close price trend analysis over time
Monthly average stock price analysis
Trading volume analysis
Open vs Close price comparison
High vs Low price trend analysis
Monthly OHLC (Open, High, Low, Close) analysis
Interactive filtering by Year, Quarter, and Month
Tools Used:
Power BI, Power Query, DAX, Excel
Skills:
Financial Analysis, Time Series Analysis, Data Visualization, Power BI, DAX, Dashboard Development
0
14
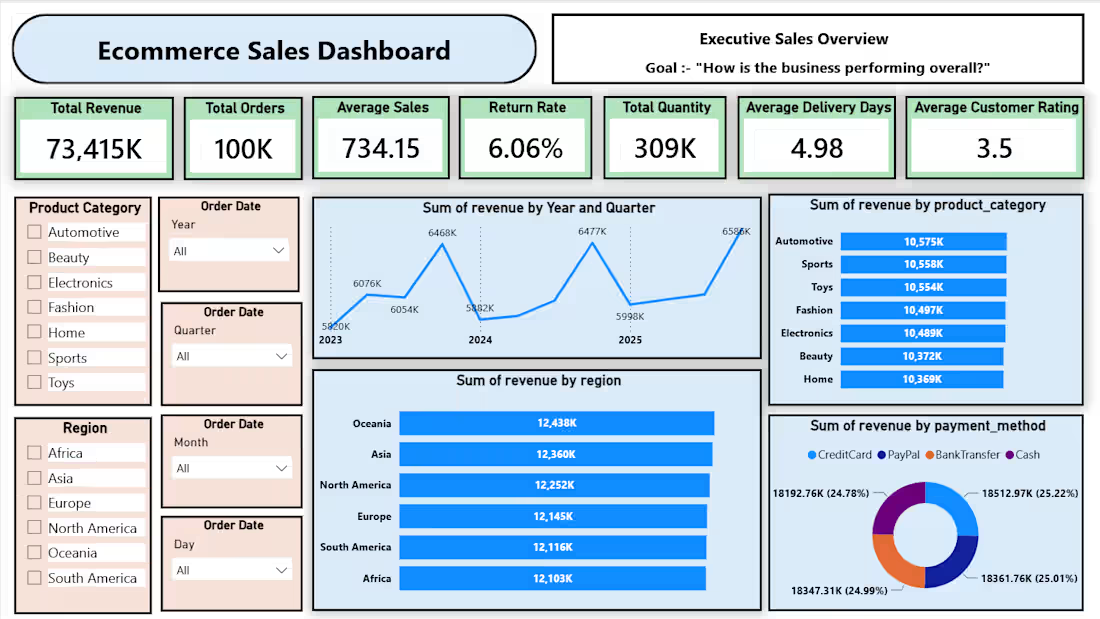
E-commerce Sales Dashboard
| Power BI
•
Built a KPI dashboard over 100,000+ e-commerce
transactions covering sales, revenue, customer ratings, and returns, giving stakeholders
a single view instead of scattered spreadsheets.
•
Broke down performance by product, payment method, and
region to surface where merchandising and pricing decisions could have the most
impact.
0
16
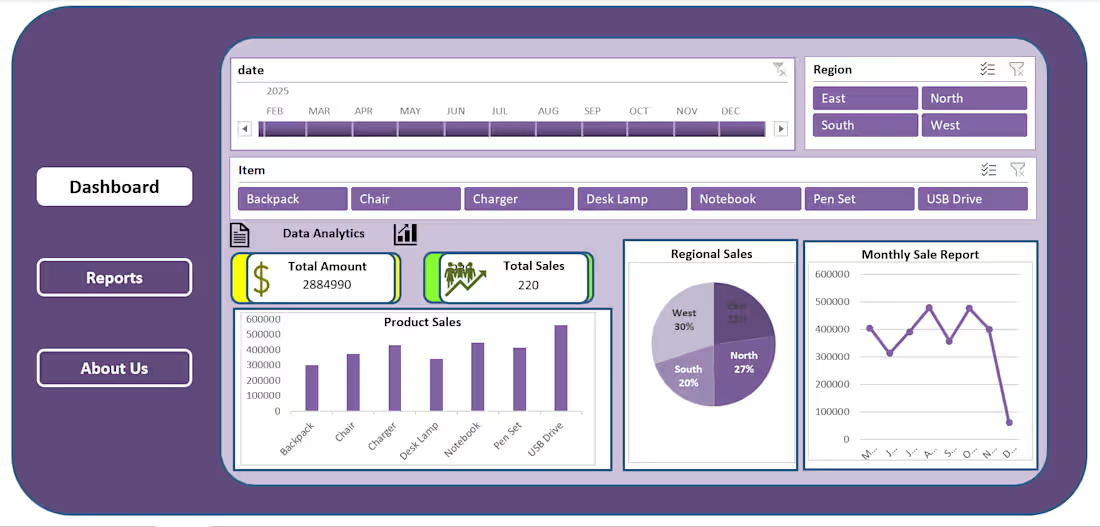
Sales Performance Dashboard
| Excel
•
Analyzed 5,000+ sales records and built an interactive
dashboard using Pivot Tables, Charts, and Slicers.
Cut manual reporting effort by replacing static spreadsheets with a self-service view of product performance
0
20
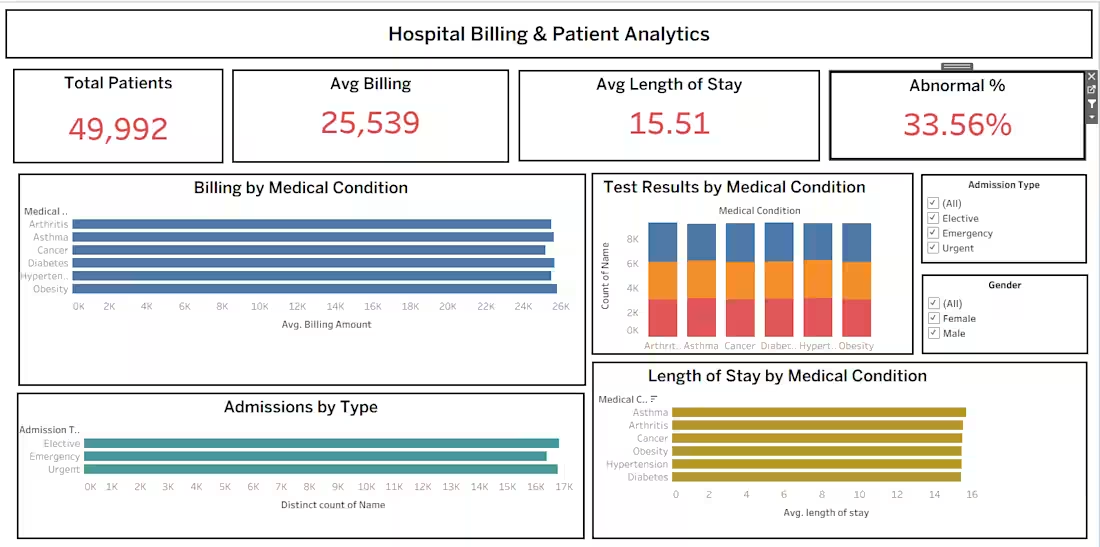
Hospital Billing &
Patient Analytics |
Tableau
•
Built an interactive Tableau dashboard analyzing
billing amount, length of stay, and test outcomes across nearly 50,000 patient
records, with KPI cards for total patients, average billing, average length of
stay, and abnormal result rate.
•
Added Admission Type and Gender filters so viewers can
interactively drill into billing and outcome patterns by segment.
0
23