
Munira Momoh
Turning data into solutions that drive growth.


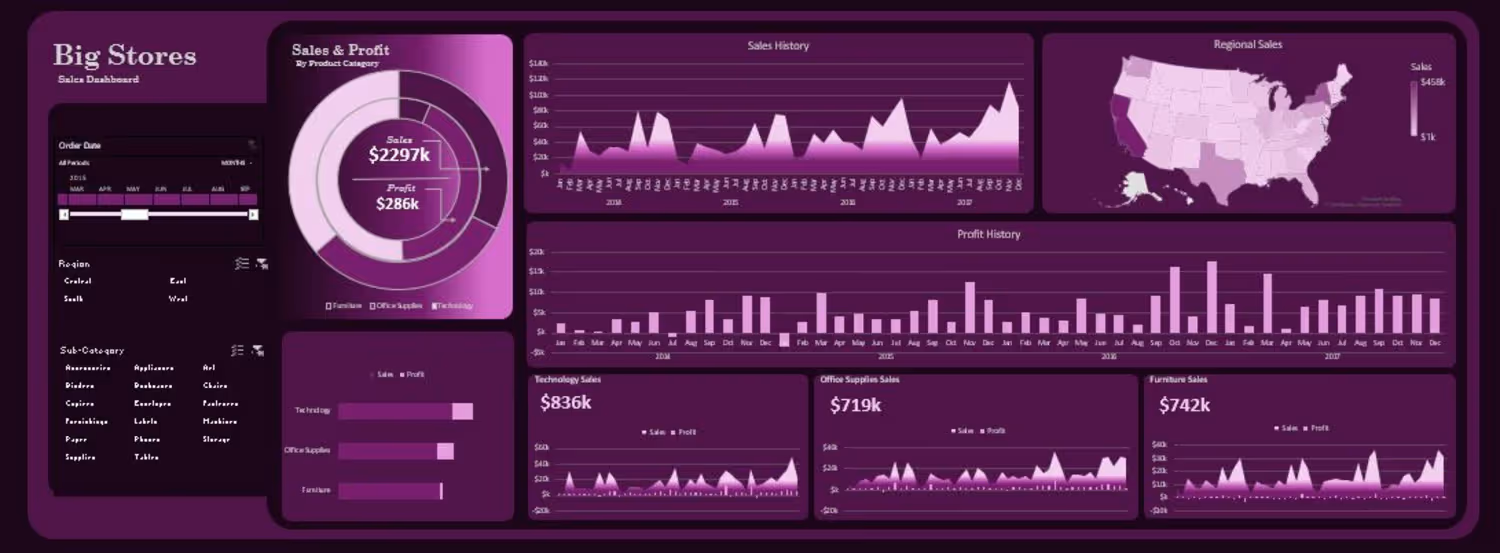
Cleaned and organized data in Excel, using count if and basic functions to produce clear and accurate reports for a recruitment agency
2
5
166
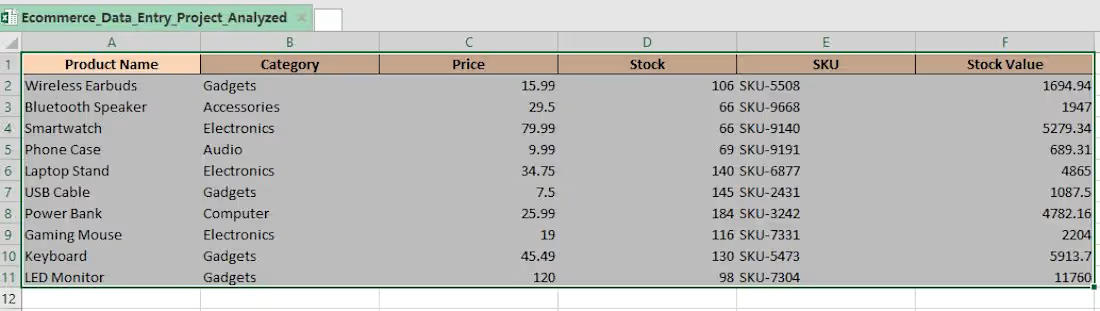
This project demonstrates how I transformed messy e-commerce product data into a clean, organized, and ready-to-use Excel catalog. Using Excel tools, I standardized product names, categories, prices, and stock levels to ensure accuracy, consistency, and actionable insights for decision-making.
I structure data efficiently, helping businesses save time, reduce errors, and make smarter operational choices.
If you’re running an online store, managing CRM data, or handling large Excel files, I can help you turn raw information into reliable, organized data that works for you.
Skills: Data Entry | Excel | Data Cleaning | Data Organization | Data Validation
3
89
Now let’s talk #churn
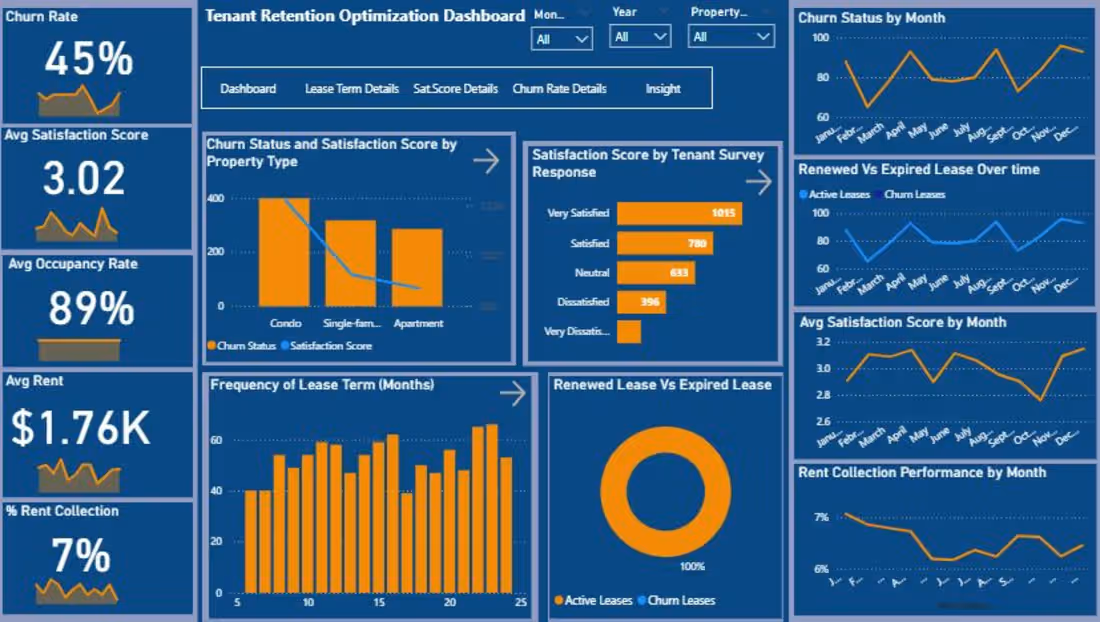
I built this Tenant Retention Dashboard to help a real estate firm see what drives loyalty and where to act.
The goal was to find links between churn, satisfaction, and financial results.
Here’s the catch.
The data ended in September, but I reviewed it in November. So I assumed:
• Leases ending before today are #Churned.
• Leases ending after today are #Active.
It’s fine if the logic fits the business and you stay transparent.
Findings:
• Churn: 45%, mostly short-term and low-satisfaction tenants.
• Satisfaction: 3.02, neutral loyalty.
• Occupancy: 89%, strong demand, weak retention.
• Rent collection: low, poor follow-up.
The issue isn’t demand, it’s relationships. Tenants move in, not stay. Weak communication, slow maintenance, and low trust drive exits. Focus on keeping tenants, not chasing new ones
1
3
118
So, I asked the question every analyst should ask “why?”
Why are most offenders not being arrested?
I checked the breakdown.
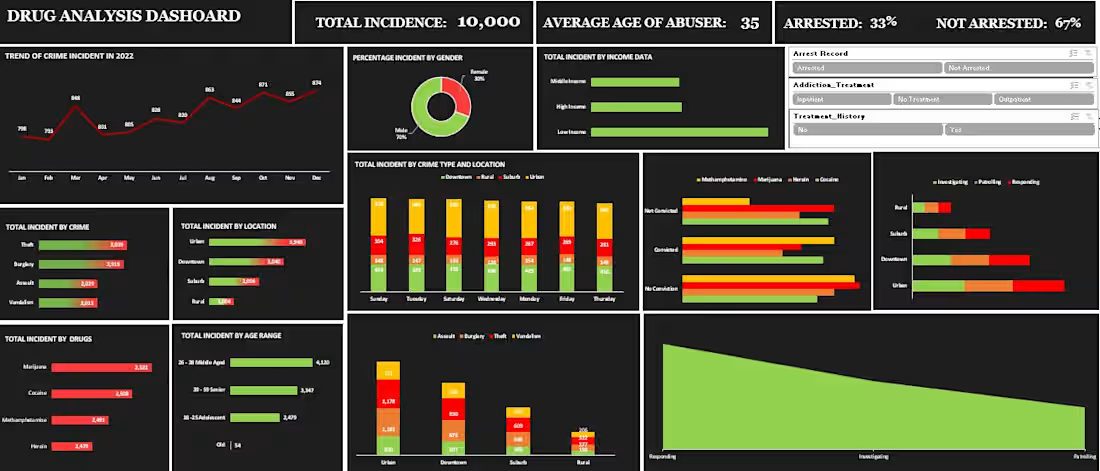
Most incidents happened in urban and low-income areas.
Police activity there was highest only when responding, not investigating.
That was the problem. We react fast but follow up slow.
The more I cleaned and rearranged, the more the story unfolded
Theft was the most common crime.
Males dominated the data.
Most abusers were between 26 and 38 years old.
And drug types? Cocaine and marijuana led the pack
So, I redesigned the dashboard to show these relationships
Grouped by location, income, and drug type.
Insights:
Low-income areas, high incidents.
Urban centers, heavier response load.
Investigations, not enough
At that point, I realized this wasn’t a dashboard about drugs.
It was a story about system gaps.
1
110