The network for creativity
Join 1.25M professional creatives like you
Connect with clients, get discovered, and run your business 100% commission-free
Creatives on Contra have earned over $150M and we are just getting started
Back to feedPost
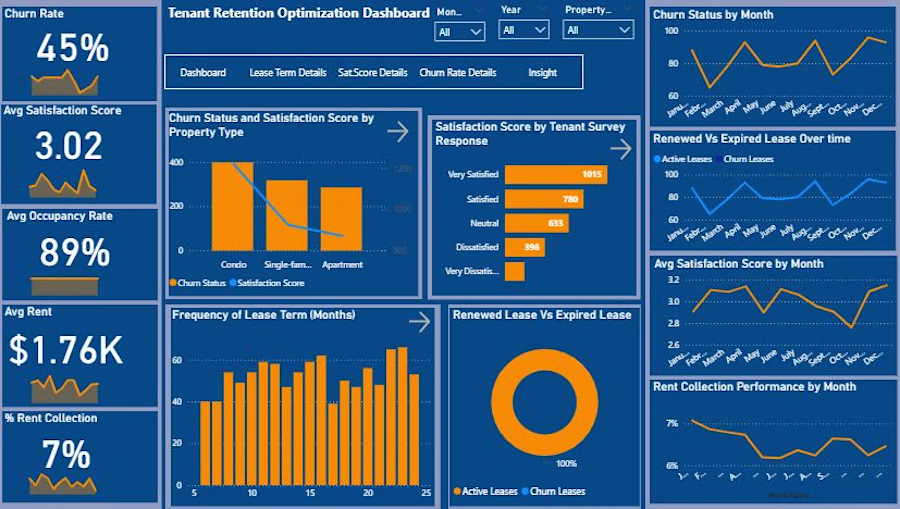
Now let’s talk #churn
I built this Tenant Retention Dashboard to help a real estate firm see what drives loyalty and where to act.
The goal was to find links between churn, satisfaction, and financial results.
Here’s the catch.
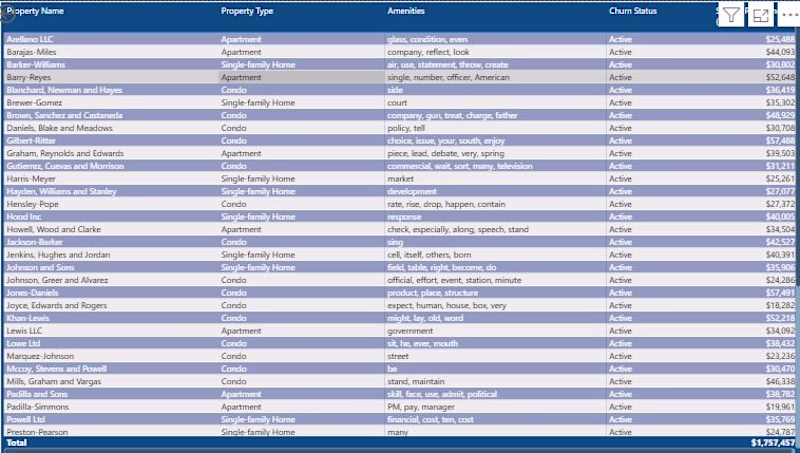
The data ended in September, but I reviewed it in November. So I assumed:
• Leases ending before today are #Churned.
• Leases ending after today are #Active.
It’s fine if the logic fits the business and you stay transparent.
Findings:
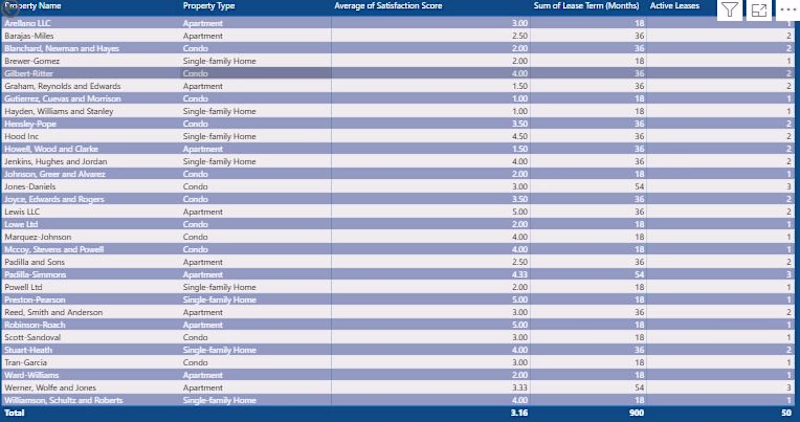
• Churn: 45%, mostly short-term and low-satisfaction tenants.
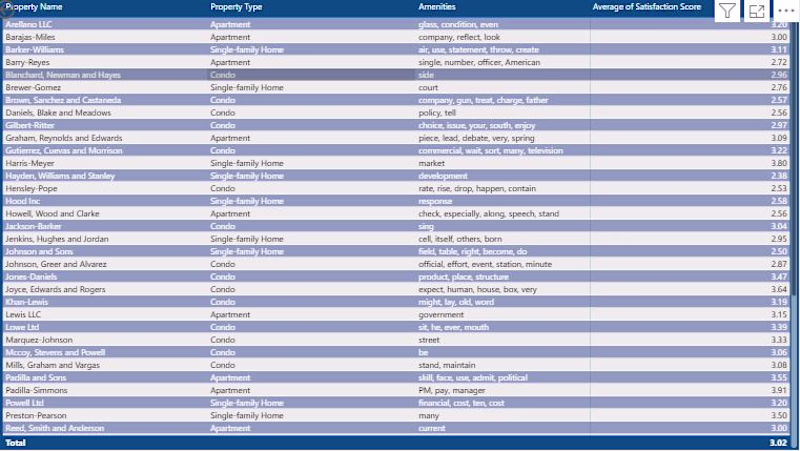
• Satisfaction: 3.02, neutral loyalty.
• Occupancy: 89%, strong demand, weak retention.
• Rent collection: low, poor follow-up.
The issue isn’t demand, it’s relationships. Tenants move in, not stay. Weak communication, slow maintenance, and low trust drive exits. Focus on keeping tenants, not chasing new ones
🚀 🚀
The network for creativity
Join 1.25M professional creatives like you
Connect with clients, get discovered, and run your business 100% commission-free
Creatives on Contra have earned over $150M and we are just getting started
Trending
Claude
Claude has entered the design space. How are you using Claude Design?
Contra University
Learn from expert creatives how to earn more using next-gen AI tools.
creativeaiflow
Creative AI workflows are evolving. What tools do you use, and what are their strengths and weaknesses?
freelancerlife
Freelancer life is wins, pivots, and everything in between. What’s yours right now?