
Muheet Khan
Founder of Datavrex | Data Analytics Consultant | Power BI
New to Contra
Muheet is building their profile!
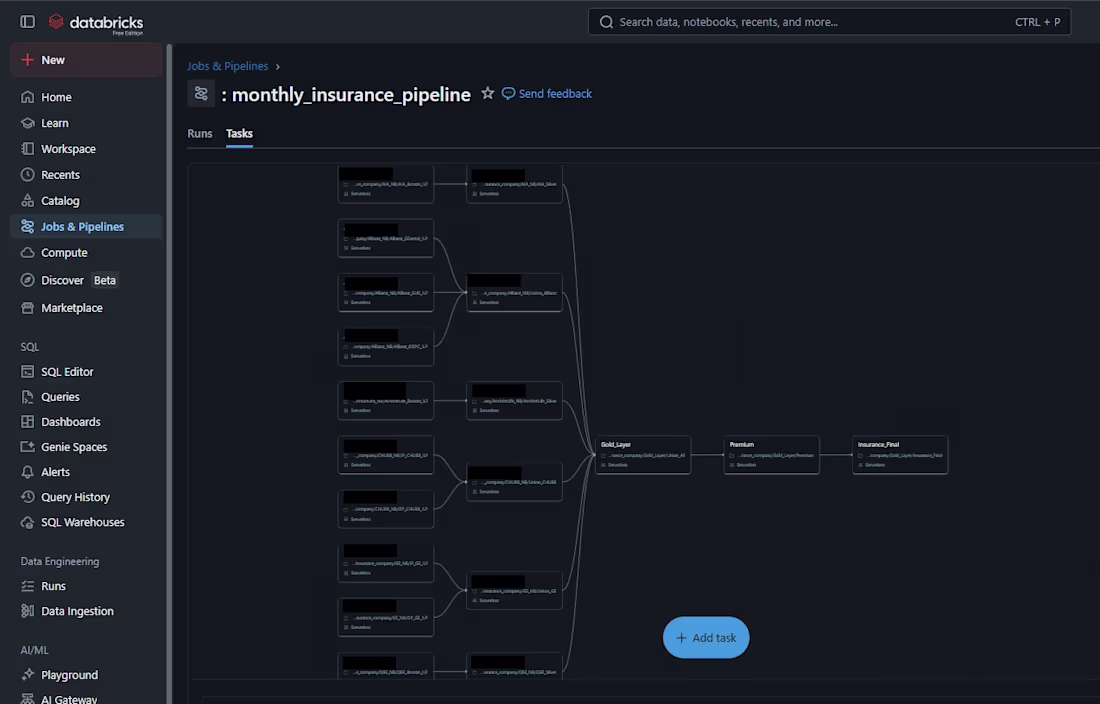
Databricks Data Engineering Pipeline
Overview
Built a scalable Databricks data pipeline to automate data ingestion, transformation, validation, and reporting workflows across multiple data sources.
Key Features
Automated ETL/ELT orchestration
Multi-source data ingestion and integration
Medallion architecture implementation (Bronze, Silver, Gold)
Data quality validation and monitoring
Workflow scheduling and dependency management
Optimized processing for analytics and reporting consumption
End-to-end pipeline automation
Business Impact
Reduced manual processing effort, improved data reliability, and enabled near real-time reporting by creating a robust and scalable data engineering framework.
Tools Used
Databricks, PySpark, SQL, Delta Lake, Data Engineering, ETL Automation
0
14
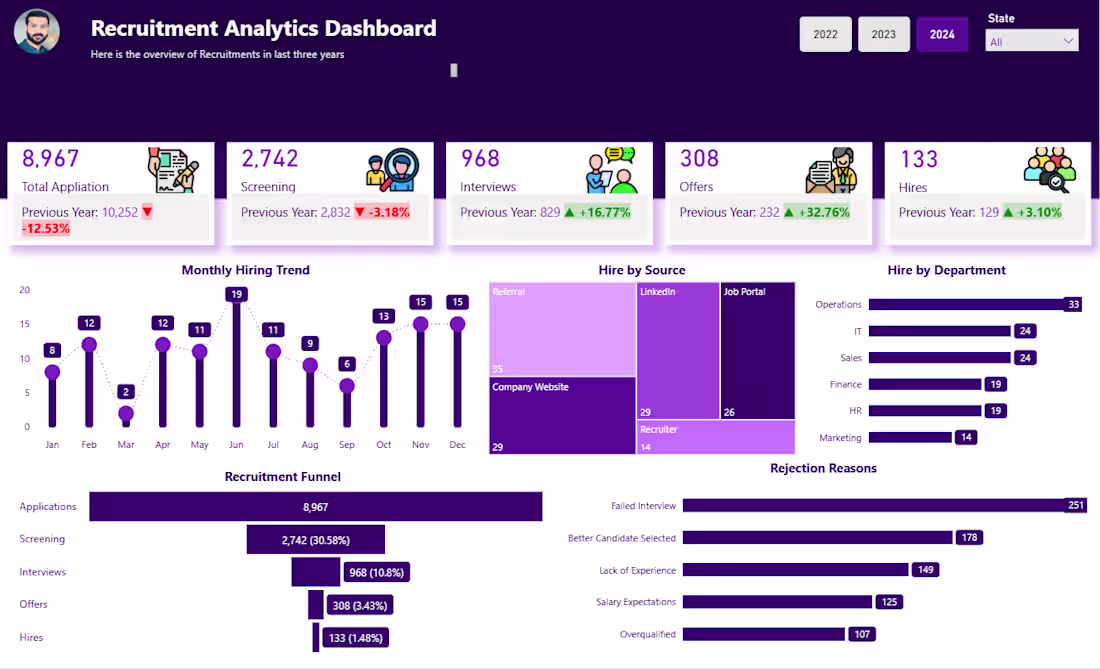
Recruitment Analytics Dashboard (Power BI)
Overview
Designed a Recruitment Analytics Dashboard to provide HR teams with complete visibility into hiring performance, recruitment funnels, sourcing effectiveness, and candidate conversion rates.
Key Features
End-to-end recruitment funnel analysis
Hiring trends and workforce planning insights
Application, screening, interview, offer, and hire metrics
Recruitment source effectiveness tracking
Department-wise hiring performance
Candidate rejection reason analysis
Year-over-Year recruitment comparison
Business Impact
Helped HR leaders streamline hiring processes, improve candidate conversion rates, and optimize recruitment channels for better talent acquisition outcomes.
Tools Used
Power BI, HR Analytics, DAX, Data Visualization
0
21
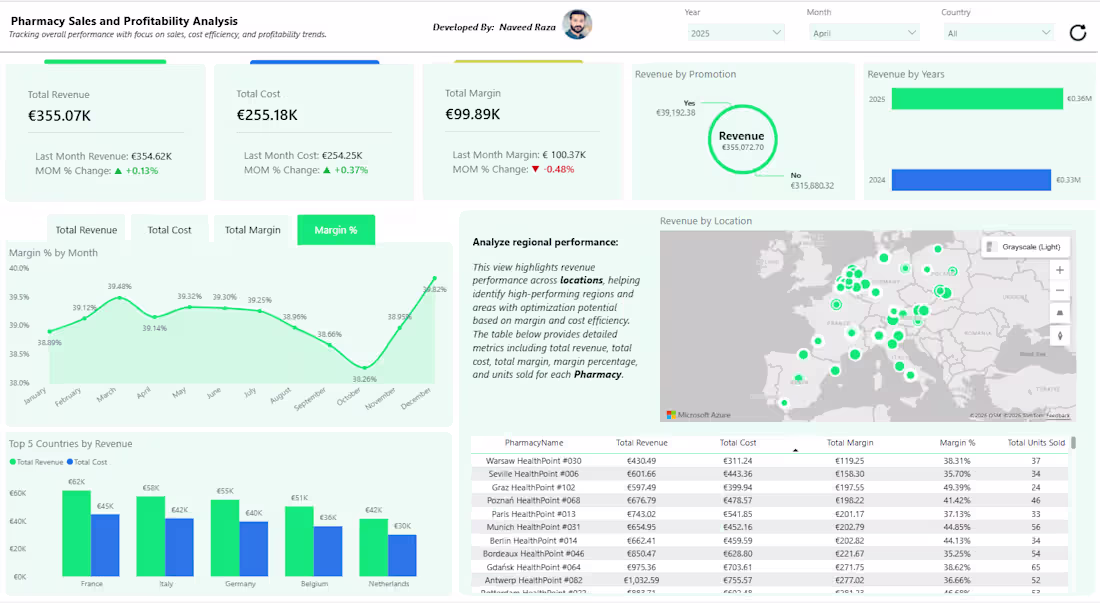
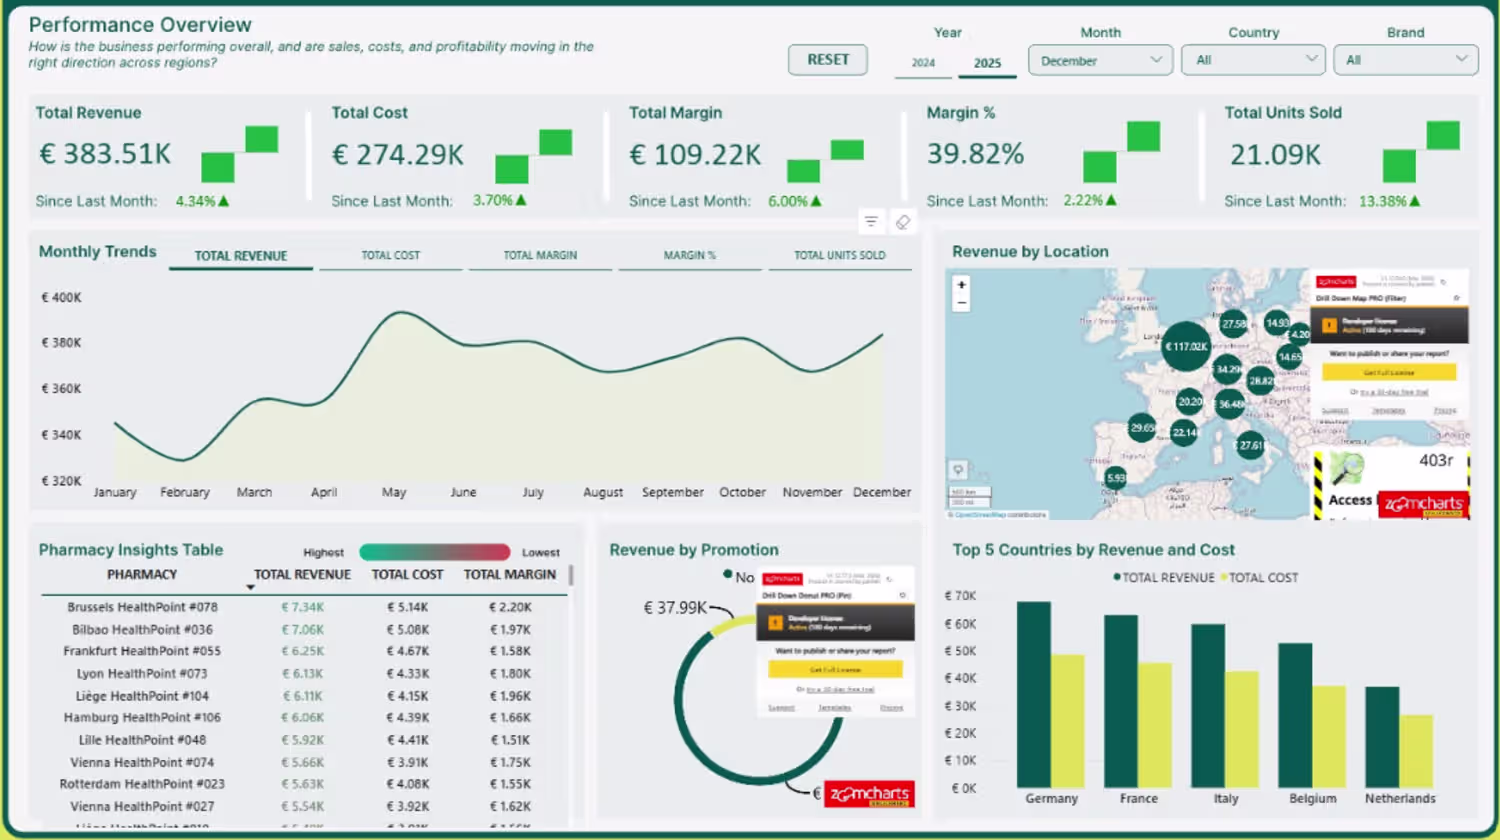
Pharmacy Sales & Profitability Analytics Dashboard (Power BI)
Overview
Developed an end-to-end Pharmacy Sales and Profitability Dashboard to monitor revenue, costs, margins, and regional performance across multiple pharmacy locations.
Key Features
Revenue, cost, and profit margin KPI tracking
Month-over-Month performance analysis
Geographic sales distribution with interactive mapping
Promotion effectiveness analysis
Country-wise revenue comparison
Pharmacy-level profitability and operational insights
Dynamic filtering by year, month, and country
Business Impact
Enabled management to identify high-performing locations, optimize promotional campaigns, and improve profit margins through data-driven decision-making.
Tools Used
Power BI, DAX, Power Query, Data Modeling, Geospatial Analytics
0
20
1. Sales Performance Dashboard (Power BI)
Overview:
Designed an interactive Sales Analytics Dashboard to provide executives with a real-time view of sales performance across regions, locations, and stores.
Key Features:
Revenue, profit, quantity, and discount KPIs
Year-over-Year comparison analysis
Monthly sales trend monitoring
Regional and location-based performance tracking
Store-level sales ranking and benchmarking
Dark-mode responsive design
Tools Used:
Power BI, DAX, Power Query, Data Modeling
2. British Airways Customer Review Analysis (Tableau)
Overview:
Built a customer sentiment and review analytics dashboard to help stakeholders understand passenger satisfaction trends across aircraft types, regions, and traveler segments.
Key Features:
Overall customer satisfaction analysis
Interactive geographic review mapping
Aircraft performance comparison
Traveler type and seat class segmentation
Historical rating trend analysis
Dynamic filtering and drill-down capabilities
Tools Used:
Tableau, Data Visualization, Data Analytics
3. Loan Portfolio & Risk Analytics Dashboard (Power BI)
Overview:
Developed a comprehensive lending analytics solution to monitor loan performance, repayment behavior, revenue generation, and portfolio risk.
Key Features:
Loan application and funding metrics
Revenue and profitability tracking
Bad loan and default analysis
Loan status distribution monitoring
State-level performance analysis
Loan purpose and repayment insights
Business Impact:
Enabled stakeholders to identify risk exposure, optimize lending decisions, and monitor portfolio health through a centralized reporting platform.
Tools Used:
Power BI, DAX, Power Query, Financial Analytics
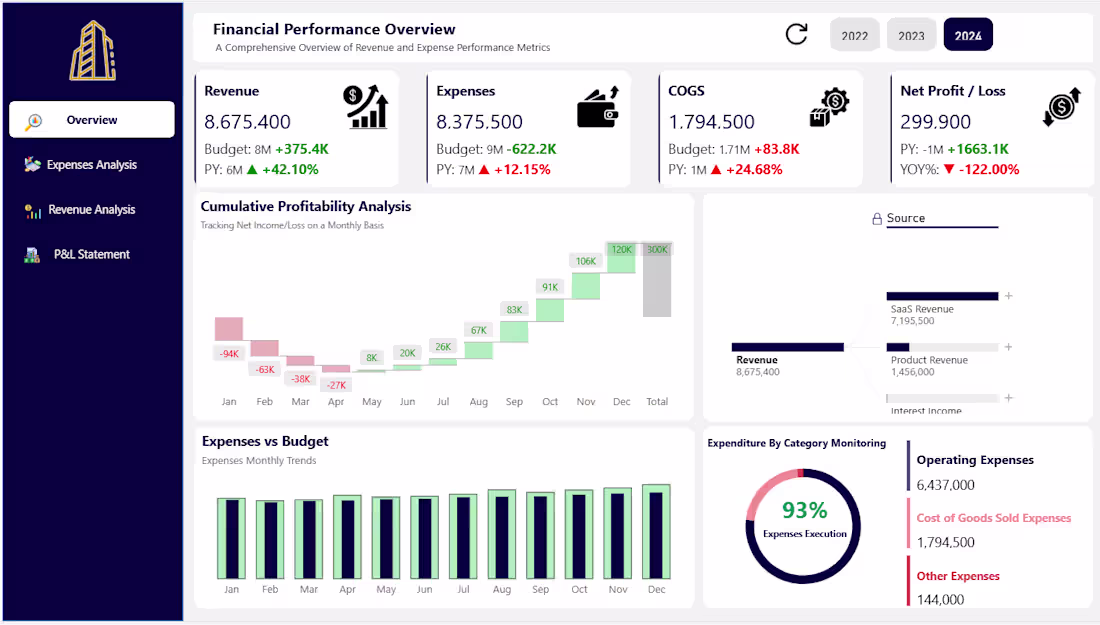
4. Financial Performance Dashboard (Power BI)
Overview:
Created an executive-level financial dashboard providing a complete overview of revenue, expenses, profitability, and budget performance.
Key Features:
Revenue, expenses, COGS, and profit tracking
Budget vs Actual analysis
Year-over-Year performance comparison
Profitability waterfall analysis
Revenue source contribution breakdown
Expense monitoring and category analysis
Interactive period selection and KPI monitoring
Business Impact:
Helped management track financial health, identify cost-saving opportunities, and make data-driven strategic decisions.
Tools Used:
Power BI, Financial Reporting, DAX, Data Modeling
0
29