Molla Adugna
Strategic Data Analyst | 18+ Years Clinical Expertise
New to Contra
Molla is ready for their next project!
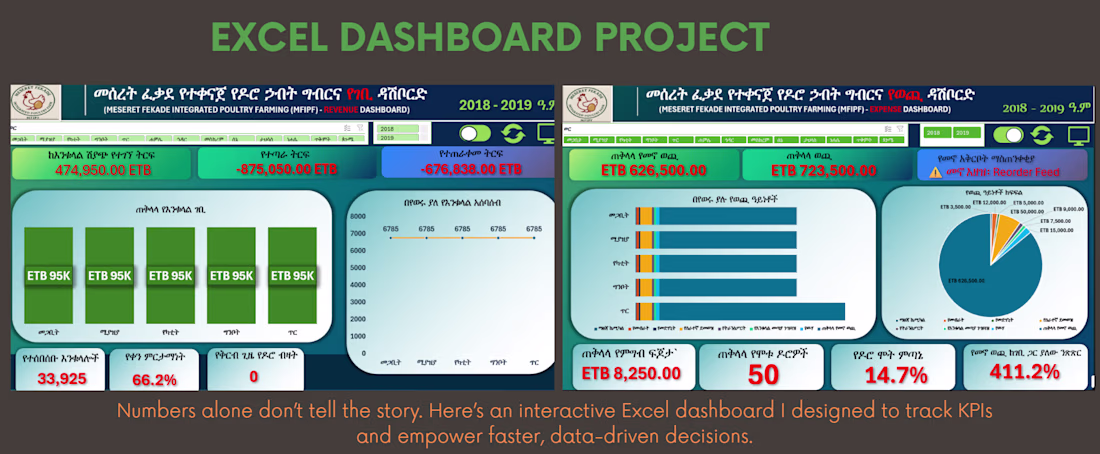
Turning Numbers into Insights with Excel Dashboards
Raw numbers don’t tell the full story. I designed an interactive Excel dashboard with KPIs, charts, and slicers to give leadership real-time visibility into financial performance.
This dashboard reduced reporting time by 40% and empowered faster, data-driven decisions.
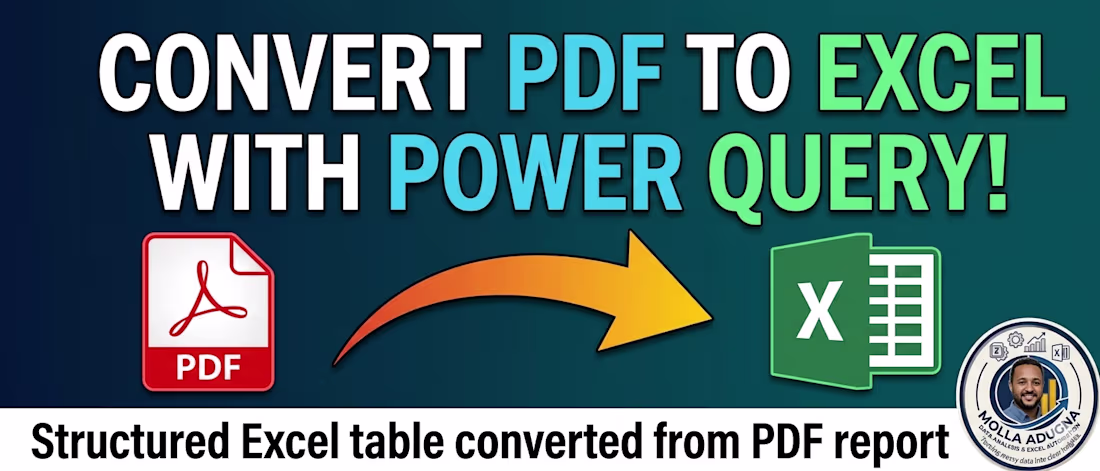
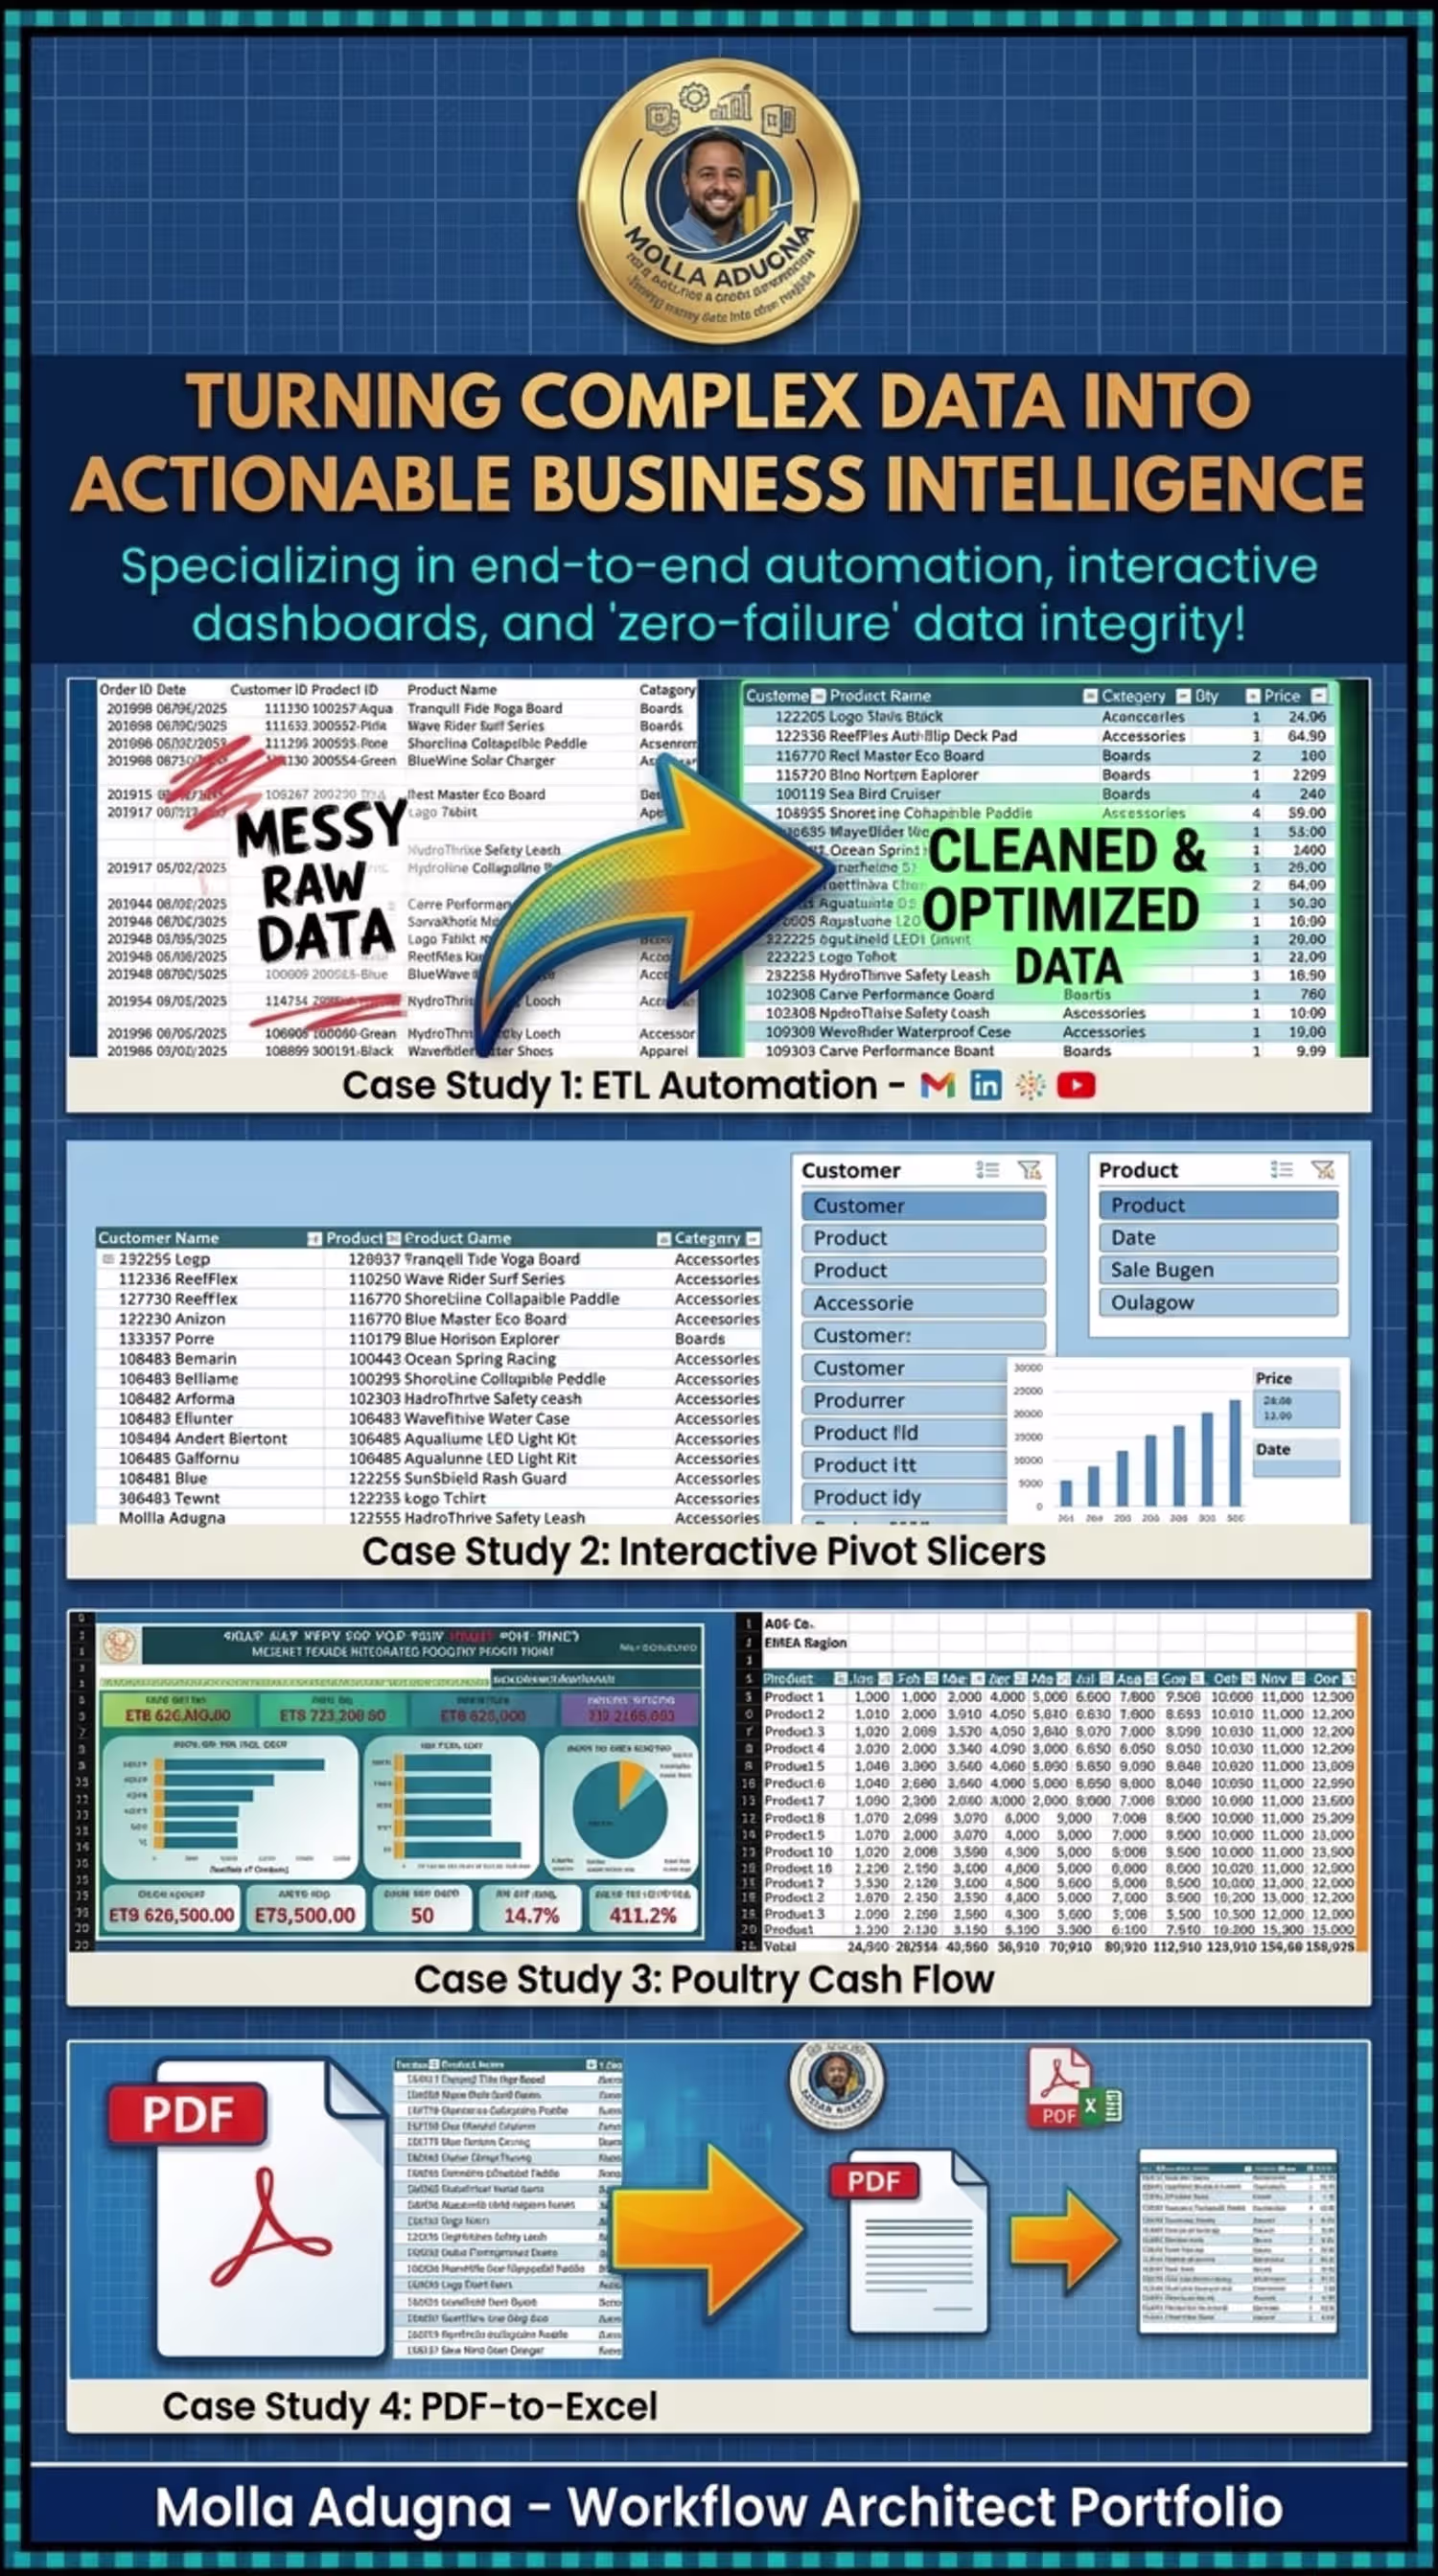
From Static PDFs to Analysis-Ready Excel
Many businesses waste hours manually retyping PDF reports into spreadsheets. I built a workflow that converts complex PDFs into clean, structured Excel datasets — saving 10+ hours per month and eliminating repetitive errors.
Here’s a link...