
Mohamed Hosni
Power Platform Developer | Automating workflows
New to Contra
Mohamed is building their profile!

Request & Approval Tracker — Power Platform
A complete request-and-approval system — auto-numbered tickets, SLA-based deadlines, one-click approvals, and automatic escalation — built entirely on Microsoft 365.
The problem
Most small and mid-sized teams manage requests — IT tickets, HR approvals, vendor sign-offs — through email threads and spreadsheets. Nothing is tracked, nobody knows what's pending, and approvals fall through the cracks with no accountability trail.
What I built
A full request-and-approval system on Microsoft's Power Platform:
Smart intake — requests are auto-numbered by type (e.g. IT-0001), timestamped, and assigned a deadline automatically based on urgency
One-click approvals — approvers see everything they need (requester, description, priority, due date) and can approve or reject instantly
Automatic escalation — if a request passes its deadline without action, it escalates itself to a second-level approver and sends a notification — nothing sits forgotten
Live dashboard — real-time stats on open requests, pending approvals, and monthly throughput
Automated email notifications — requesters and approvers are notified at every status change, with zero manual follow-up
Built with: SharePoint, Power Apps, Power Automate
Why it matters
This isn't a mockup — it's a fully working system, end to end. Because it's built on Microsoft's own platform, it plugs directly into any company already using Microsoft 365 — no new software to buy, no new logins to manage.
Watch the full walkthrough below.
0
30
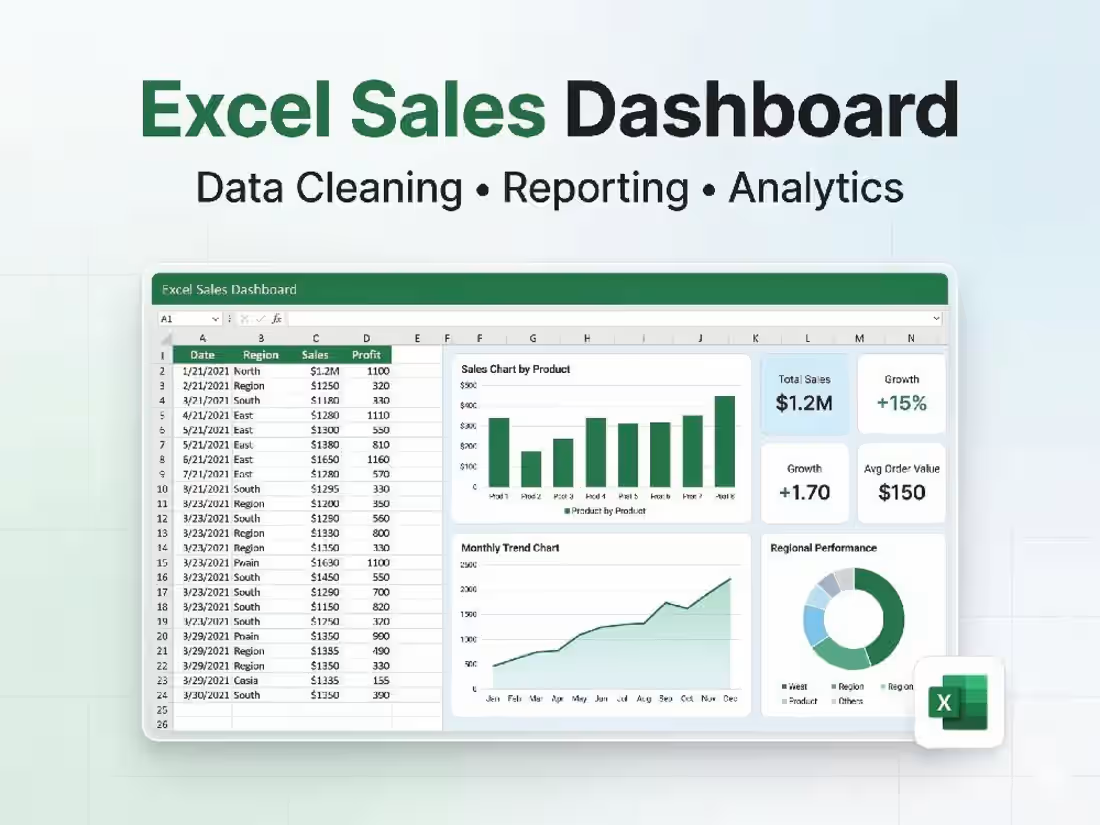
This project demonstrates how raw business data can be transformed into a clean, structured dataset and converted into an interactive reporting dashboard using Microsoft Excel.
The dataset contained inconsistent formatting and unstructured information. I cleaned and organized the data, then built a dashboard to visualize key sales metrics and trends.
The final solution allows stakeholders to quickly understand performance through automated summaries and visual charts.
0
12
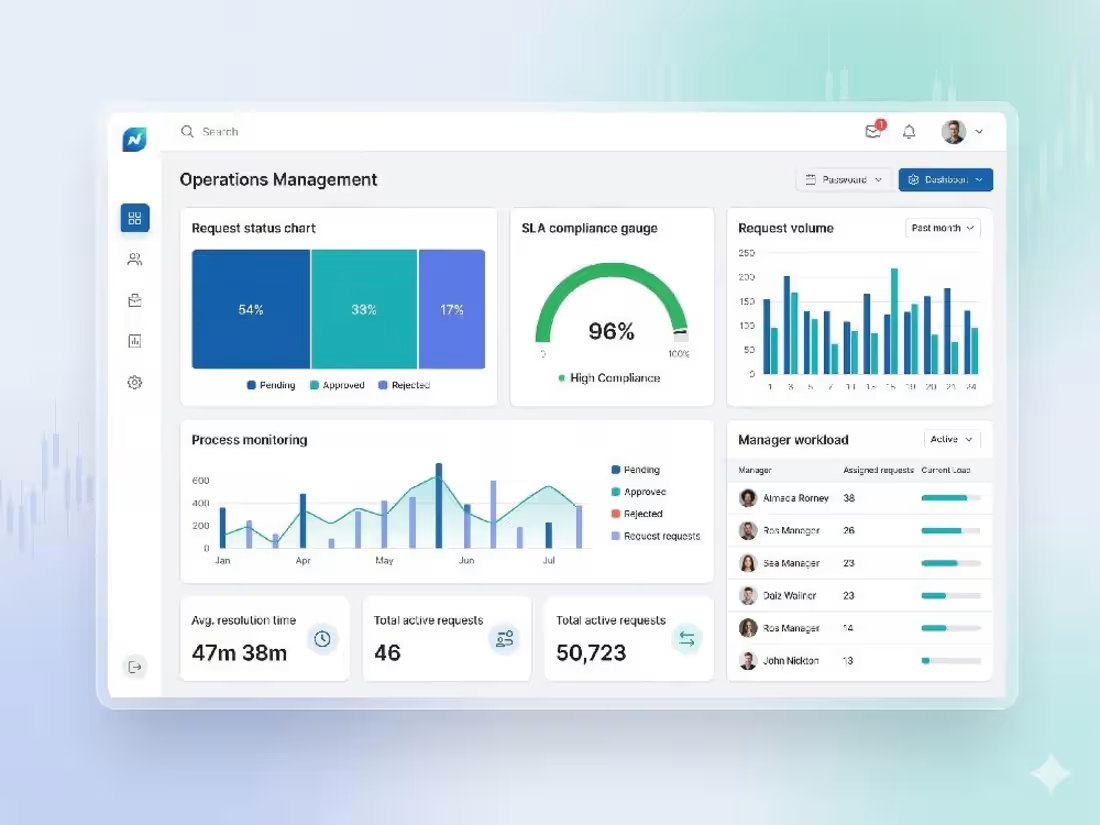
This project demonstrates how operational service requests can be tracked, monitored, and analyzed through a structured request management system. The solution organizes request records, tracks request status, and monitors SLA performance to help managers identify delays and workload distribution. A reporting dashboard summarizes request activity, status distribution, and SLA compliance, allowing teams to quickly understand operational performance and identify bottlenecks.
0
13
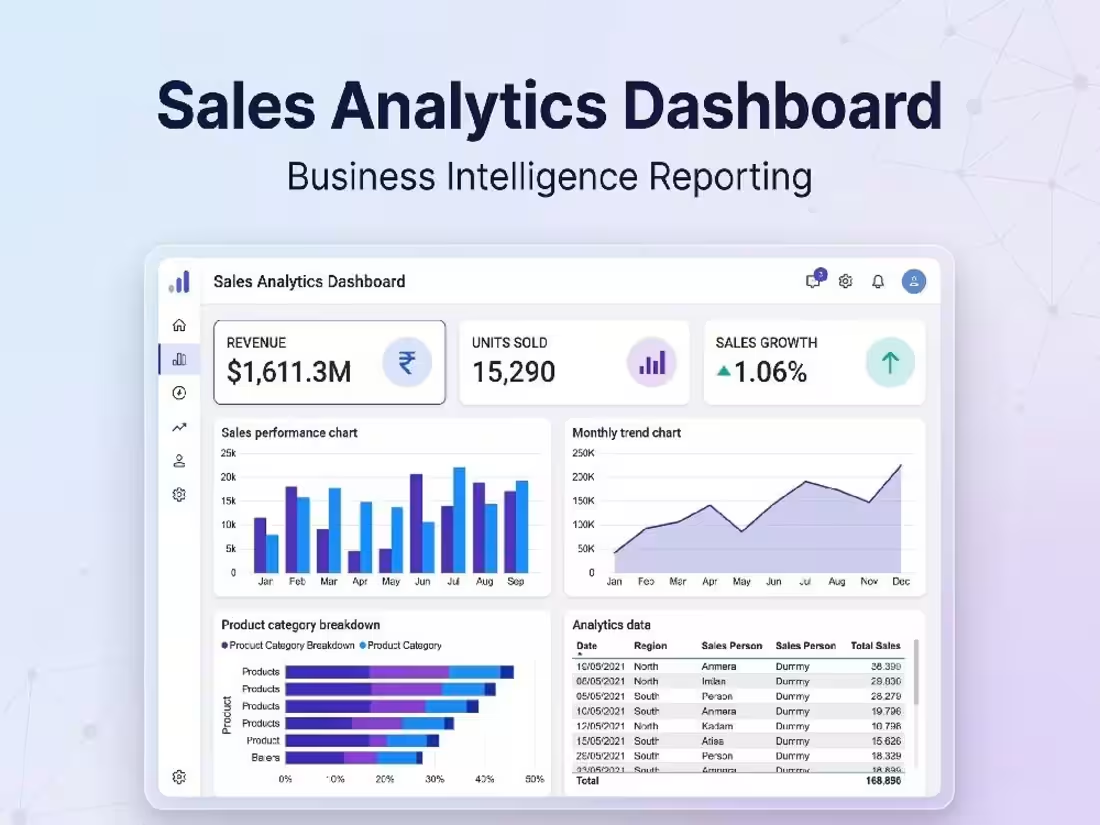
This project demonstrates how business sales data can be transformed into a structured dataset and converted into an interactive analytics dashboard for performance monitoring and decision-making.
I prepared the dataset, structured key metrics, and designed a reporting interface that highlights important business KPIs such as revenue performance, product sales distribution, and monthly trends.
The dashboard allows users to quickly analyze sales performance and identify trends across regions, products, and time periods.
0
16