
Michael Yu
FP&A, financial modeling & analytics automation
New to Contra
Michael is building their profile!
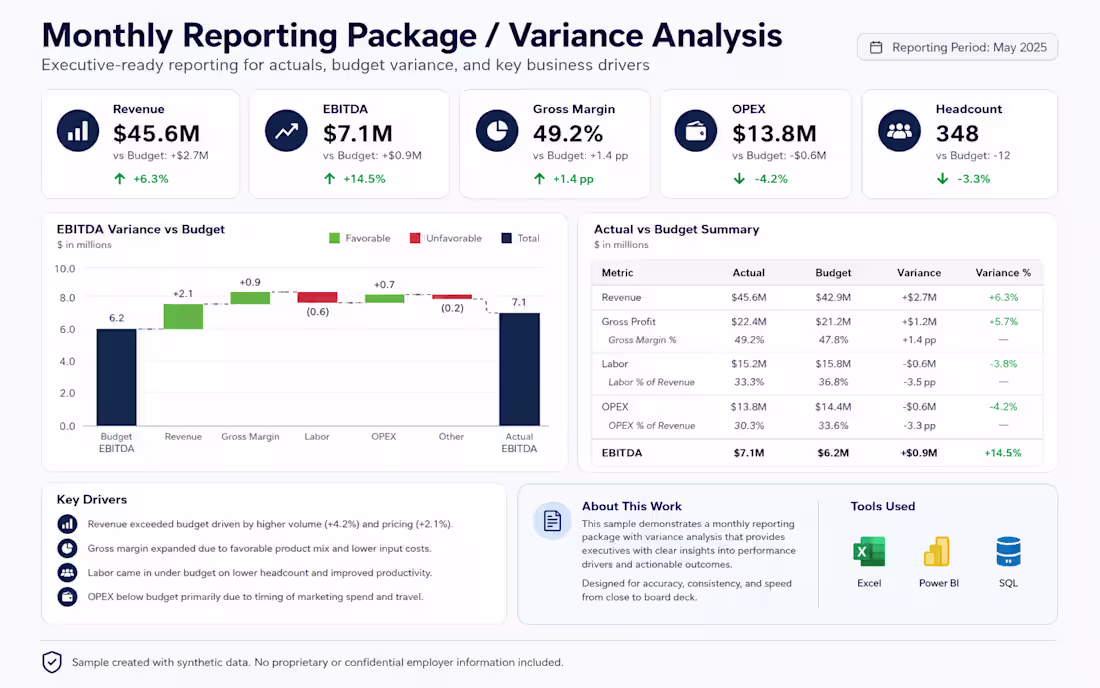
This is a synthetic monthly reporting package created to demonstrate how I summarize financial performance, budget variance, and key business drivers for executive review. The example highlights revenue, EBITDA, gross margin, OPEX, headcount, actuals vs. budget, and variance commentary in a clear, decision-ready format.
The focus of this work is turning financial and operational data into a concise reporting view that helps leadership understand what changed, why it changed, and what actions may be needed. It reflects my experience with FP&A reporting, variance analysis, KPI tracking, forecasting support, and executive-ready finance outputs.
All data shown is sample data and does not include proprietary employer information.
0
2
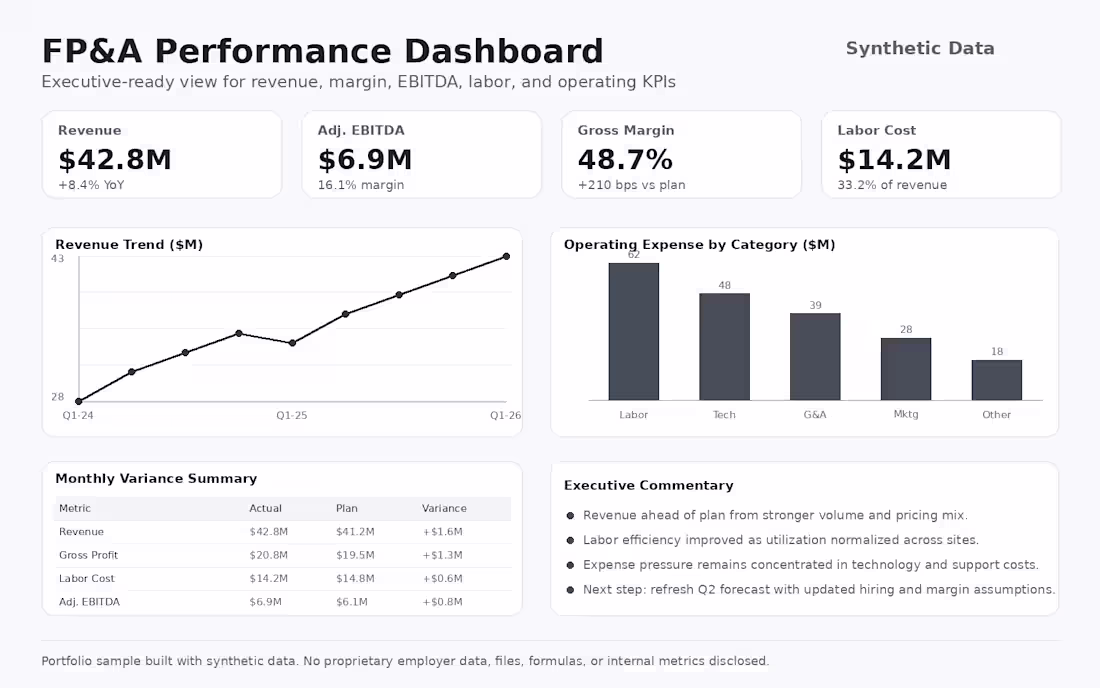
This is a synthetic FP&A dashboard created to demonstrate how I turn financial and operational data into clear, executive-ready reporting. The dashboard highlights key metrics such as revenue, EBITDA, gross margin, labor cost, operating expenses, budget variance, and performance commentary.
The focus of this work is helping leadership quickly understand business performance, identify trends, explain variances, and make better planning decisions. It reflects my experience building KPI dashboards, monthly reporting packages, forecast views, and financial analysis for data-driven organizations.
All data shown is sample data and does not include proprietary employer information.
0
11
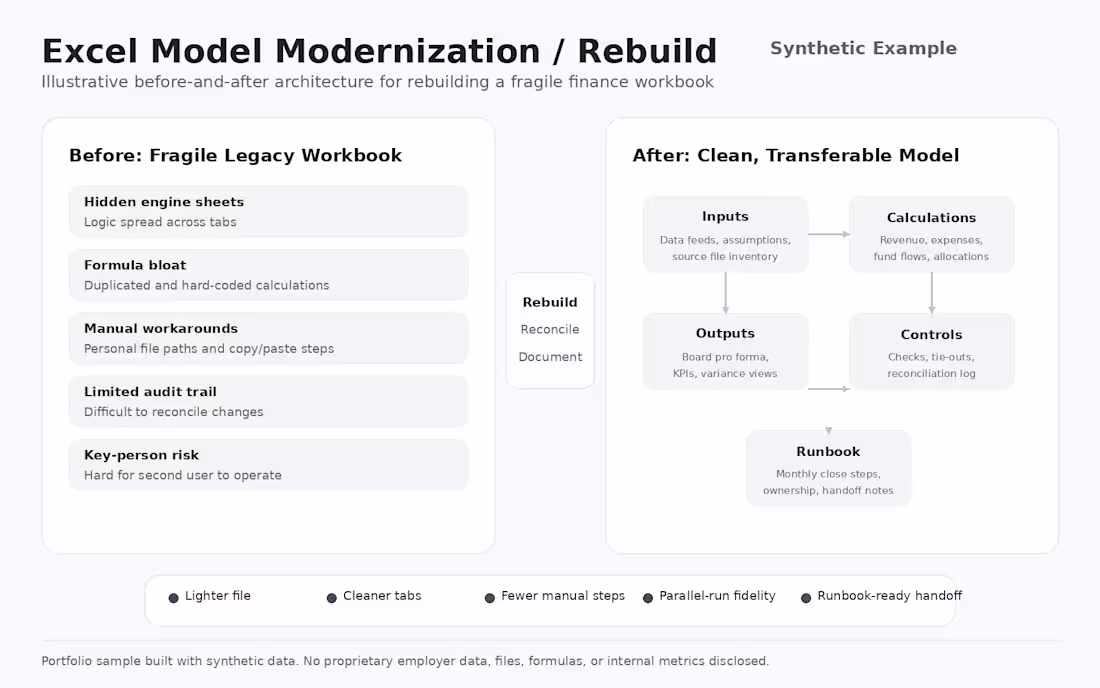
This is a synthetic model modernization example created to show how I approach rebuilding complex, fragile Excel finance models into cleaner, more usable planning and reporting tools.
The example illustrates a before-and-after structure: moving from hidden tabs, formula bloat, manual workarounds, and limited auditability to a cleaner model with dedicated input, calculation, output, control, and documentation sections. The goal is to make the model easier to operate, reconcile, update, and hand off to another finance team member.
This reflects the type of FP&A and finance systems work I have done across financial modeling, forecasting, reporting automation, KPI analysis, and executive-ready finance outputs.
All data and structures shown are illustrative and do not include proprietary employer information.
0
15
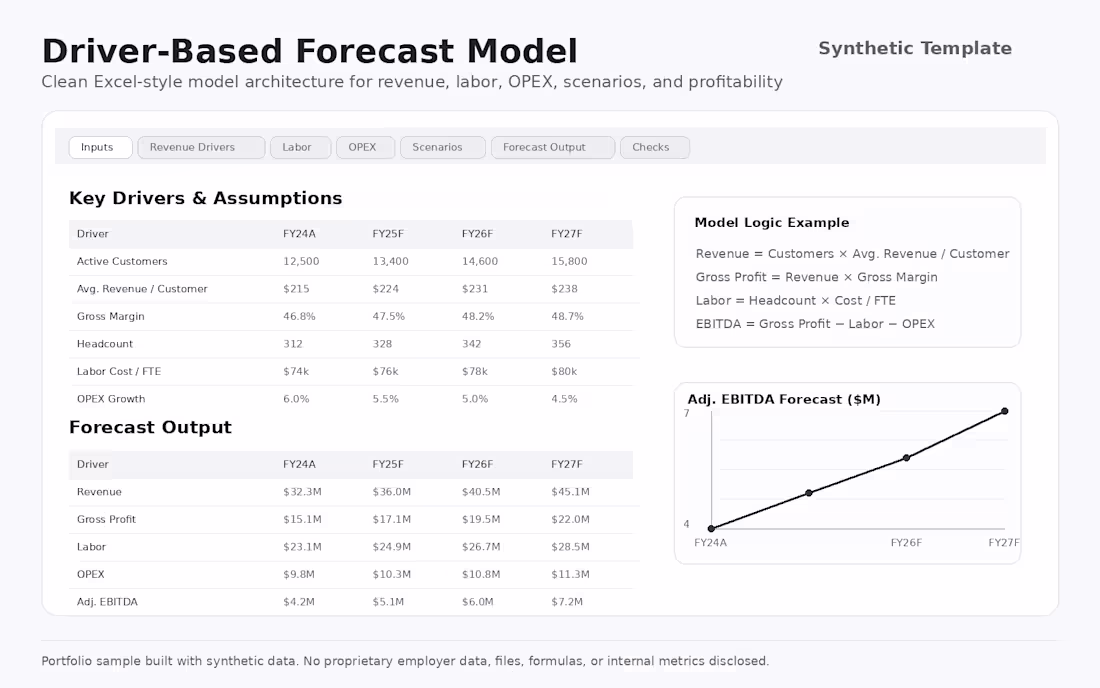
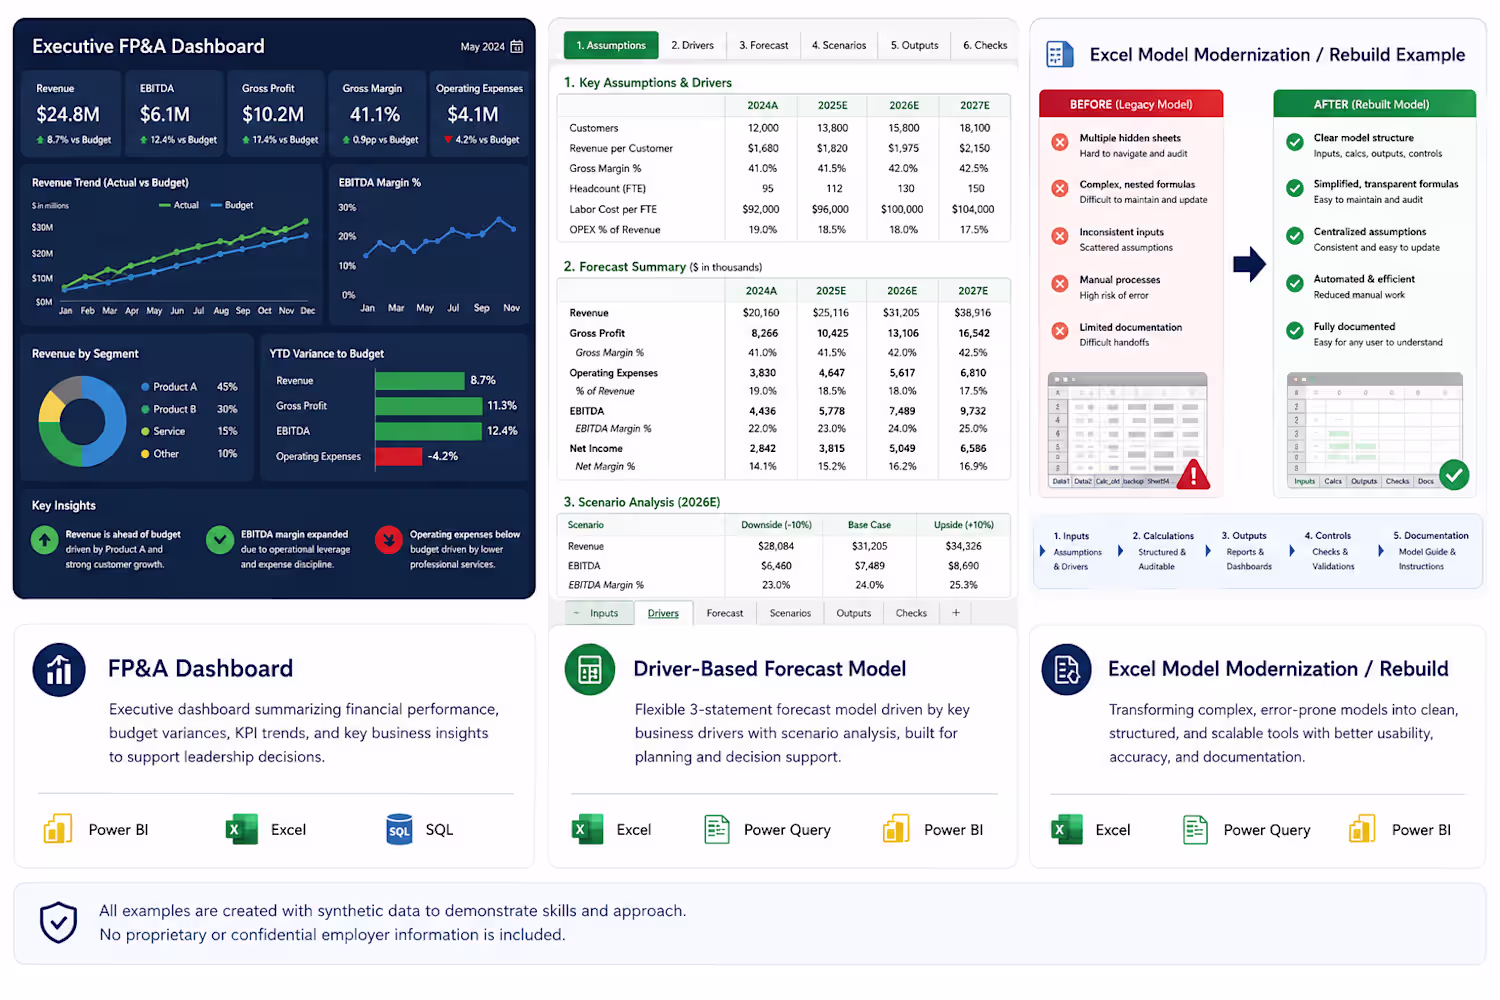
This is a synthetic driver-based forecast model created to demonstrate how I structure financial planning tools for growing businesses. The model connects key operating drivers such as customers, revenue per customer, gross margin, headcount, labor cost, and OPEX growth to forecasted revenue, gross profit, EBITDA, and profitability trends.
The focus of this work is clean model architecture: clear input tabs, transparent formulas, scenario flexibility, output summaries, and built-in checks. It reflects the type of FP&A work I have done across budgeting, forecasting, KPI analysis, executive reporting, and finance systems workflows.
All data shown is sample data and does not include proprietary employer information.
0
19